
Briefly: In our opinion, speculative short positions are favored (with stop-loss at 2,120, and profit target at 2,000, S&P 500 index).
Our intraday outlook is bearish, and our short-term outlook is bearish. Our medium-term outlook remains bearish, as the S&P 500 index extends its lower highs, lower lows sequence:
Intraday outlook (next 24 hours): bearish
Short-term outlook (next 1-2 weeks): bearish
Medium-term outlook (next 1-3 months): bearish
Long-term outlook (next year): neutral
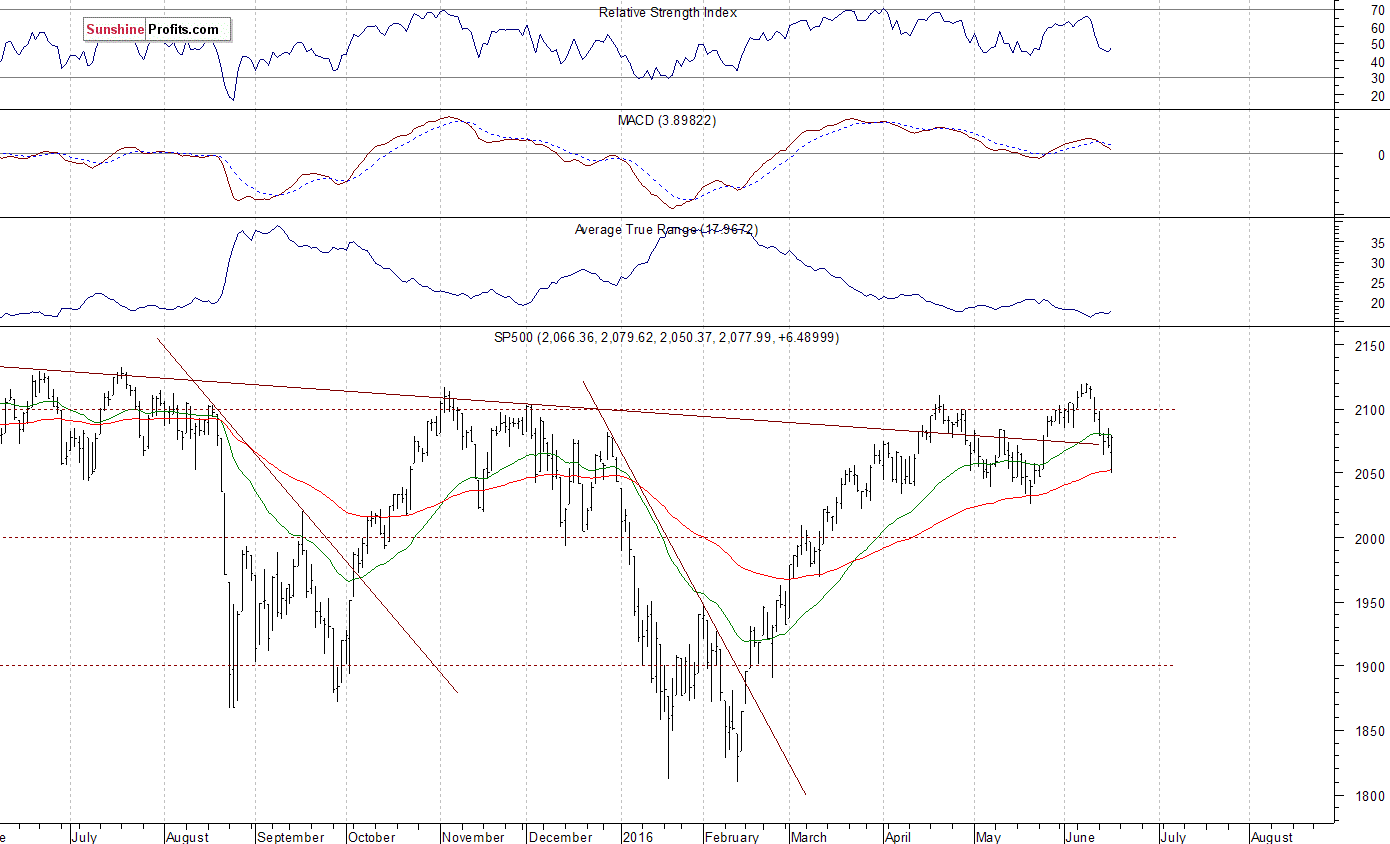
The main U.S. stock market indexes gained 0.2-0.5% on Thursday, bouncing off short-term support level, as investors reacted to economic data releases, among others. The S&P 500 index got close to 2,050 mark, before rebounding by almost 30 points. The nearest important level of support remains at around 2,050, marked by previous local highs. On the other hand, the nearest important level of resistance is at around 2,080-2,085, marked by previous support level. The next resistance level remains at 2,100 mark. Last year's highs along the level of 2,100 continue to act as medium-term resistance level. Will the market break above these medium-term highs and continue its seven-year long bull market? Or will it reverse its over three-month long uptrend off medium-term support level at around 1,800?
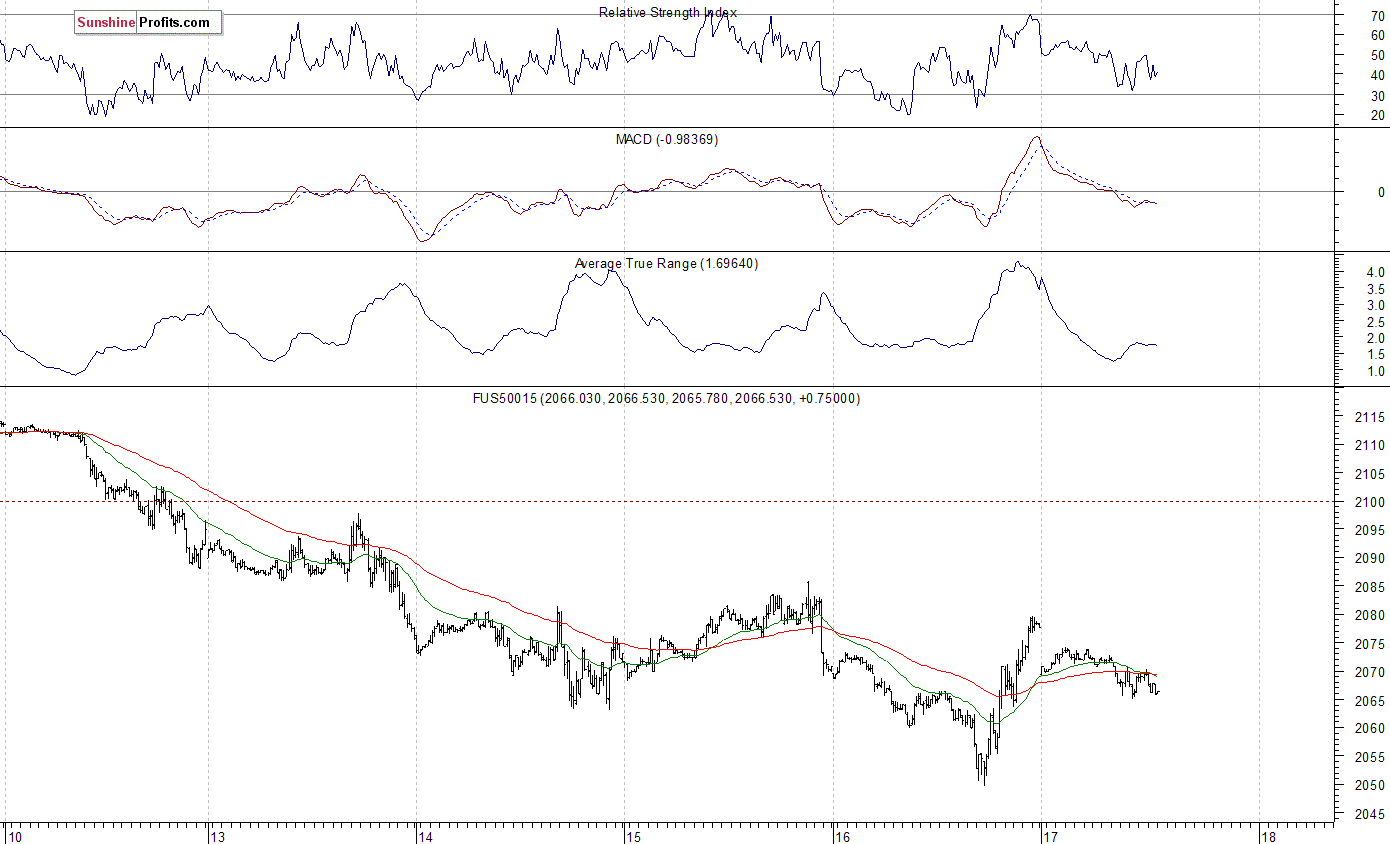
Expectations before the opening of today's trading session are virtually flat, with index futures currently down 0.1%. The European stock market indexes have gained 1.1-1.3% so far. Investors will now wait for some economic data announcements: Building Permits, Housing Starts at 8:30 a.m. The S&P 500 futures contract trades within an intraday consolidation, following yesterday's bounce. Is this a new uptrend, or just quick upward correction before another leg down? The nearest important resistance level is at around 2,080-2,085, marked by recent local highs. On the other hand, support level is at 2,050-2,055, as we can see on the 15-minute chart:
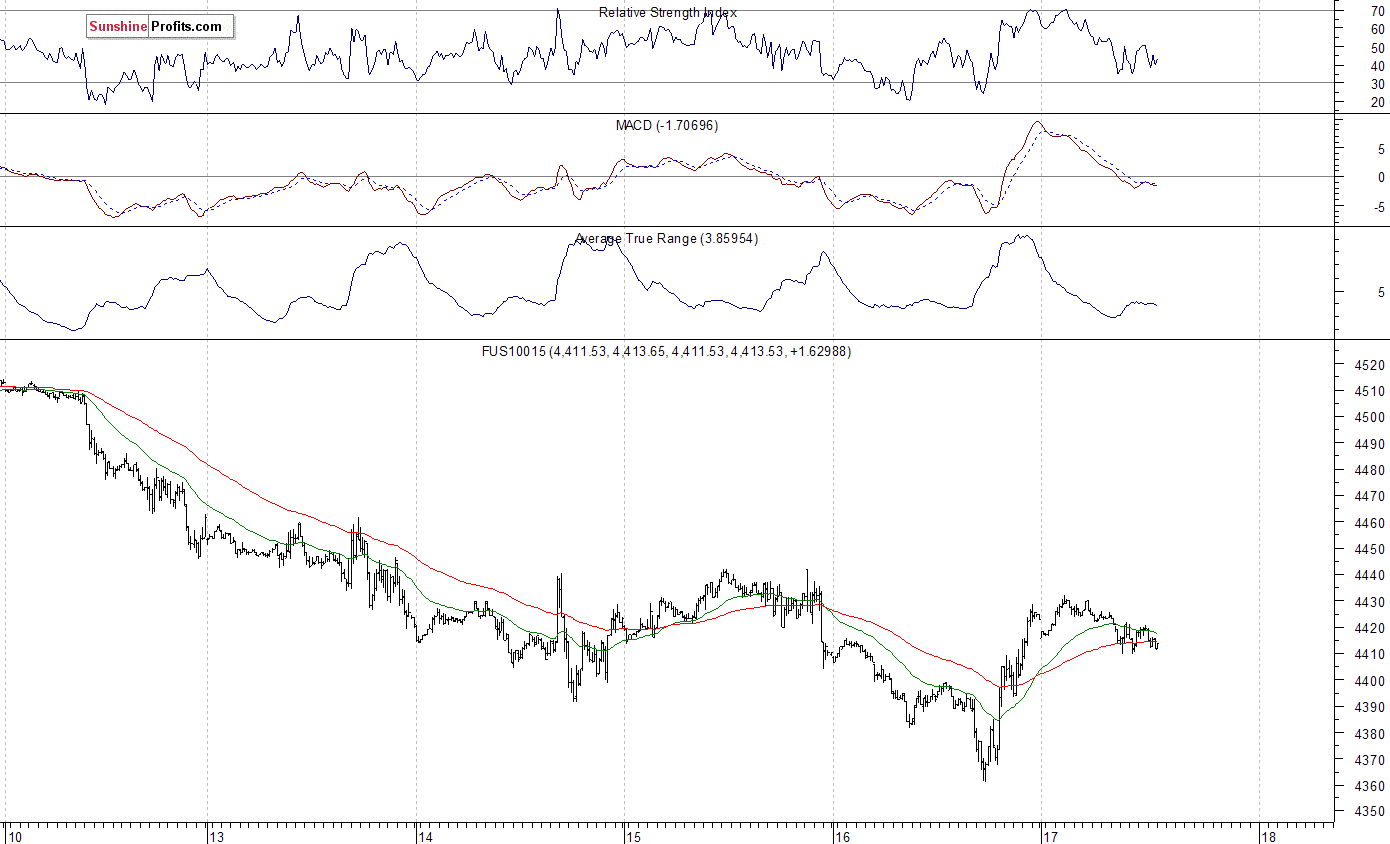
The technology Nasdaq 100 futures contract follows a similar path, as it retraces some of its yesterday's move up. The nearest important level of resistance is at around 4,430, marked by local highs. On the other hand, support level remains at 4,360-4,400, as the 15-minute chart shows:
Concluding, the the S&P 500 index extended its short-term downtrend yesterday, before bouncing off support level at around 2,050. We continue to maintain our speculative short position (opened on June 1 at 2,093.94 - S&P 500 index). Our stop-loss level remains at 2,120, and profit target is at 2,000 (S&P 500 index). You can trade S&P 500 index using futures contracts (S&P 500 futures contract - SP, E-mini S&P 500 futures contract - ES) or an ETF like the SPDR S&P 500 ETF - SPY. It is always important to set some exit price level in case some events cause the price to move in the unlikely direction. Having safety measures in place helps limit potential losses while letting the gains grow.
Thank you.
Paul Rejczak
Stock Trading Strategist
Stock Trading Alerts

