
Briefly: In our opinion, no speculative positions are justified.
Our intraday outlook is now neutral, and our short-term outlook is neutral:
Intraday outlook (next 24 hours): neutral
Short-term outlook (next 1-2 weeks): neutral
Medium-term outlook (next 1-3 months): bearish
Long-term outlook (next year): bullish
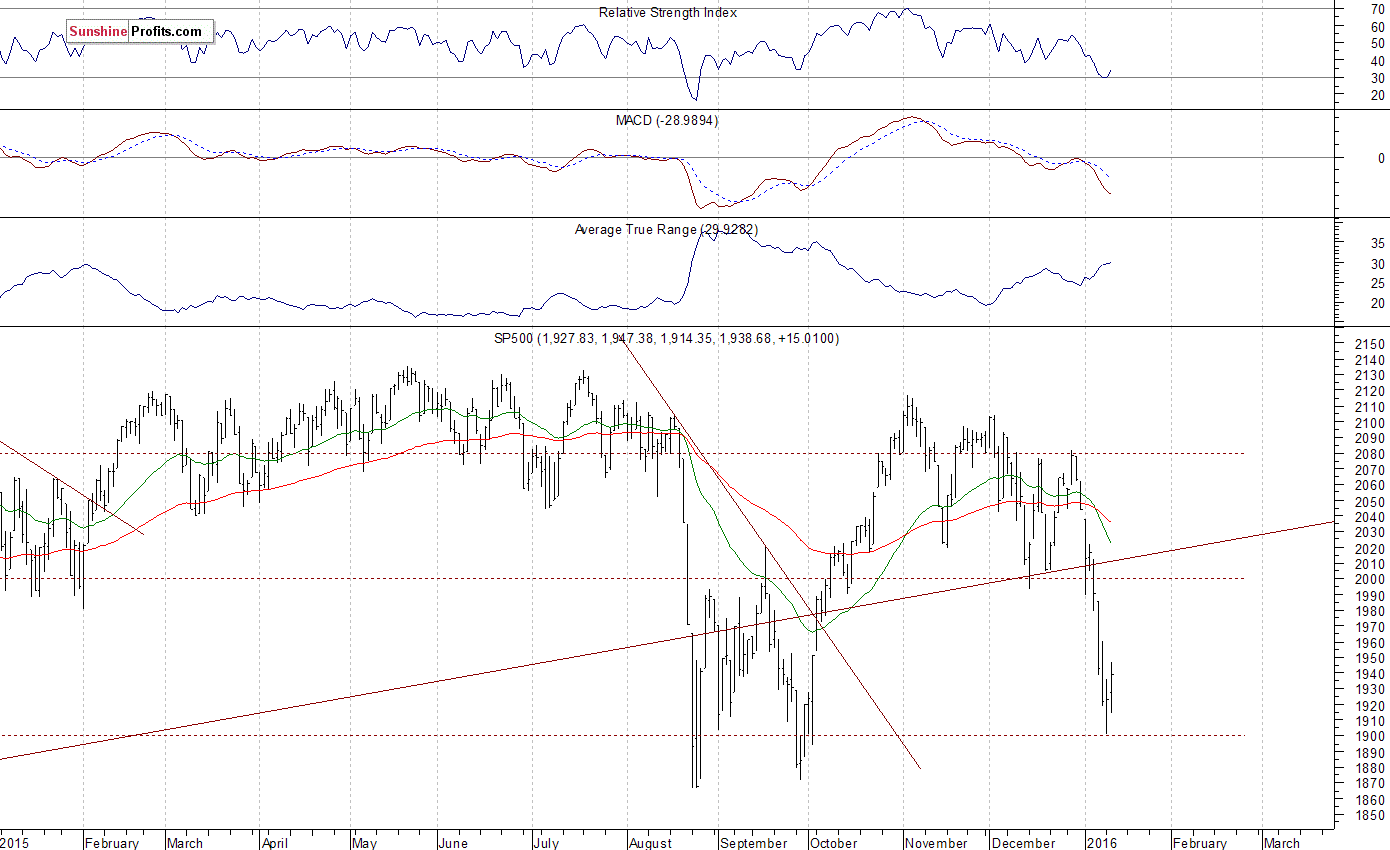
The main U.S. stock market indexes gained between 0.7% and 1.2% on Tuesday, retracing a part of their recent move down, as investors hunted price bargains. The S&P 500 index bounced off support level of 1,900. The next important level of support is at around 1,870, marked by last year's August - September lows. On the other hand, the nearest important level of resistance is at 1,980-2,000, marked by December local lows, among others. There have been no confirmed positive signals so far. It looks like an upward correction following recent sell-off so far. We still can see short-term oversold conditions:
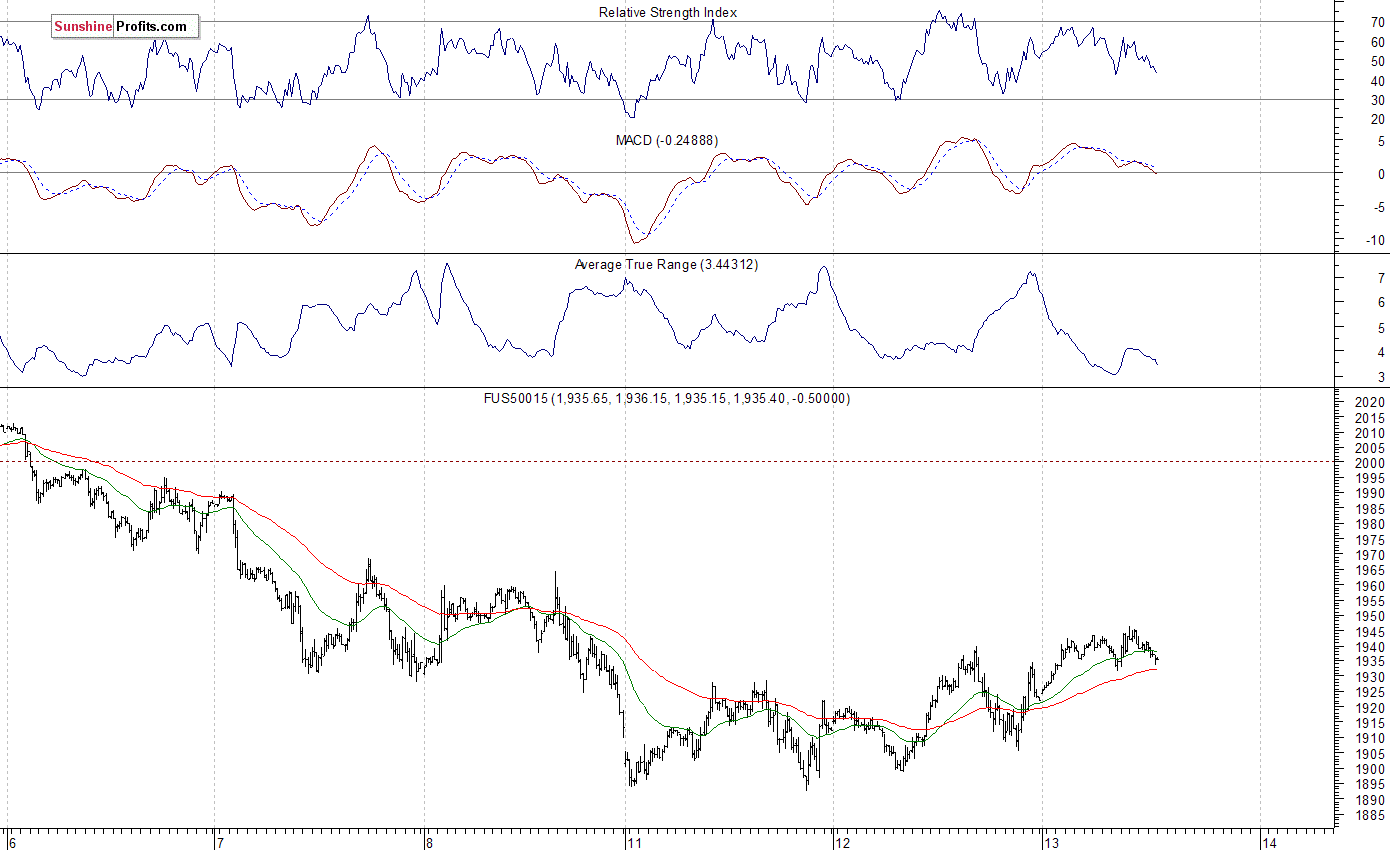
Expectations before the opening of today's trading session are positive, with index futures currently up 0.5-0.7%. The European stock market indexes have gained 0.9-1.4% so far. Investors will now wait for some economic data announcements: Crude Inventories at 10:30 a.m., Fed' Beige Book report at 2:00 p.m. The S&P 500 futures contract trades within an intraday consolidation, as it fluctuates along the level of 1,940. The nearest important level of support is at around 1,900-2,920. On the other hand, resistance level is at 1,950-1,960, marked by previous local highs. Will this move up continue? For now, it looks like an upward correction following short-term downtrend. However, it may extend further towards previously broken support level of 1,980-2,000:
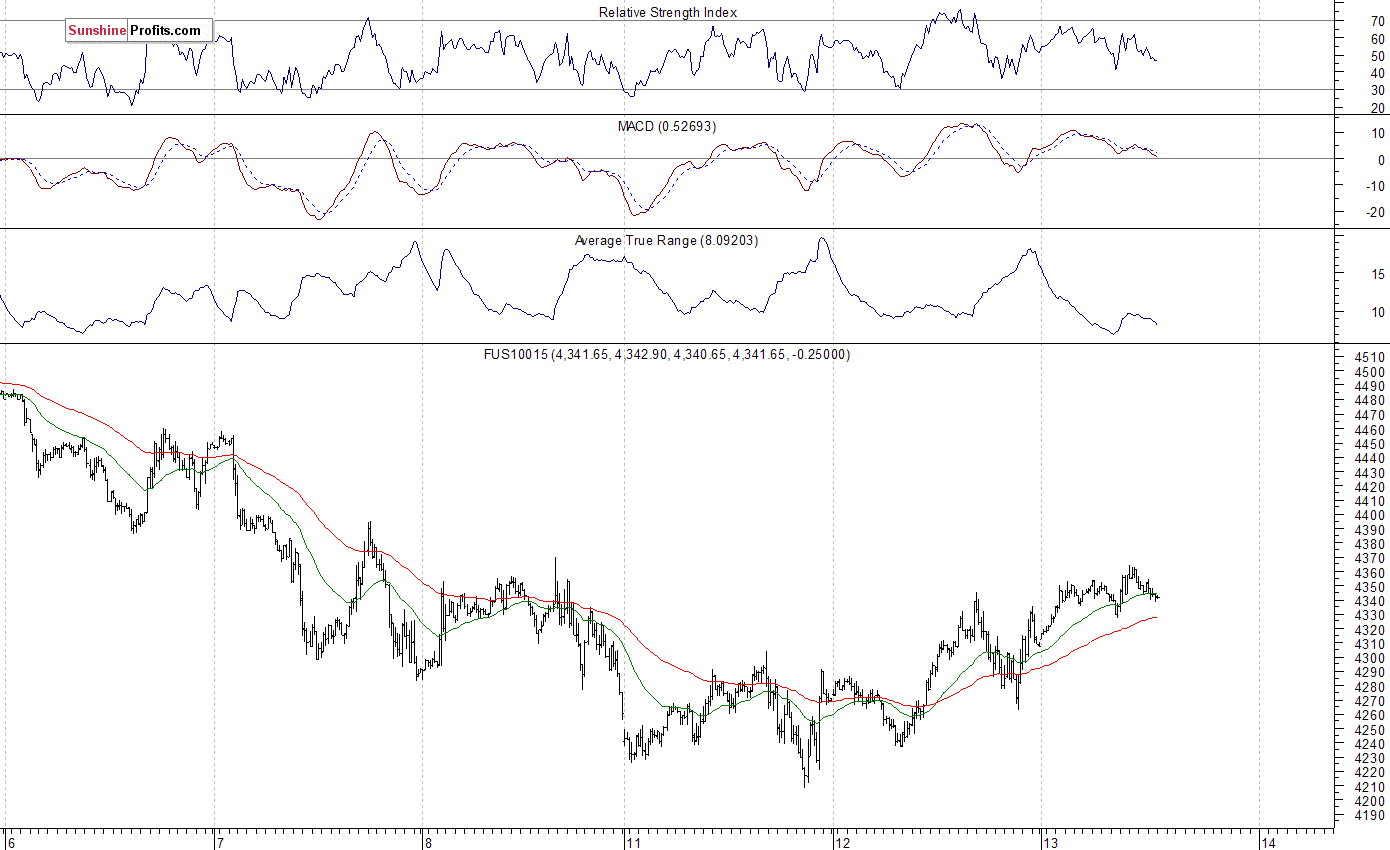
The technology Nasdaq 100 futures contract trades within a similar intraday consolidation, as it fluctuates along the level of 4,350. Is this a new uptrend or just an upward correction following last week's sell-off. There have been no confirmed short-term positive signals so far:
Concluding, the broad stock market broke its making-new-lows pattern streak yesterday. Will the downtrend reverse? Or is it just an upward correction. For now, it looks like a correction following recent move down. There have been no confirmed positive signals so far. However, the S&P 500 index may continue to retrace last week's decline, as the resistance level is at around 1,980-2,000, marked by previous local lows, among others. We decided to close our profitable speculative short position (2,077.34, S&P 500 index) on Thursday. It has been closed at the opening of Thursday's cash market trading session (S&P 500 index at around 1,965, following temporary opening price of 1,985.32, S&P 500 futures contract 1,947.90 at 9:30 a.m.). Overall, we gained around 112 index points on that trade. We prefer to be out of the market, avoiding low risk/reward ratio trades. We will let you know when we think it is safe to get back in the market.
Thank you.
Paul Rejczak
Stock Trading Strategist
Stock Trading Alerts

