
Briefly: In our opinion, no speculative positions are justified.
Our intraday outlook is now neutral, and our short-term outlook is neutral:
Intraday outlook (next 24 hours): neutral
Short-term outlook (next 1-2 weeks): neutral
Medium-term outlook (next 1-3 months): bearish
Long-term outlook (next year): bullish
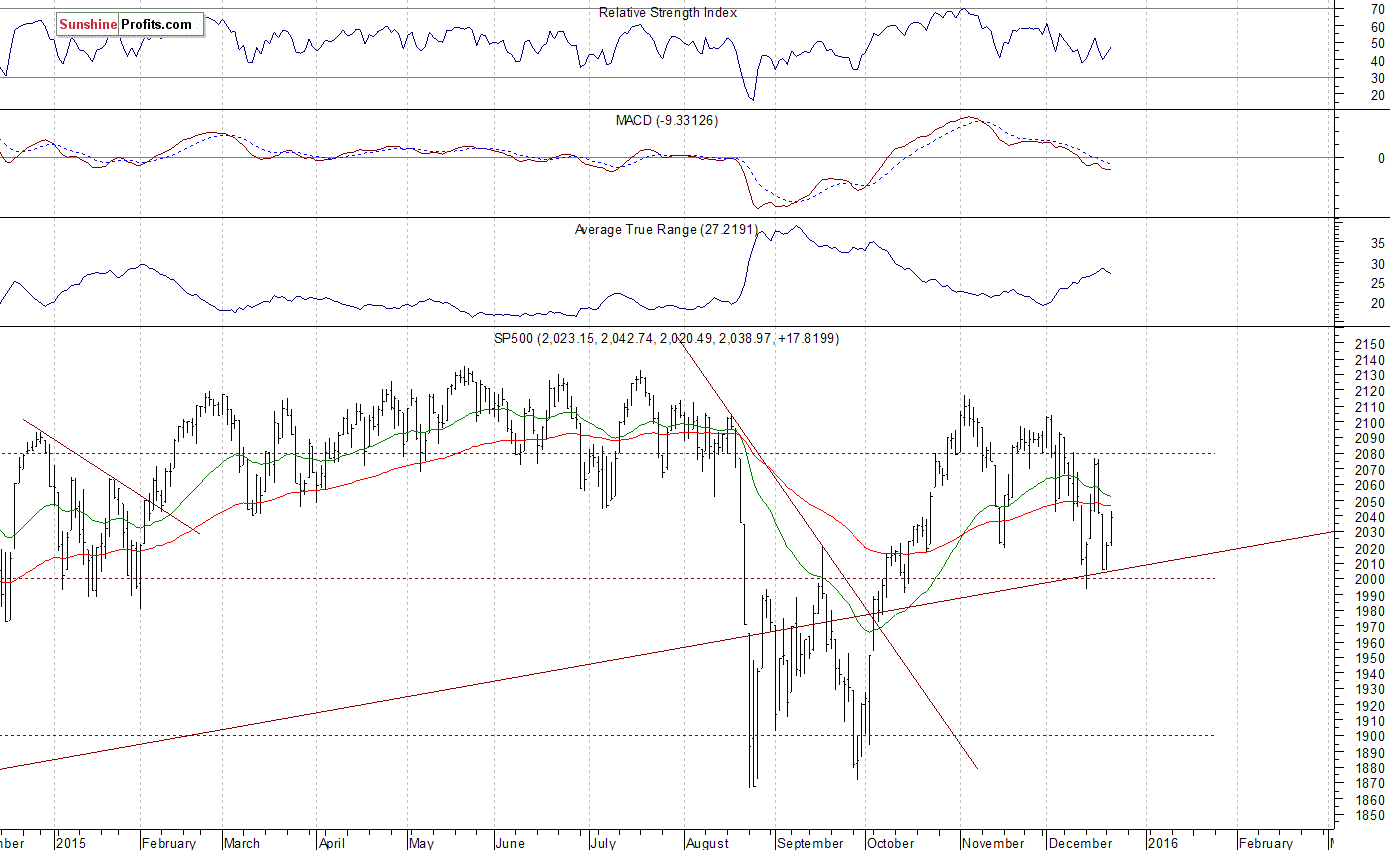
The U.S. stock market indexes gained between 0.6% and 1.0% on Tuesday, extending their short-term move up, as investors reacted to economic data releases, among others. The S&P 500 index bounced off support level of 2,000, as it remained within two-month long consolidation. The nearest important level of resistance is at around 2,040-2,050, marked by previous local lows. On the other hand, support level is at 2,000-2,020. There have been no confirmed negative signals so far. It still looks like a medium-term consolidation following October rally:
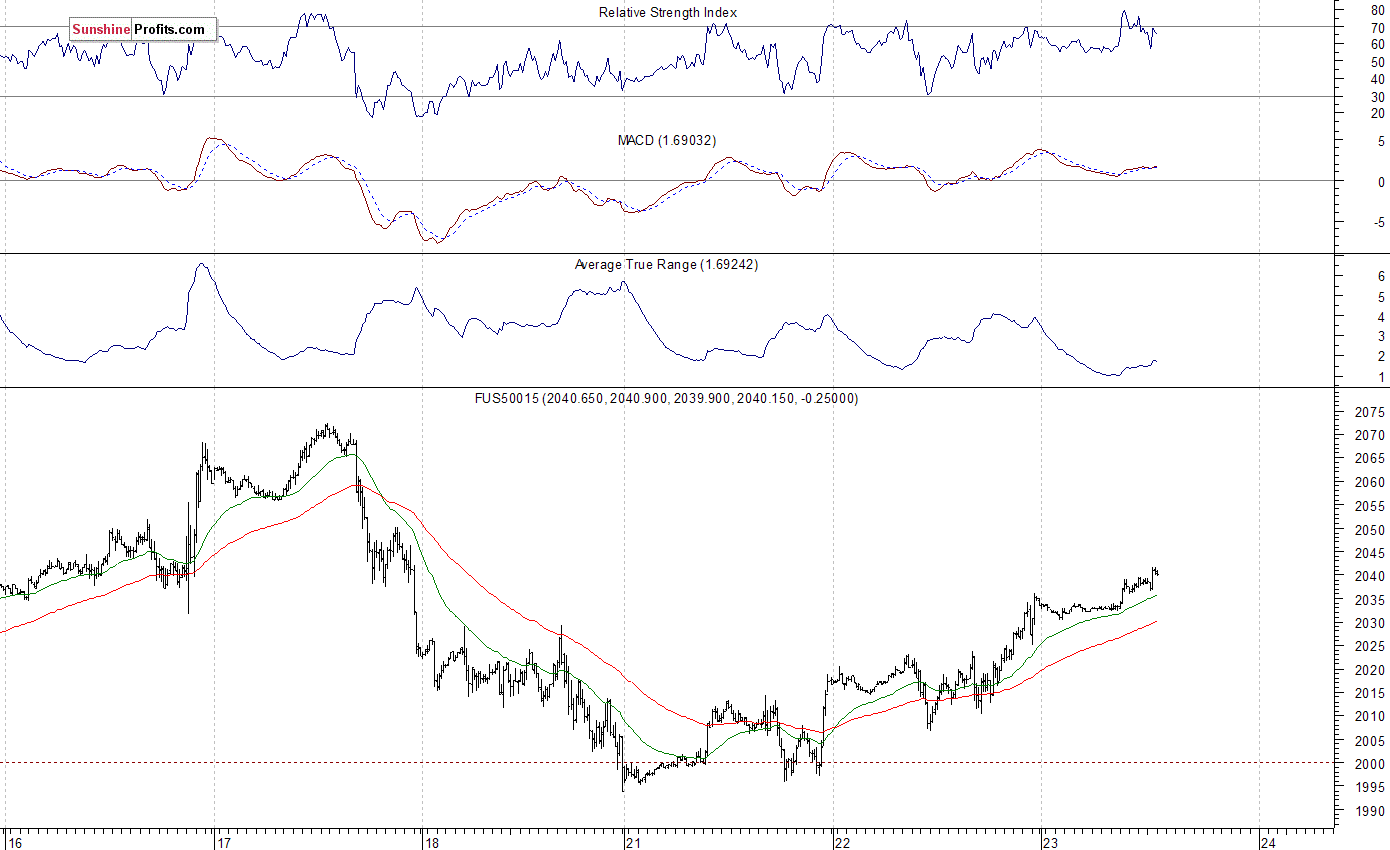
Expectations before the opening of today's trading session are positive, with index futures currently up 0.5-0.6%. The main European stock market indexes have gained 1.5-1.9% so far. Investors will now wait for series of economic data announcements: Durable Orders, PCE Prices Core number, Personal Income, Personal Spending at 8:30 a.m., Michigan Sentiment, New Home Sales at 10:00 a.m., Crude Inventories at 10:30 a.m. The S&P 500 futures contract trades within an intraday uptrend, as it continues to retrace last week's move down. The nearest important level of resistance is at around 2,040-2,050. On the other hand, support level is at 2,020, among others, as the 15-minute chart shows:
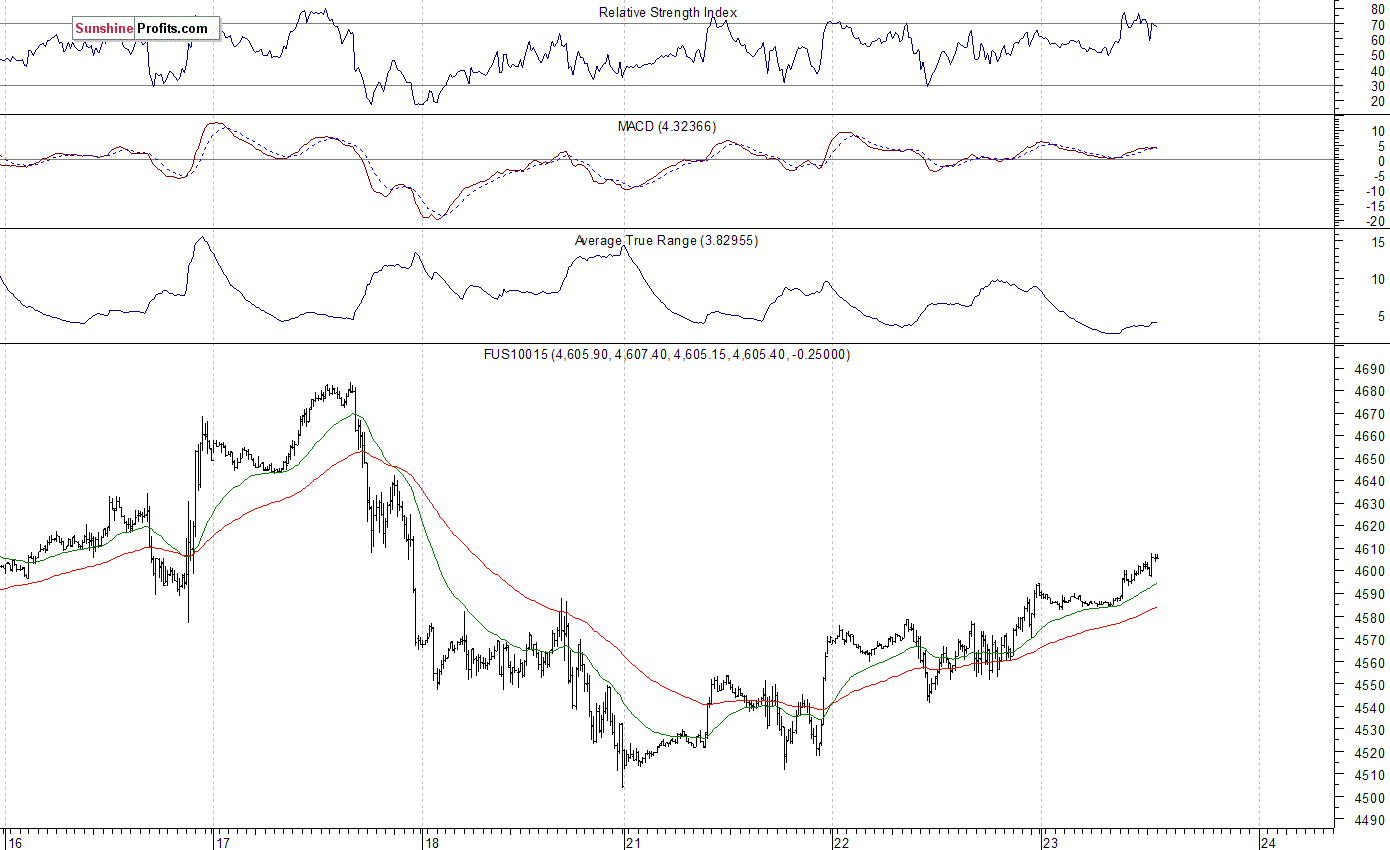
The technology Nasdaq 100 futures contract (CFD) follows a similar path, as it extends its recent move up. The nearest important level of resistance is at around 4,630-4,650, and support level remains at 4,580, among others, as we can see on the 15-minute chart:
Concluding, the broad stock market continued to retrace its last week's decline on Tuesday, as investors reacted to some economic data announcements. The S&P 500 index extends its two-month long consolidation following October rally. We prefer to be out of the market, avoiding low risk/reward ratio trades. We will let you know when we think it is safe to get back in the market.
Thank you.
Paul Rejczak
Stock Trading Strategist
Stock Trading Alerts

