
Briefly: In our opinion, no speculative positions are justified.
Our intraday outlook is neutral, and our short-term outlook is neutral. Our medium-term outlook remains bearish, as the S&P 500 index extends its lower highs, lower lows sequence. We decided to change our long-term outlook to neutral recently, following a move down below medium-term lows:
Intraday outlook (next 24 hours): neutral
Short-term outlook (next 1-2 weeks): neutral
Medium-term outlook (next 1-3 months): bearish
Long-term outlook (next year): neutral
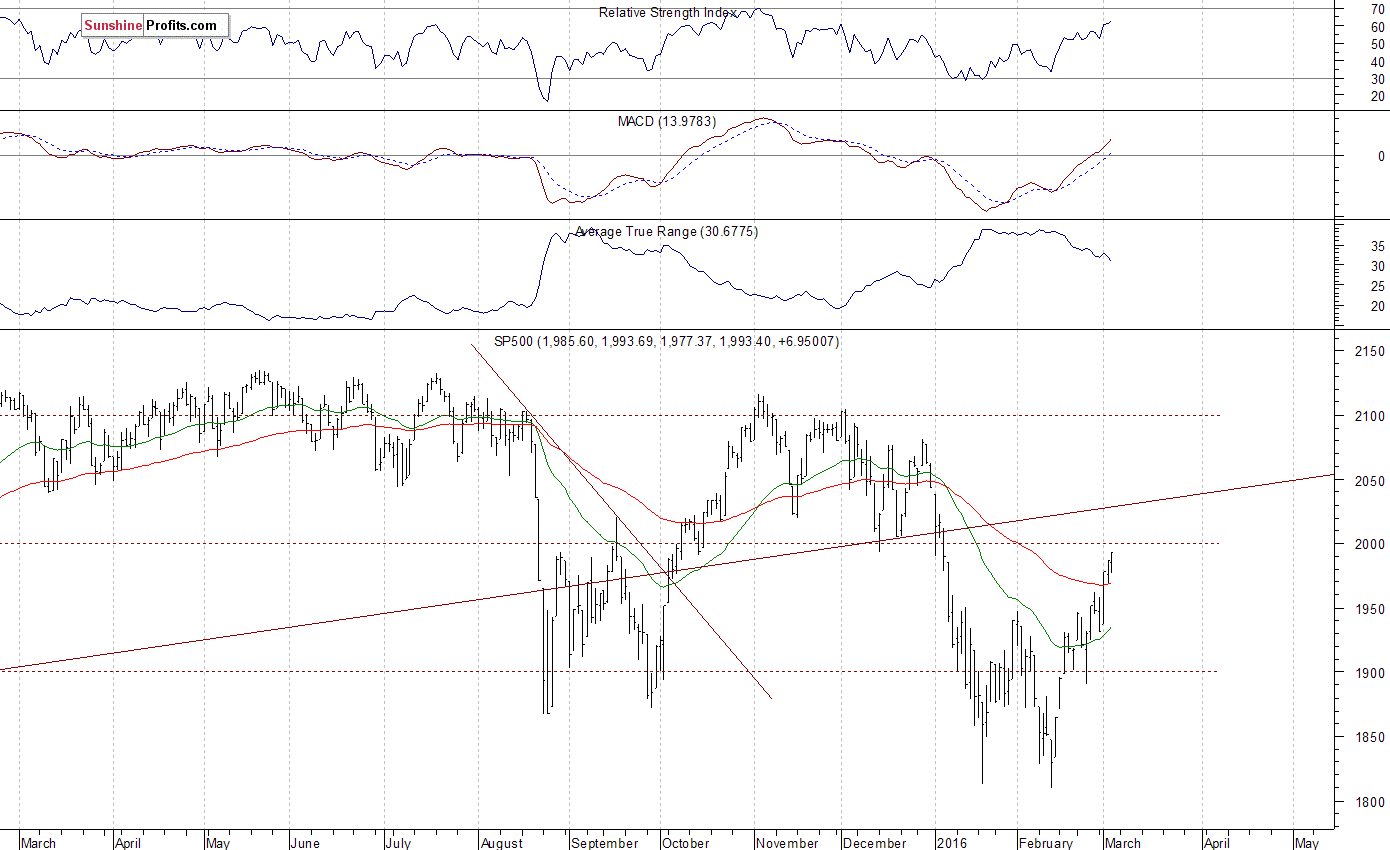
The U.S. stock market indexes were mixed between -0.2% and +0.4% on Thursday, as investors hesitated following recent advance. However, the S&P 500 index extended its rally, as it got closer to the level of 2,000. Will it break above that resistance level? The next important level of resistance is at around 2,040, marked by the January 4th daily gap down of 2,038.20-2,043.62. On the other hand, support level remains at 1,950, marked by previous resistance level. There have been no confirmed negative signals so far. However, we can see some short-term overbought conditions. Last year's August - September lows continue to act as medium-term support level, as we can see on the daily chart:
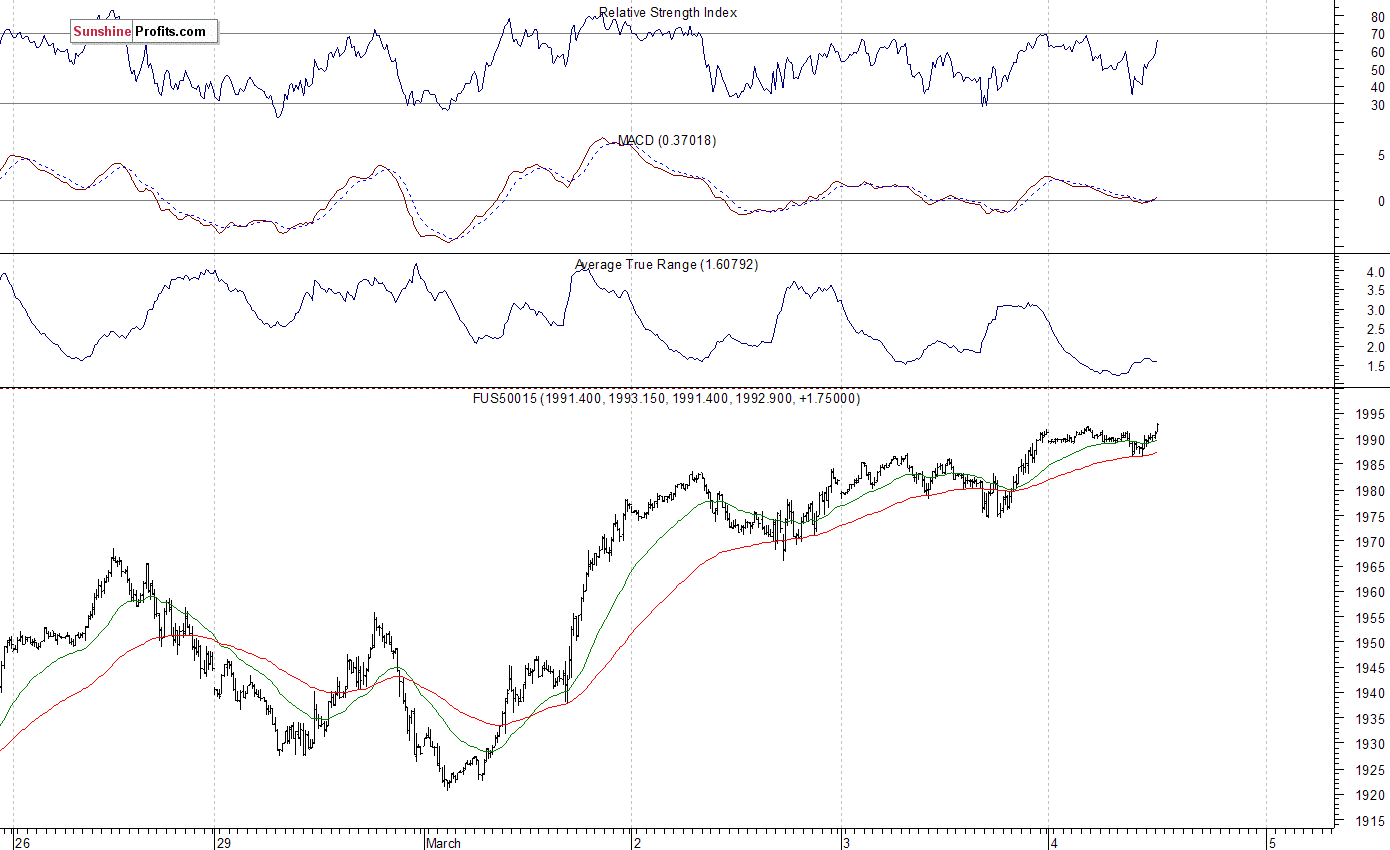
Expectations before the opening of today's trading session are virtually flat, with index futures currently up 0.1%. The European stock market indexes have gained 0.1-0.3% so far. Investors will now wait for some economic data announcements: Nonfarm payrolls, Unemployment Rate, Trade Balance at 8:30 a.m. The S&P 500 futures contract trades within an intraday consolidation. For now, it looks like a flat correction following recent uptrend. The nearest important level of resistance is at around 2,000. On the other hand, support level remains at 1,975-1,980, marked by recent local lows, among others. Will the uptrend extend even further? There have been no confirmed short-term negative signals so far.
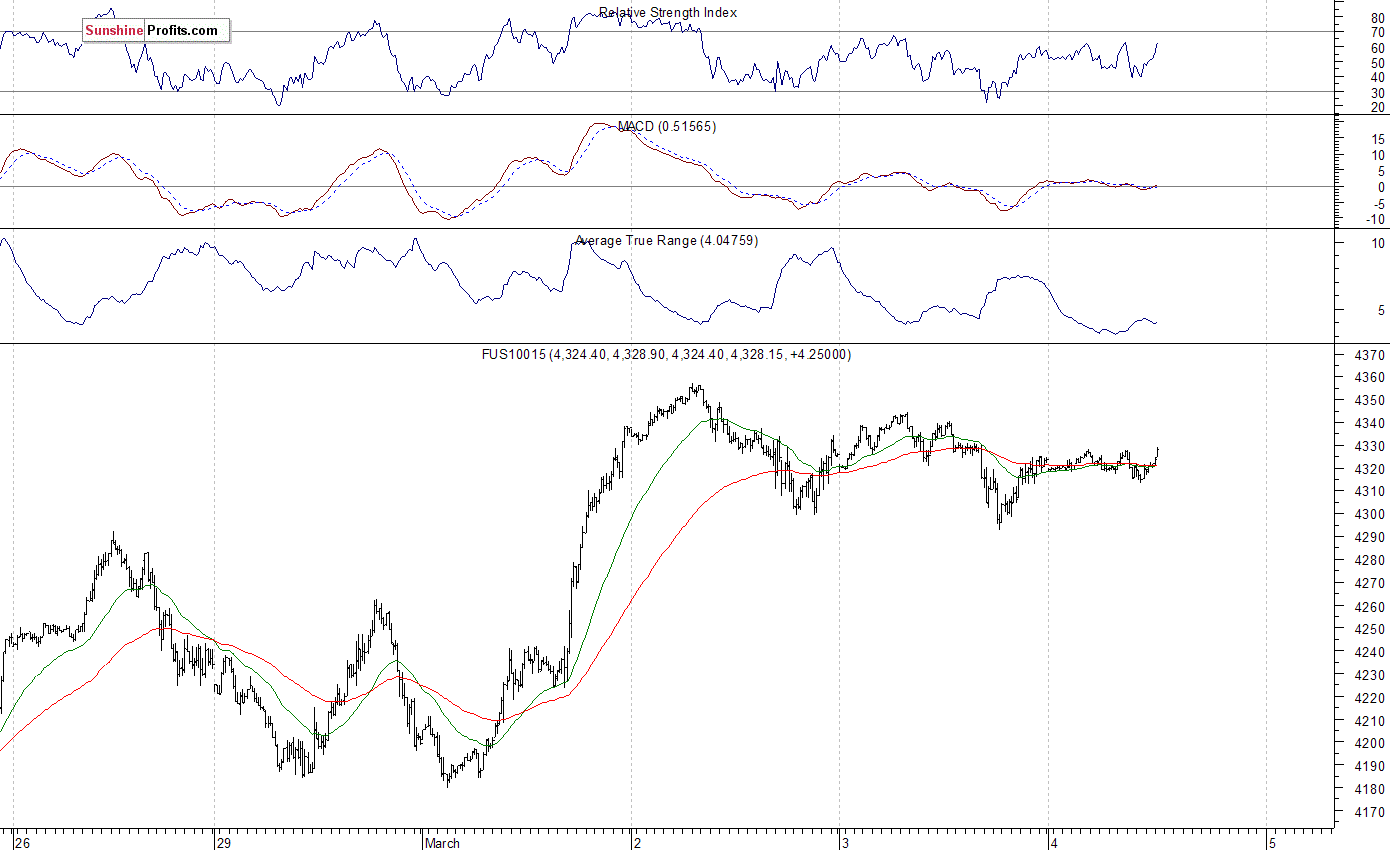
The technology Nasdaq 100 futures contract follows a similar path, as it fluctuates after recent rally. The nearest important level of resistance is at around 4,350, marked by local high. On the other hand, support level is at 4,300, among others. For now, it looks like a flat correction within a short-term uptrend:
Concluding, the broad stock market extended its short-term uptrend yesterday, as investors awaited today's monthly jobs report release, among others. There have been no confirmed short-term negative signals so far. The index continues to trade along last year's August - September local lows, as they act as medium-term level of support. However, it looks like a correction within a medium-term downtrend. We still prefer to be out of the market, avoiding low risk/reward ratio trades. We will let you know when we think it is safe to get back in the market.
Thank you.
Paul Rejczak
Stock Trading Strategist
Stock Trading Alerts

