
Briefly: In our opinion, no speculative positions are justified.
Our intraday outlook is neutral, and our short-term outlook is neutral. Our medium-term outlook remains bearish, as the S&P 500 index extends its lower highs, lower lows sequence:
Intraday outlook (next 24 hours): neutral
Short-term outlook (next 1-2 weeks): neutral
Medium-term outlook (next 1-3 months): bearish
Long-term outlook (next year): neutral
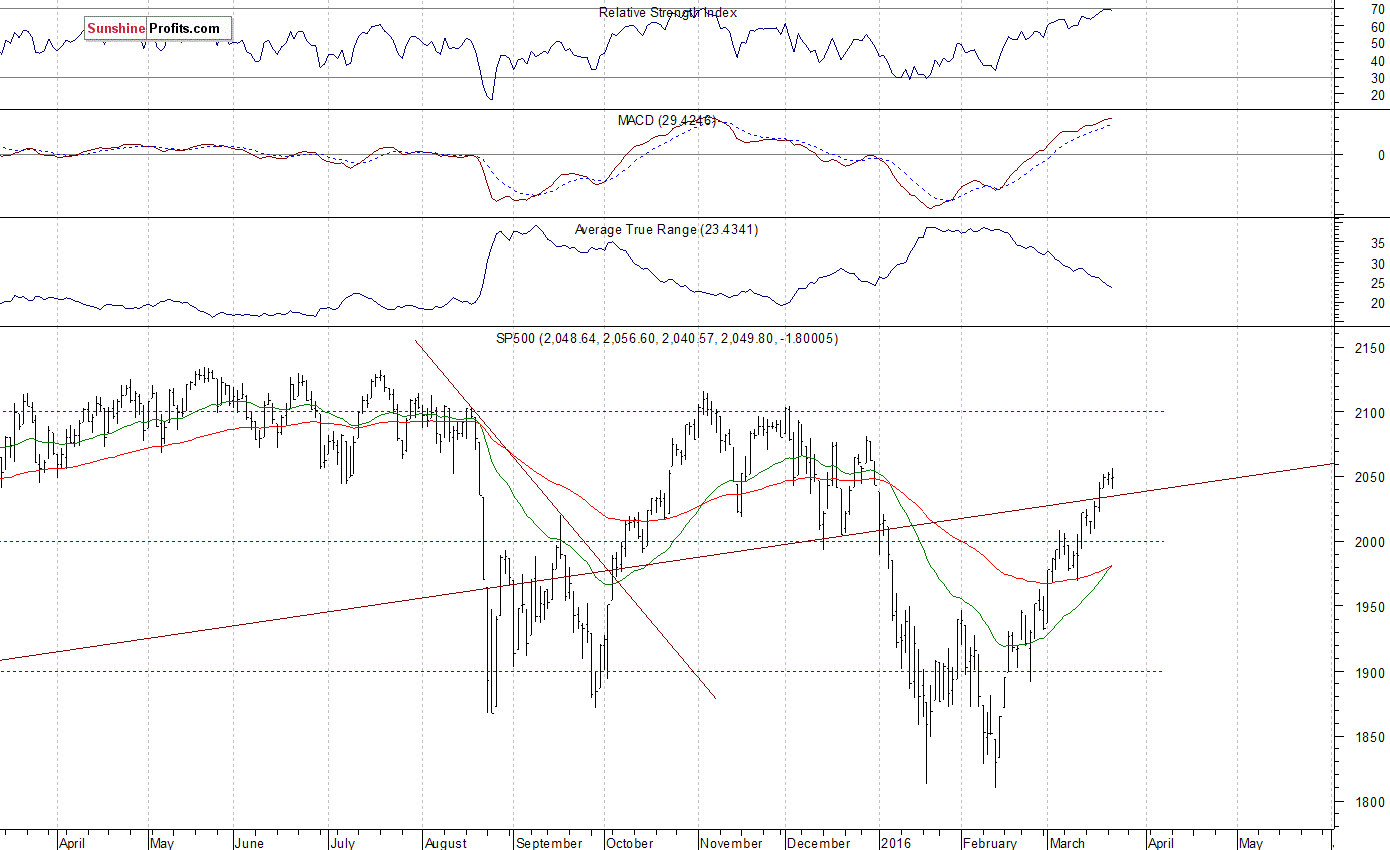
The U.S. stock market indexes were mixed between -0.2% and +0.2% on Tuesday, extending their short-term fluctuations, as investors took profits off the table following last week's rally. The S&P 500 index continues to trade close to the level of 2,050, after breaking above the level of resistance of 2,040, marked by the early January daily gap down at 2,038.20-2,043.62. The next important level of resistance is at around 2,080, marked by the late December local high of 2,081.56. On the other hand, support level remains at 2,000, and the next support level is at 1,960-1,980, marked by previous level of resistance. There have been no confirmed negative signals so far. However, we can see some technical overbought conditions, along with short-term uncertainty. The index continues to trade within a slightly descending medium-term trading channel, as we can see on the daily chart:
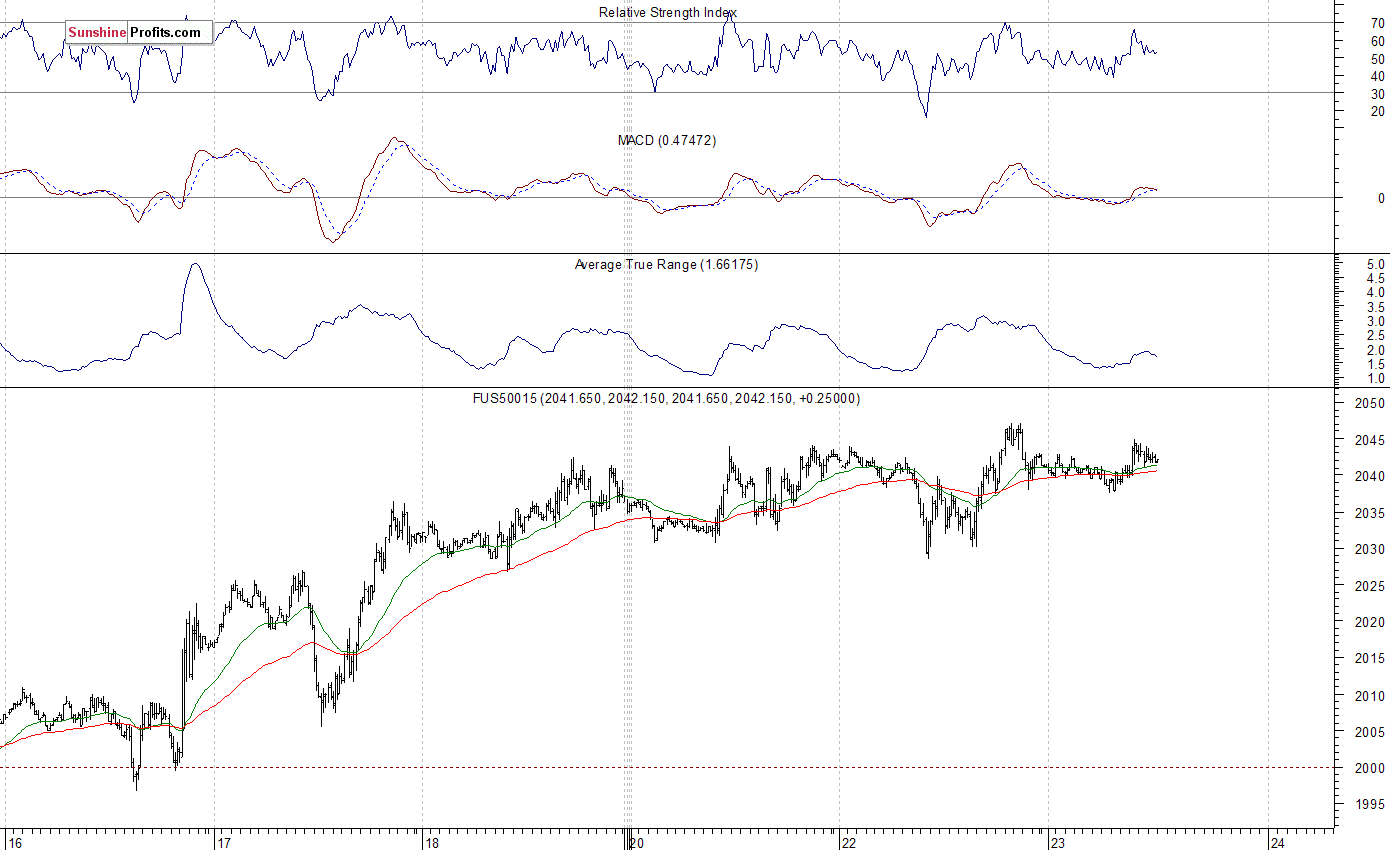
Expectations before the opening of today's trading session are virtually flat. The European stock market indexes have gained 0.2-0.8% so far. Investors will now wait for some economic data announcements: New Home Sales at 10:00 a.m., Crude Inventories at 10:30 a.m. The S&P 500 futures contract trades within an intraday consolidation, as it fluctuates following its recent advance. The nearest important level of resistance is at around 2,050, marked by local highs. On the other hand, support level remains at 2,020-2,030, among others. There have been no confirmed negative signals so far. For now, it looks like a flat correction following recent uptrend:
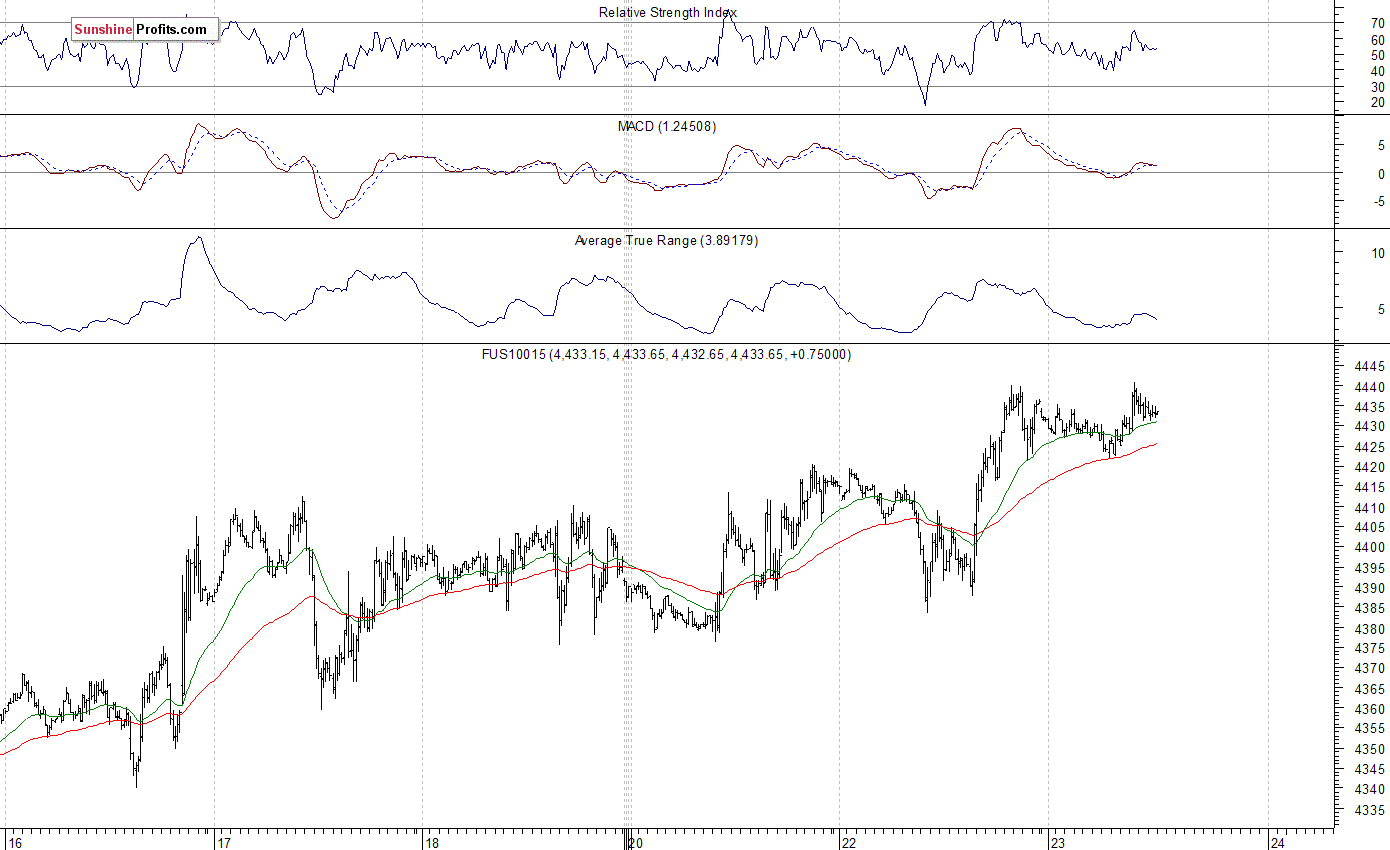
The technology Nasdaq 100 futures contract trades within a similar intraday consolidation, following recent move up. Will it continue higher despite some short-term overbought conditions? The nearest important level of resistance is at around 4,440-4,450, and support level remains at 4,400, marked by previous level of resistance, as the 15-minute chart shows:
Concluding, the broad stock market extends its short-term uncertainty following last week's rally. For now, it looks like a flat correction within an uptrend. The S&P 500 index has retraced most of its January sell-off. Will it continue higher despite some technical overbought conditions? Our speculative position has been closed on Friday, at the stop-loss level of 2,050 (S&P 500 index). We lost 55 index points on that trade, betting against month-long uptrend. It is always important to set some exit price level in case some events cause the price to move in the unlikely direction. Having safety measures in place helps limit potential losses while letting the gains grow. Currently, we prefer to be out of the market, avoiding low risk/reward ratio trades. We will let you know when we think it is safe to get back in the market.
Thank you.
Paul Rejczak
Stock Trading Strategist
Stock Trading Alerts

