

Briefly: In our opinion, no speculative positions are justified.
Our intraday outlook is now neutral, and our short-term outlook is neutral. Our medium-term outlook remains bearish, as the S&P 500 index extends its lower highs, lower lows sequence:
Intraday outlook (next 24 hours): neutral
Short-term outlook (next 1-2 weeks): neutral
Medium-term outlook (next 1-3 months): bearish
Long-term outlook (next year): neutral
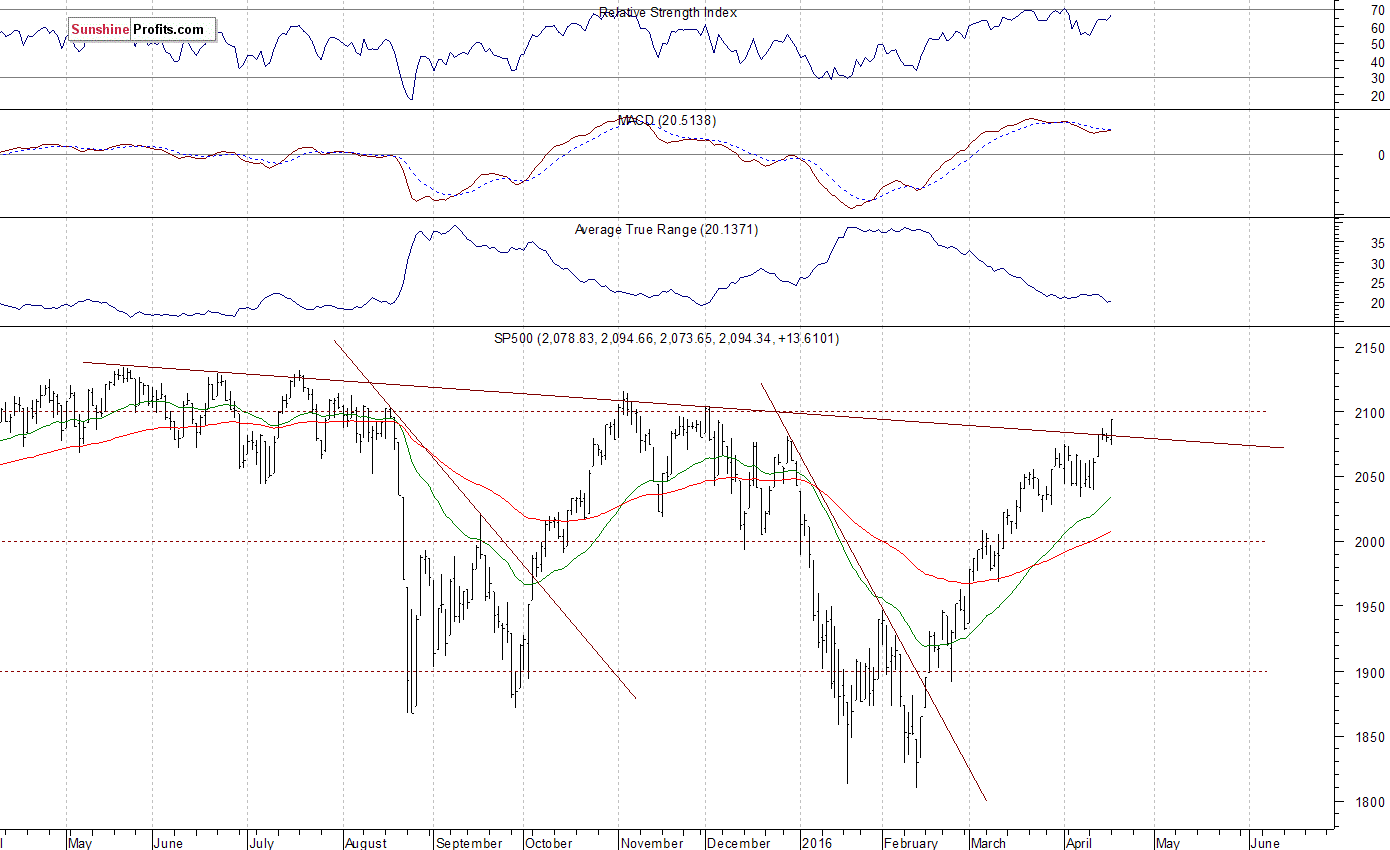
The main U.S. stock market indexes gained 0.6-0.7% on Monday, extending their short-term uptrend, as investors reacted to quarterly corporate earnings releases. The S&P 500 index got closer to its last year's November - December local highs along the level of 2,100. The market broke above its short-term consolidation, following slightly lower opening of Monday's trading session. The nearest important level of resistance is at around 2,100-2,120. On the other hand, support level is at around 2,065-2,070, marked by previous level of resistance. The next important level of support remains at around 2,050. There have been no confirmed negative signals so far. However, we can see some short-term overbought conditions. Will this uptrend accelerate towards last year's all-time high of 2,134.72?
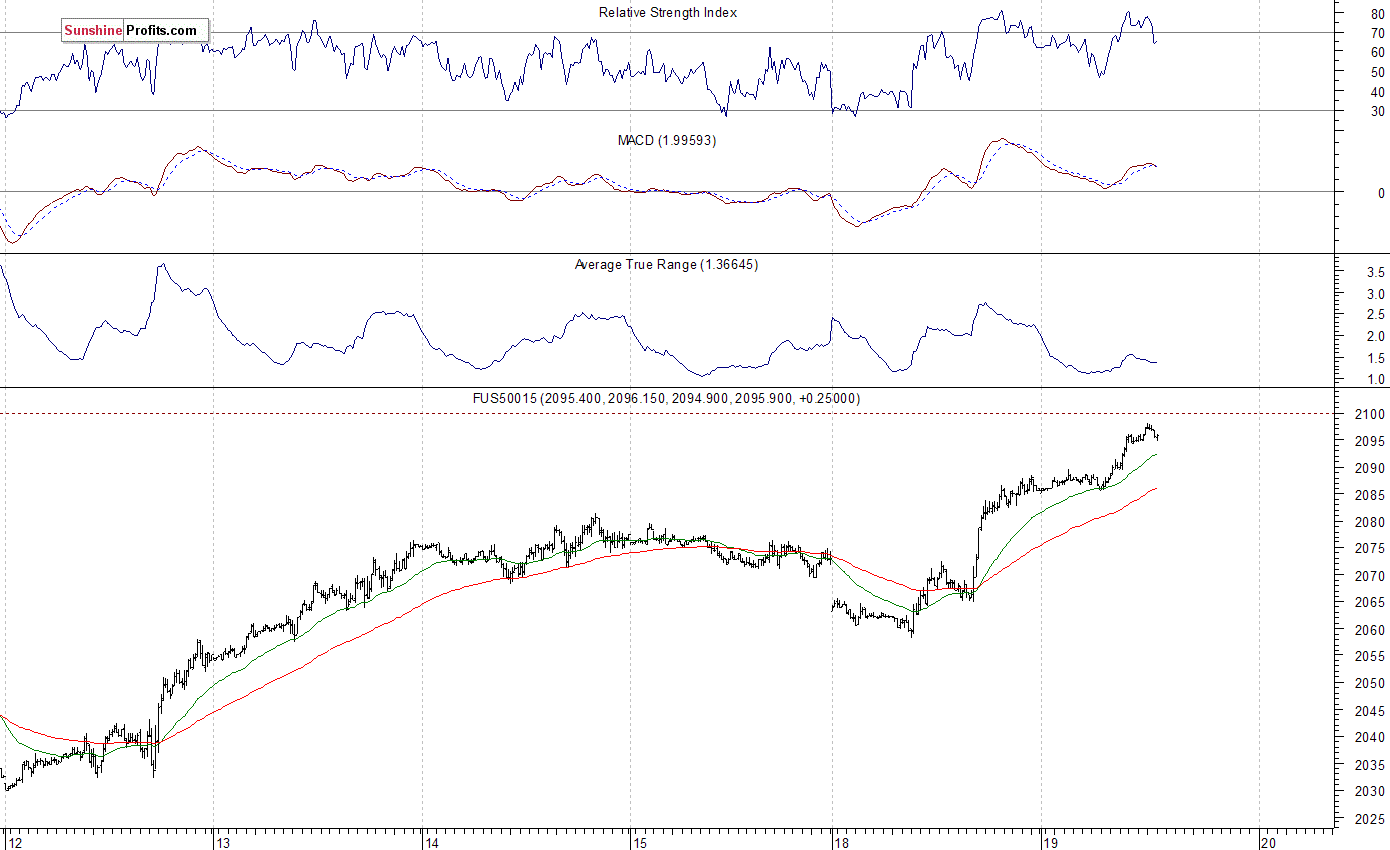
Expectations before the opening of today's trading session are positive, with index futures currently up 0.3-0.7%. The European stock market indexes have gained 0.3-2.2% so far. Investors will now wait for some economic data announcements: Building Permits, Housing Starts at 8:30 a.m. The S&P 500 futures contract trades within an intraday uptrend, as it gets closer to the level of 2,100. The nearest important level of support is at around 2,080-2,085, marked by yesterday's short-term consolidation. On the other hand, resistance level is at 2,095-2,100, as the 15-minute chart shows:
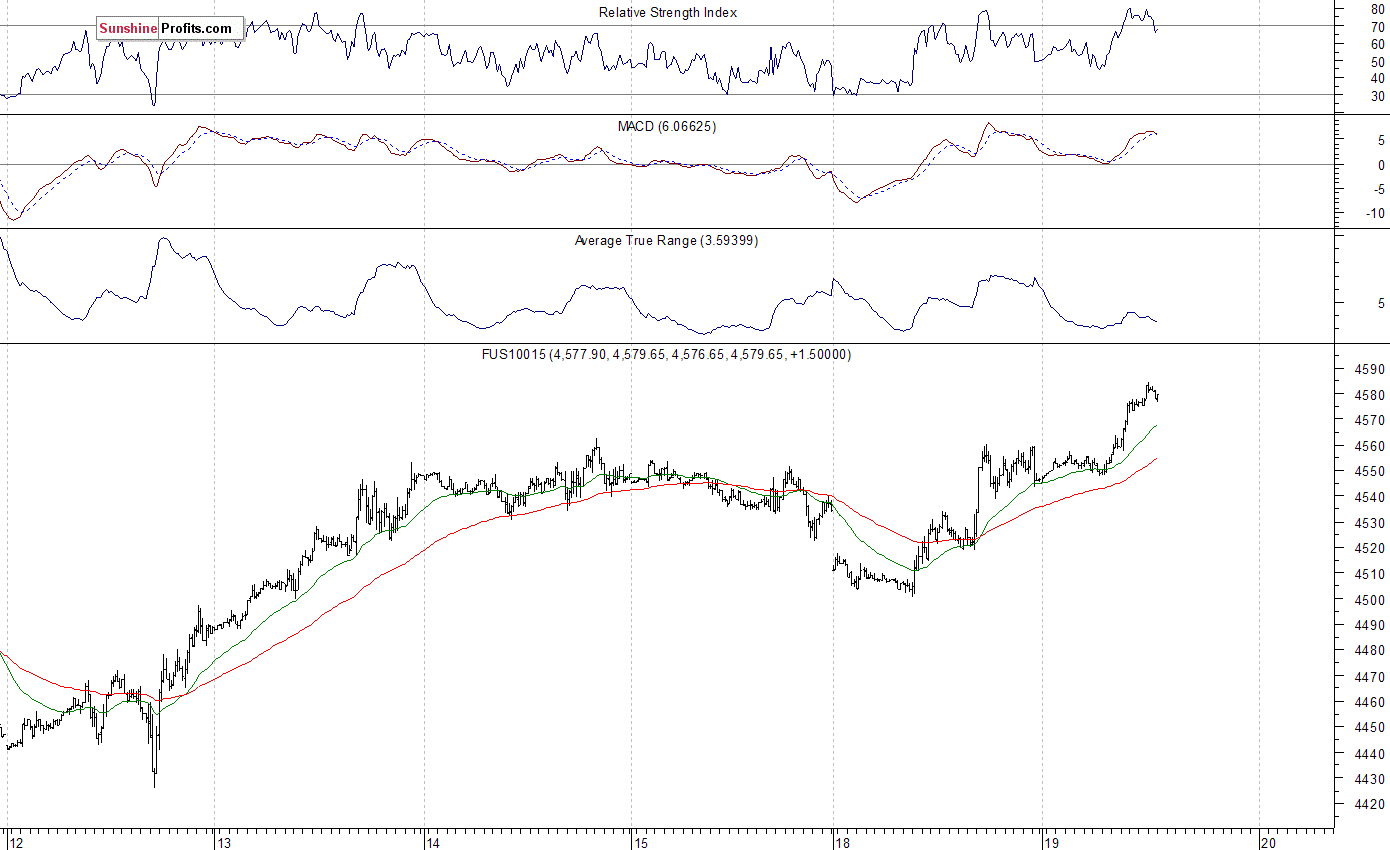
The technology Nasdaq 100 futures contract follows a similar path, as it extends its short-term uptrend. It gets closer to the level of 4,600. The nearest important level of resistance is at around 4,580-4,600. On the other hand, support level is at 4,530-4,550, marked by short-term consolidation, as we can see on the 15-minute chart:
Concluding, the broad stock market continued its short-term uptrend yesterday, following quarterly corporate earnings releases. We still can see technical overbought conditions that may lead to uptrend's reversal or downward correction. However, there have been no confirmed short-term negative signals so far. Our speculative position has been closed at the stop-loss level of 2,100 (S&P 500 index; the S&P 500 futures contract has reached its pre-session high at the level of 2,098 - 10 points above yesterday's daily high). We lost 54.44 index points on that trade, betting against over two-month-long uptrend. It is always important to set some exit price level in case some events cause the price to move in the unlikely direction. Having safety measures in place helps limit potential losses while letting the gains grow. Currently, we prefer to be out of the market, avoiding low risk/reward ratio trades. We will let you know when we think it is safe to get back in the market.
Thank you.
Paul Rejczak
Stock Trading Strategist
Stock Trading Alerts

