

Briefly: In our opinion, speculative short positions are favored (with stop-loss at 2,140, and profit target at 2,100, S&P 500 index).
Our intraday outlook is now bearish, and our short-term outlook is bearish. Our medium-term outlook remains bearish, as the S&P 500 index extends its lower highs, lower lows sequence:
Intraday outlook (next 24 hours): bearish
Short-term outlook (next 1-2 weeks): bearish
Medium-term outlook (next 1-3 months): bearish
Long-term outlook (next year): neutral
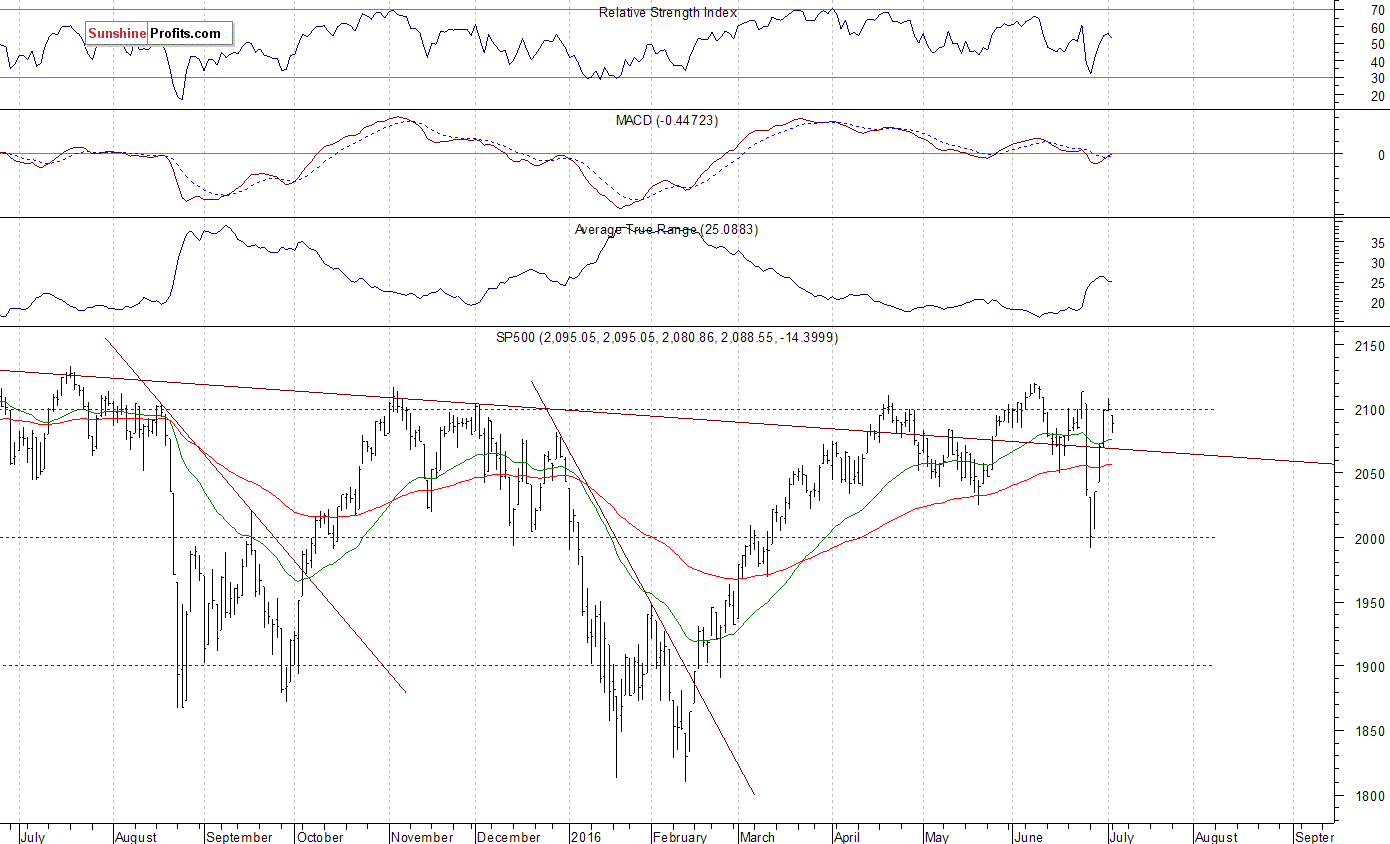
The U.S. stock market indexes lost 0.6-0.7% on Monday, retracing some of their last week's advance, as investors reacted to economic data releases, among others. The S&P 500 index got back below the level of 2,100, following daily gap down of 2,095.05-2,097.90. The nearest important level of resistance is at around 2,095-2,100, and the next resistance level remains at 2,110-2,120, marked by last month's local highs. On the other hand, support level is at around 2,080-2,085, marked by previous level of resistance, and the next level of support is at 2,050-2,070. Last year's highs along the level of 2,100 continue to act as medium-term resistance level. Is this some long-term topping pattern or just medium-term consolidation following a rebound off February low?
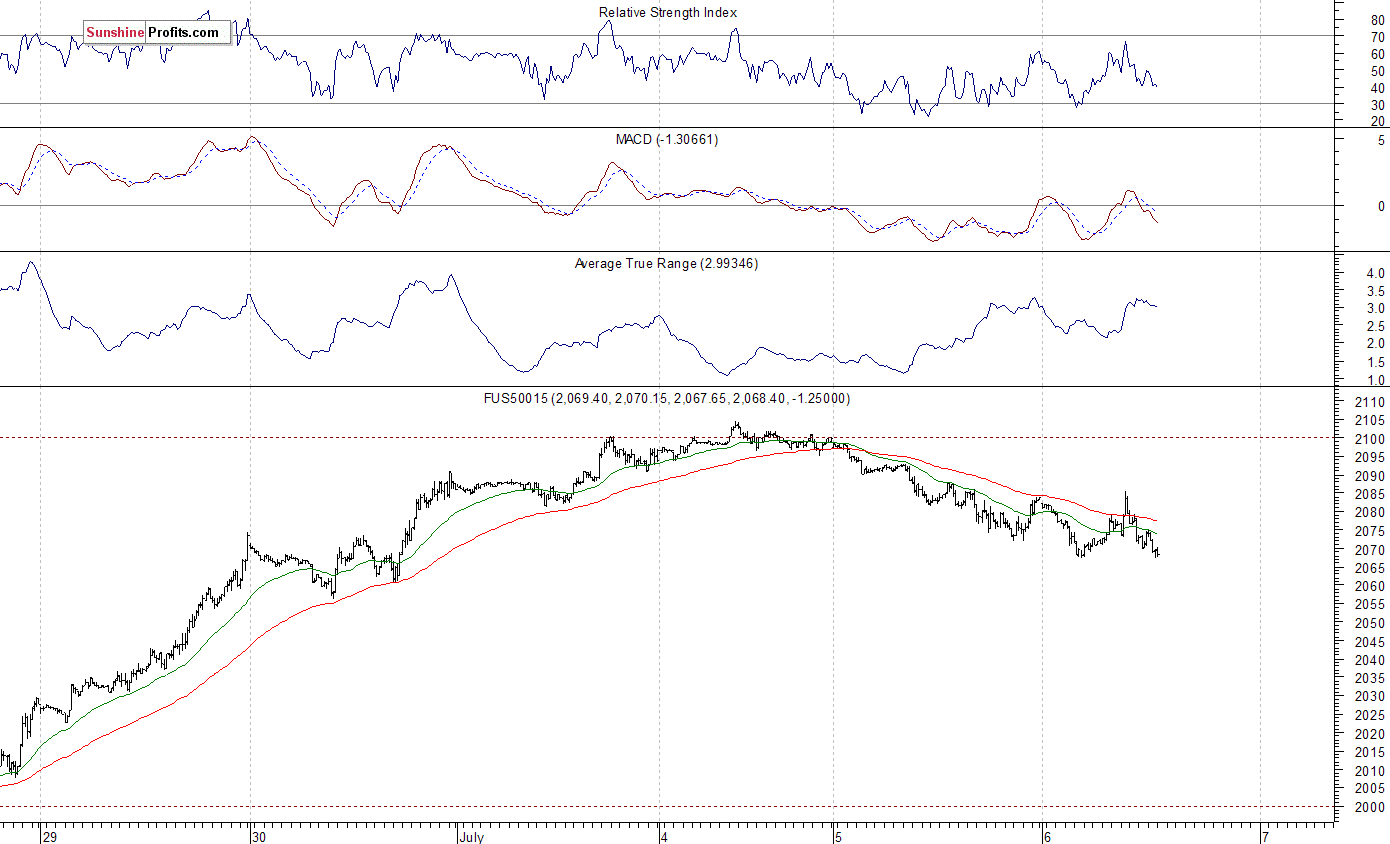
Expectations before the opening of today's trading session are negative, with index futures currently down 0.6-0.8%. The European stock market indexes have lost 1.5-2.3% so far. Investors will now wait for some economic data announcements: Trade Balance number at 8:30 a.m., ISM Services at 10:00 a.m., Crude Inventories at 10:30 a.m., FOMC Minutes release at 2:00 p.m. The S&P 500 futures contract trades within an intraday downtrend, as it extends its yesterday's move down. The nearest important level of support is at around 2,065, marked by local lows. On the other hand, resistance level is at 2,080-2,085, among others, as we can see on the 15-minute chart:
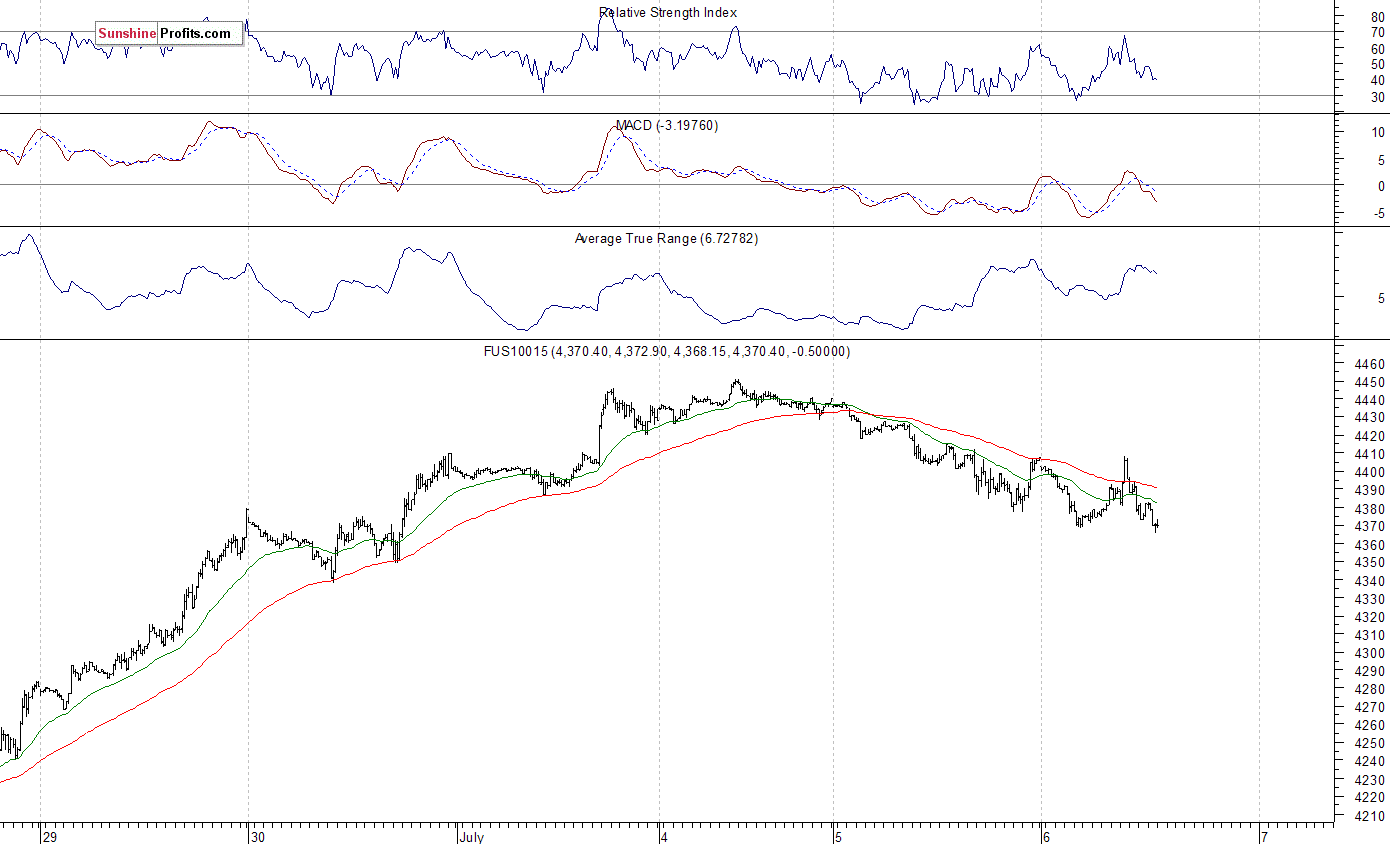
The technology Nasdaq 100 futures contract follows a similar path, as it extends its yesterday's decline. The nearest important level of support is at around 4,350-4,370. On the other hand, resistance level is at 4,400, marked by previous level of support, as the 15-minute chart shows:
Concluding, the broad stock market retraced some of its last week's move up yesterday, as the S&P 500 index broke below 2,100 mark again. We can see short-term overbought conditions accompanied by bearish technical divergences. Therefore, we continue to maintain our speculative short position (opened at around 2,092 - yesterday's average opening price of the S&P 500 index). Stop-loss level is at 2,140 and potential profit target is at 2,000 (S&P 500 index). You can trade S&P 500 index using futures contracts (S&P 500 futures contract - SP, E-mini S&P 500 futures contract - ES) or an ETF like the SPDR S&P 500 ETF - SPY. It is always important to set some exit price level in case some events cause the price to move in the unlikely direction. Having safety measures in place helps limit potential losses while letting the gains grow.
Thank you.
Paul Rejczak
Stock Trading Strategist
Stock Trading Alerts

