
Briefly: In our opinion, no speculative positions are justified.
Our intraday outlook is neutral, and our short-term outlook is neutral. Our medium-term outlook remains neutral, following S&P 500 index breakout above last year's all-time high:
Intraday outlook (next 24 hours): neutral
Short-term outlook (next 1-2 weeks): neutral
Medium-term outlook (next 1-3 months): neutral
Long-term outlook (next year): neutral
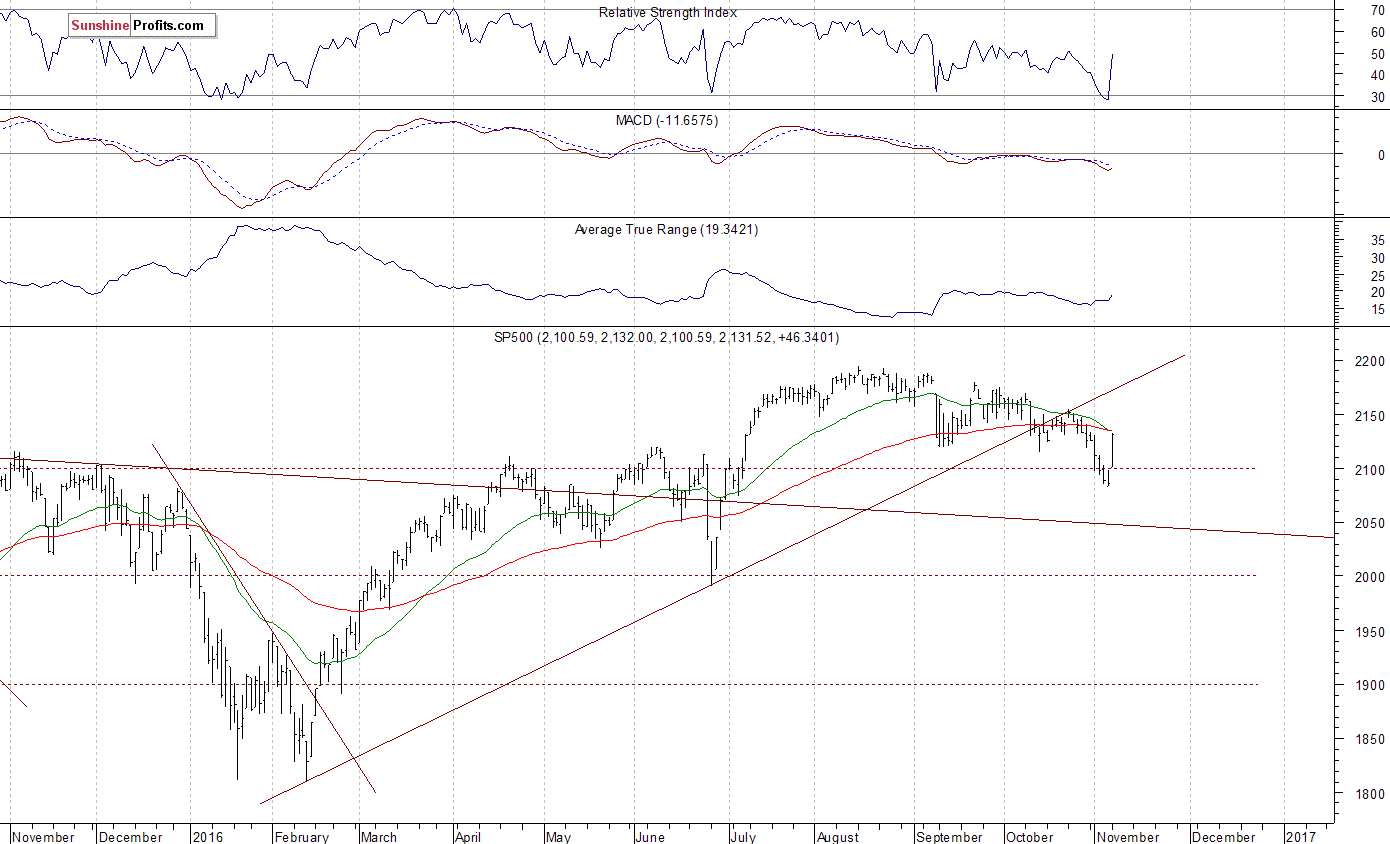
The main U.S. stock market indexes gained 2.1-2.4% on Monday, retracing most of their recent decline, as investors reacted to the U.S. presidential elections news, among others. The S&P 500 index broke above 2,100 and continued towards resistance level of 2,150-2,160. The next important level of resistance is at 2,180-2,200, marked by record high. On the other hand, support level is at 2,100-2,120, marked by previous resistance level. The next important level of support remains at around 2,080, marked by recent local lows, as we can see on the daily chart:
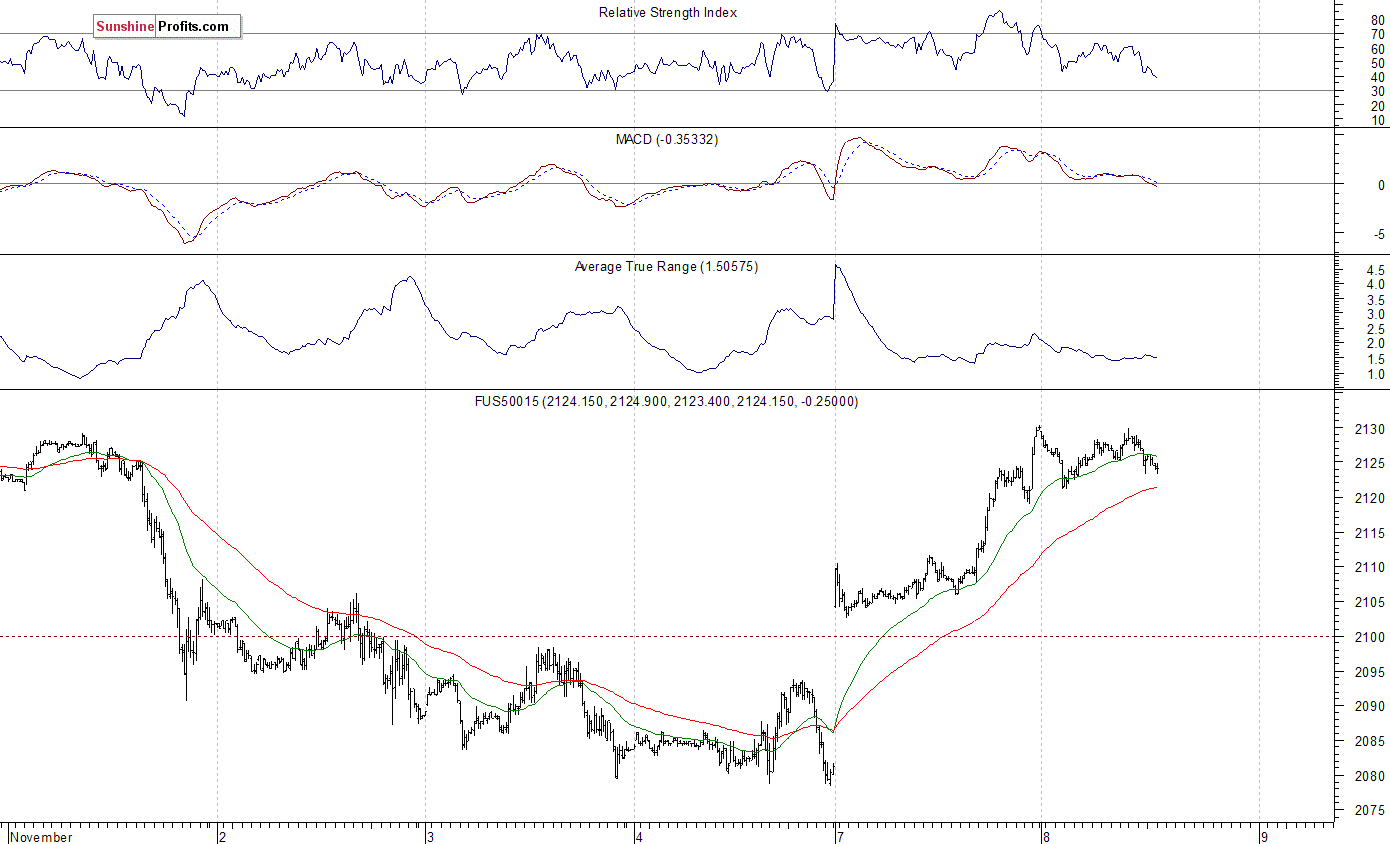
Expectations before the opening of today's trading session are slightly negative, with index futures currently down 0.1-0.2%. The European stock market indexes have been mixed so far. The S&P 500 futures contract trades within an intraday consolidation following yesterday's rally. The nearest important level of resistance is at around 2,130-2,150, marked by some previous local highs. On the other hand, support level remains at 2,100-2,110, marked by yesterday's intraday consolidation, among others. There have been no confirmed short-term negative signals so far:
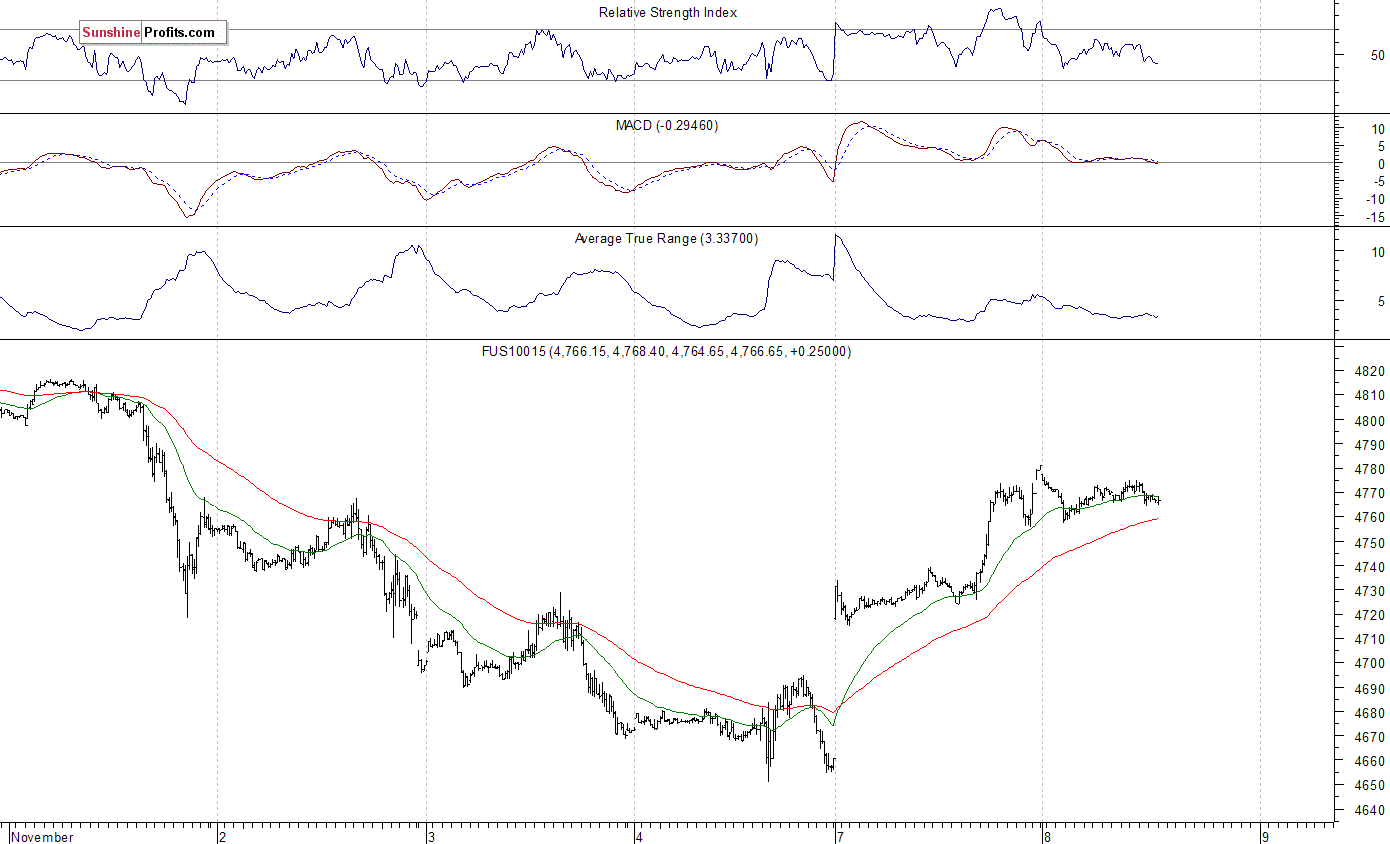
The technology Nasdaq 100 futures follows a similar path, as it currently trades within an intraday consolidation following Monday's rally. The nearest important level of support is at around 4,720-4,740, marked by short-term consolidation. On the other hand, resistance level is at 4,780-4,800, marked by previous level of support. For now, it looks like a relatively flat correction within a short-term uptrend, as the 15-minute chart shows:
Concluding, the broad stock market rallied on Monday, following some U.S. presidential elections news releases. The S&P 500 index has retraced most of its recent decline. Is this a new uptrend or just quick upward correction? We decided to close our profitable short position (opened on July 18 at 2,162 - S&P 500 index) at the opening of Friday's trading session - the average opening price of the S&P 500 index was at 2,085. Overall, we gained 77 index points on that over three-month-long speculative short trade following June - July rally off "Brexit" low. Currently, we prefer to be out of the market, avoiding low risk/reward ratio trades. We will let you know when we think it is safe to get back in the market.
Thank you.
Paul Rejczak
Stock Trading Strategist
Stock Trading Alerts

