
Briefly: In our opinion, no speculative positions are justified.
Our intraday outlook is neutral, and our short-term outlook is neutral. Our medium-term outlook remains bearish, as the S&P 500 index extends its lower highs, lower lows sequence. However, we decided to change our long-term outlook to neutral recently, following recent move down below medium-term lows:
Intraday outlook (next 24 hours): neutral
Short-term outlook (next 1-2 weeks): neutral
Medium-term outlook (next 1-3 months): bearish
Long-term outlook (next year): neutral
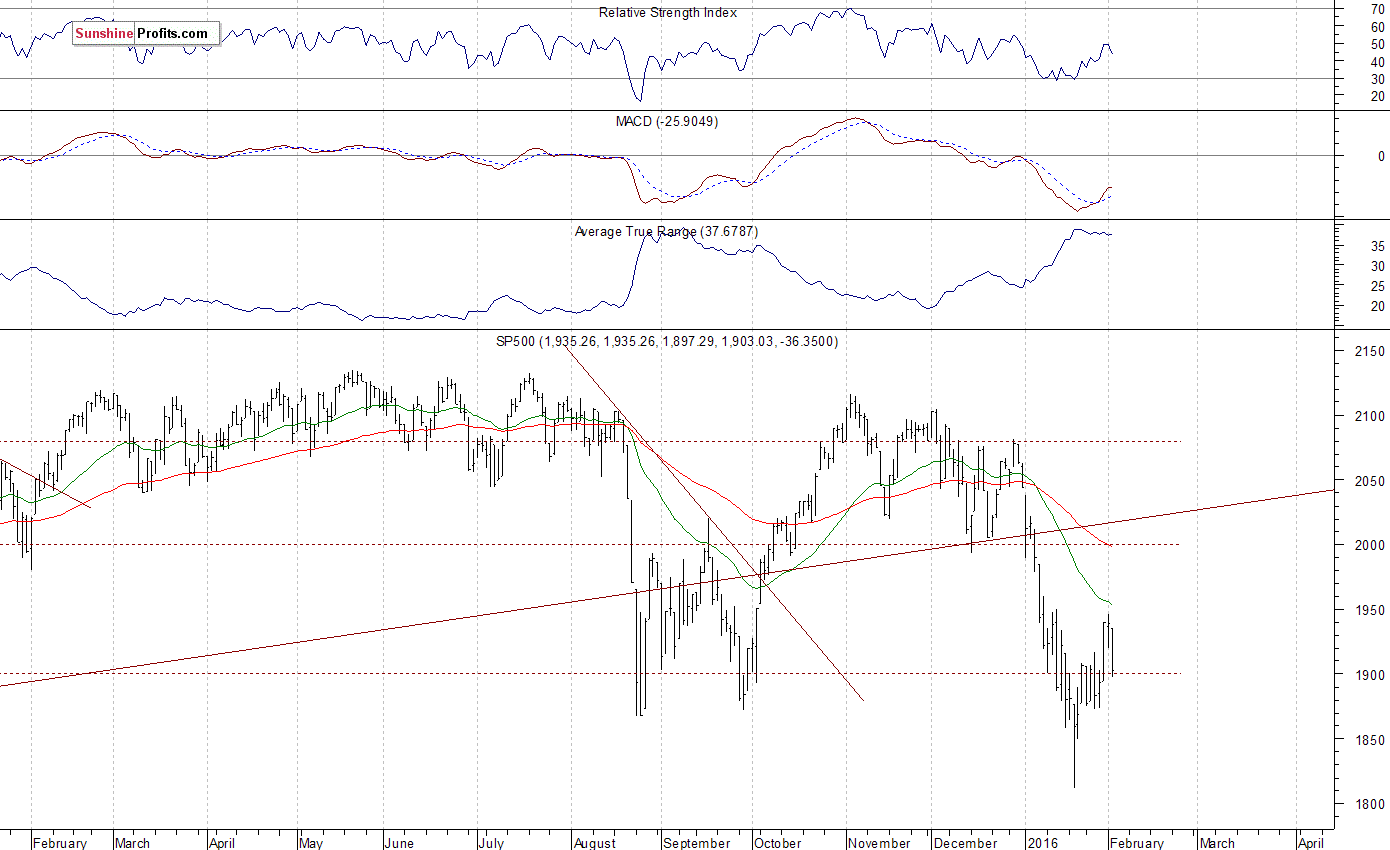
The U.S. stock market indexes lost 1.8-2.2% on Tuesday, retracing their Friday's rally, as investors reacted to oil prices sell-off, quarterly corporate earnings releases, among others. The S&P 500 index got close to the level of 1,900 again. The nearest important level of support is at around 1,900, and the next important support level is at 1,870, marked by previous consolidation. On the other hand, level of resistance is at 1,950, marked by Monday's local high, among others. The market continues to fluctuate following first half of January sell-off. There have been no confirmed positive signals so far. Last year's August - September lows continue to act as a medium-term support level, as we can see on the daily chart:
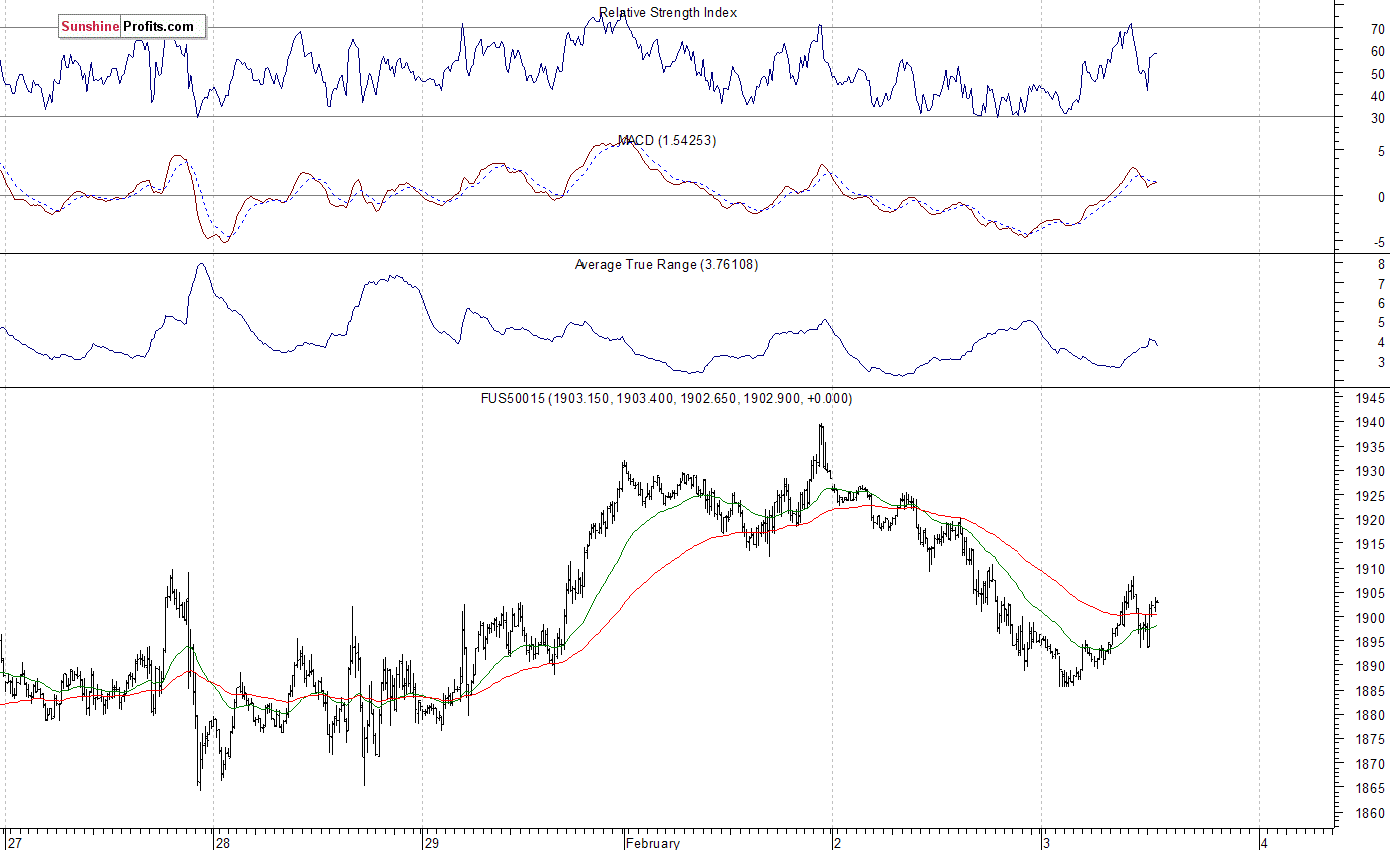
Expectations before the opening of today's trading session are slightly positive, with index futures currently up 0.2-0.3%. The main European stock market indexes have lost 0.1-0.8% so far. Investors will now wait for some economic data announcements: ADP Employment Change at 8:15 a.m., ISM Services at 10:00 a.m., Crude Inventories at 10:30 a.m. The ADP Employment Change indicator is considered as a regular predecessor to Friday's important official monthly unemployment data announcement. The S&P 500 futures contract trades within an intraday consolidation, as it retraces some of its yesterday's decline. The nearest important level of resistance is at around 1,900-1,910, marked by previous support level. On the other hand, support level is at 1,885, marked by yesterday's local low. The market extends its short-term consolidation following last month's decline:
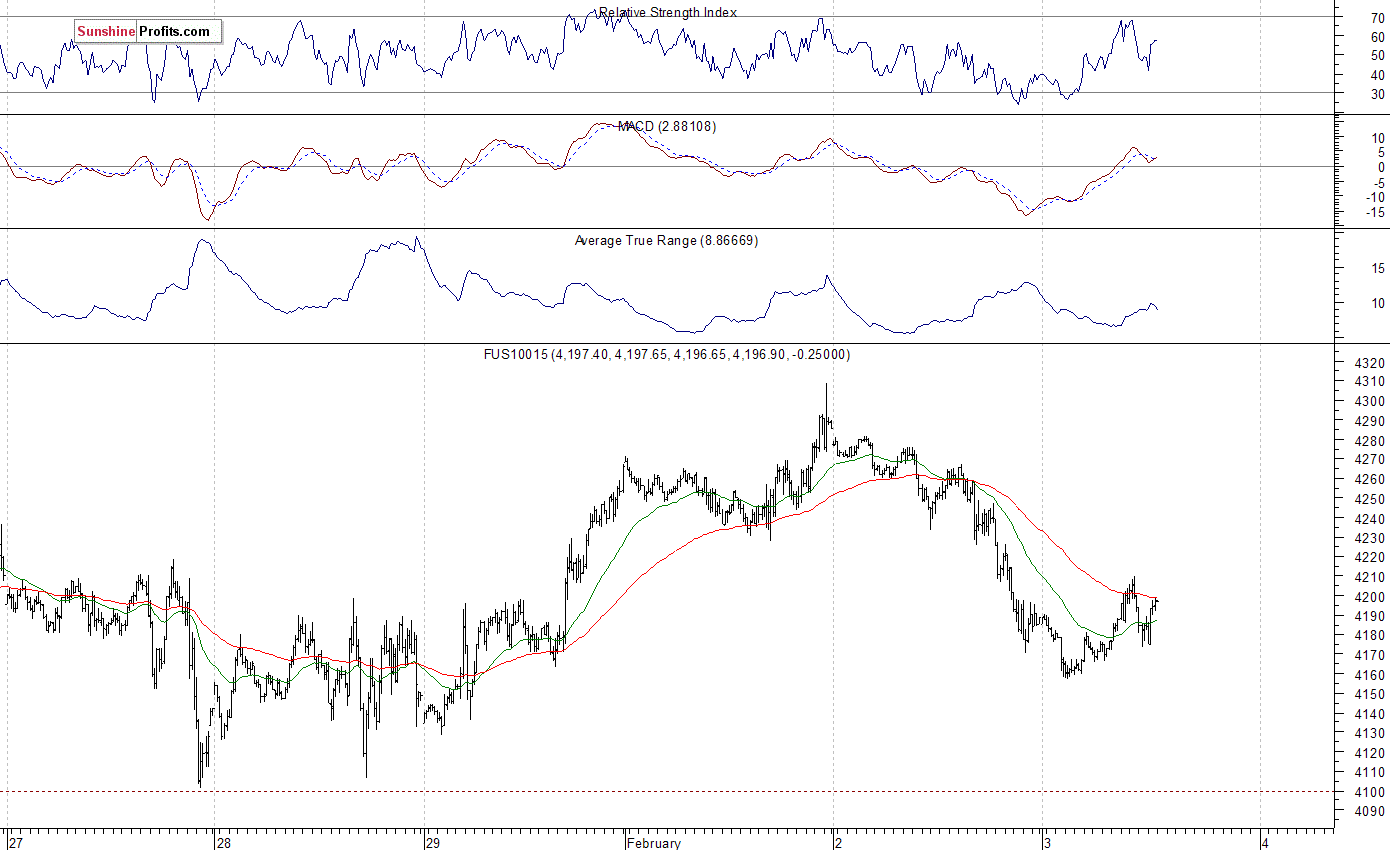
The technology Nasdaq 100 futures contract follows a similar path, as it retraces a part of its yesterday's move down. The nearest important level of support is at around 4,150. On the other hand, resistance level is at 4,230, among others. There is no clear short-term direction, as technology stocks react to mixed quarterly earnings releases. Is this a bottoming pattern or just correction within a downtrend?
Concluding, the broad stock market retraced its Friday's rally yesterday, as investors reacted to oil prices sell-off, among others. The S&P 500 index is back again at 1,900 mark. Will it continue its January's move down, or is this a bottoming consolidation before some more meaningful downtrend's reversal? For now, the index continues to trade along its last year's August - September local lows, as they act as a medium-term level of support. We still prefer to be out of the market, avoiding low risk/reward ratio trades. We will let you know when we think it is safe to get back in the market.
Thank you.
Paul Rejczak
Stock Trading Strategist
Stock Trading Alerts

