
Briefly: In our opinion, no speculative positions are justified.
Our intraday outlook is now neutral, and our short-term outlook is neutral:
Intraday outlook (next 24 hours): neutral
Short-term outlook (next 1-2 weeks): neutral
Medium-term outlook (next 1-3 months): bearish
Long-term outlook (next year): bullish
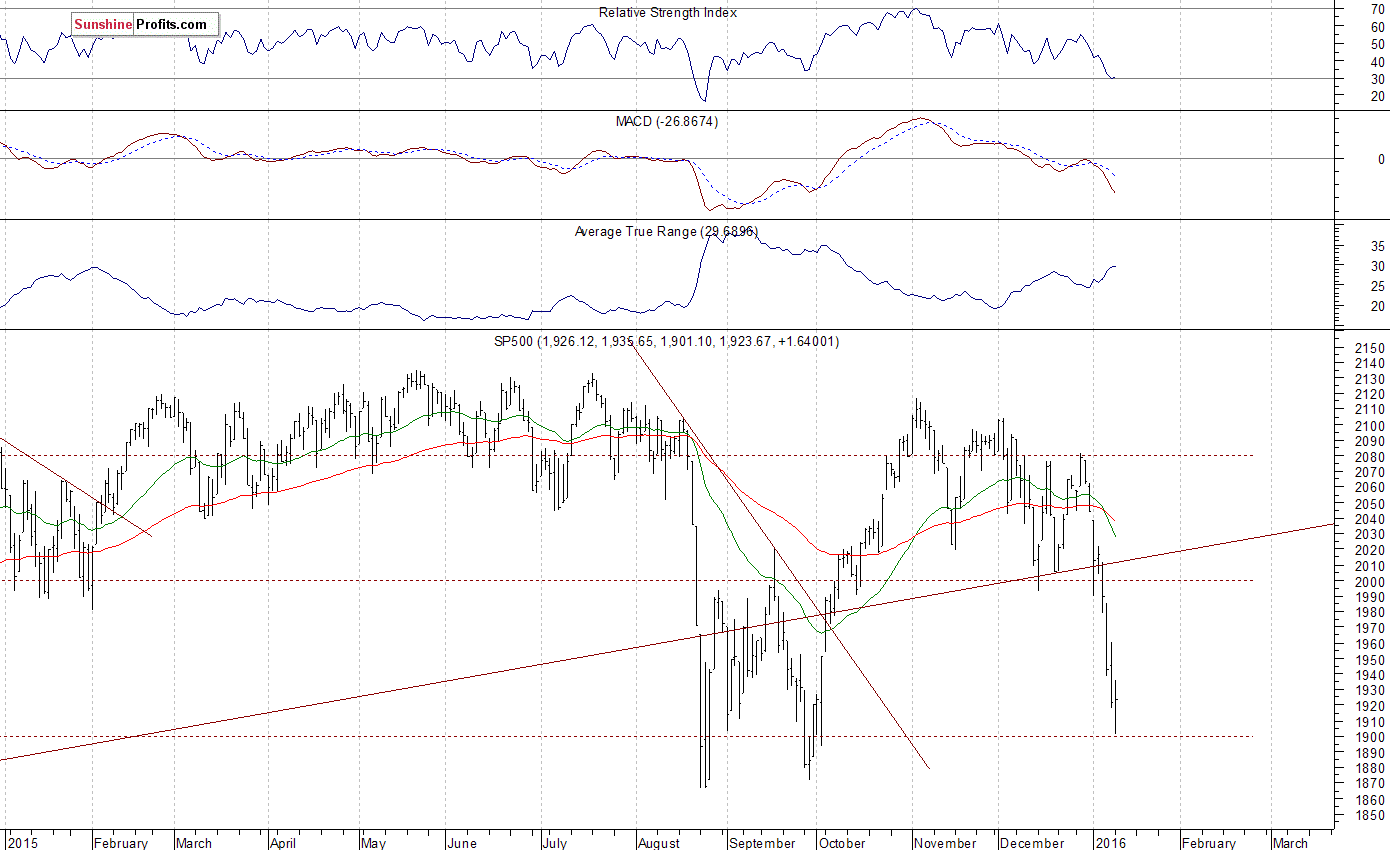
The U.S. stock market indexes gained 0.1-0.3% on Monday, after extending their short-term downtrend and bouncing off support level, as investors hunted bargains following recent sell-off. The S&P 500 index got closer to 1,900 mark yesterday, as it reached the daily low at 1,901.10. The nearest important level of support is at 1,870-1,900, marked by last year's August - September lows. On the other hand, resistance level is at around 1,950-1,960, marked by previous support level. The next important level of resistance is at around 1,980-2,000. There have been no confirmed positive signals so far. However, we can see short-term oversold conditions. The index may retrace some of its recent move down. For now, it looks like a short-term bottoming pattern, before an upward correction:
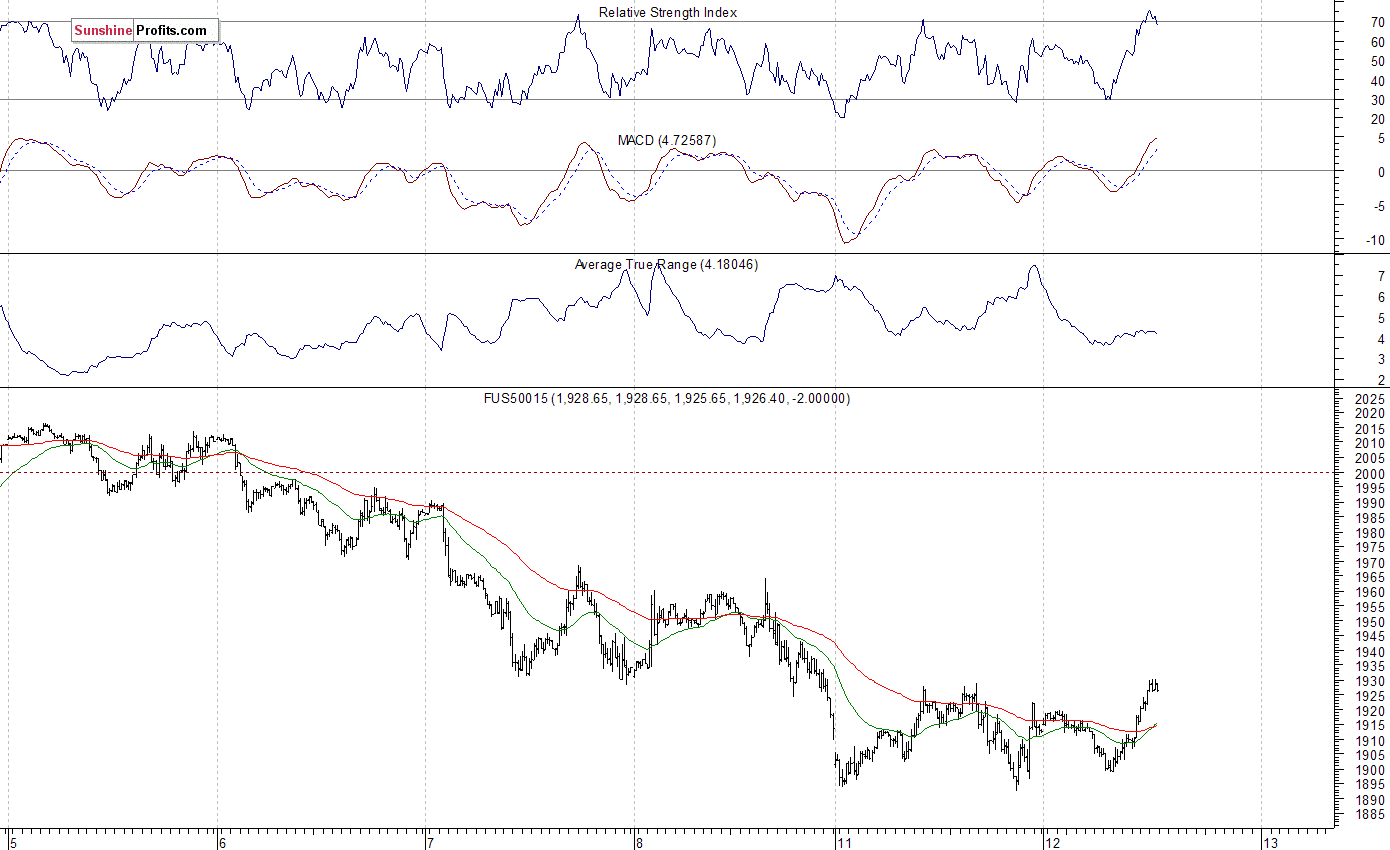
Expectations before the opening of today's trading session are positive, with index futures currently up 0.6%. The main European stock market indexes have gained 1.5-2.2% so far. Investors will now wait for the JOLTS - Job Openings number release at 10:00 a.m. The S&P 500 futures contract trades within an intraday uptrend, as it extends its two-day-long fluctuations along the level of 1,900. The nearest important level of support is at 1,890-1,900. On the other hand, resistance level is at 1,920-1,930, marked by previous local lows. For now, it looks like a relatively flat correction following recent sell-off. However, it may be a bottoming pattern before short-term downtrend reversal or an upward correction, as we can see on the 15-minute chart:
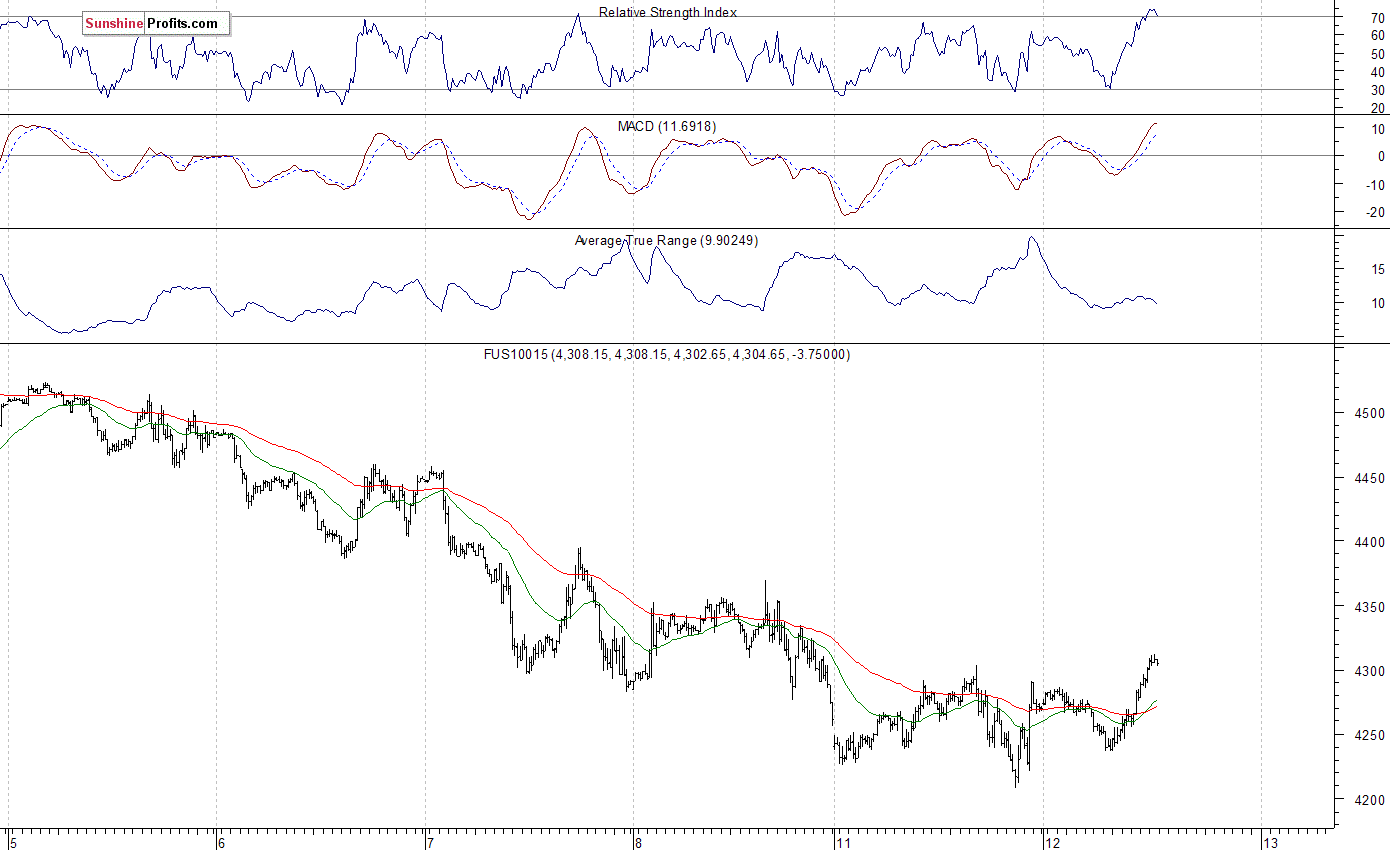
The technology Nasdaq 100 futures contract follows a similar path, as it currently trades at the level of 4,300. The nearest important level of resistance is at 4,300-4,320. On the other hand, support level remains at around 4,250, and the next important support level is at 4,200-4,220, marked yesterday's low, as the 15-minute chart shows:
Concluding, the broad stock market continued short-term downtrend yesterday, as it reached new lows and got closer to last year's August - September lows. However, the S&P 500 index bounced off support level of 1,900. It trades around 10 percent below its last year's May all-time high of 2,134.72, so technically, it is still just a correction following long-term bull market. There have been no confirmed positive signals so far, however, we can see some short-term technical oversold conditions, which may lead to an upward correction at some point. Therefore, we decided to close our profitable speculative short position (2,077.34, S&P 500 index) on Thursday. It has been closed at the opening of Thursday's cash market trading session (S&P 500 index at around 1,965, following temporary opening price of 1,985.32, S&P 500 futures contract 1,947.90 at 9:30 a.m.). Overall, we gained around 112 index points on that trade. We prefer to be out of the market, avoiding low risk/reward ratio trades. We will let you know when we think it is safe to get back in the market.
Thank you.
Paul Rejczak
Stock Trading Strategist
Stock Trading Alerts

