
Briefly: In our opinion, no speculative positions are justified.
Our intraday outlook is neutral, and our short-term outlook is neutral. Our medium-term outlook remains bearish, as the S&P 500 index extends its lower highs, lower lows sequence. We decided to change our long-term outlook to neutral recently, following a move down below medium-term lows:
Intraday outlook (next 24 hours): neutral
Short-term outlook (next 1-2 weeks): neutral
Medium-term outlook (next 1-3 months): bearish
Long-term outlook (next year): neutral
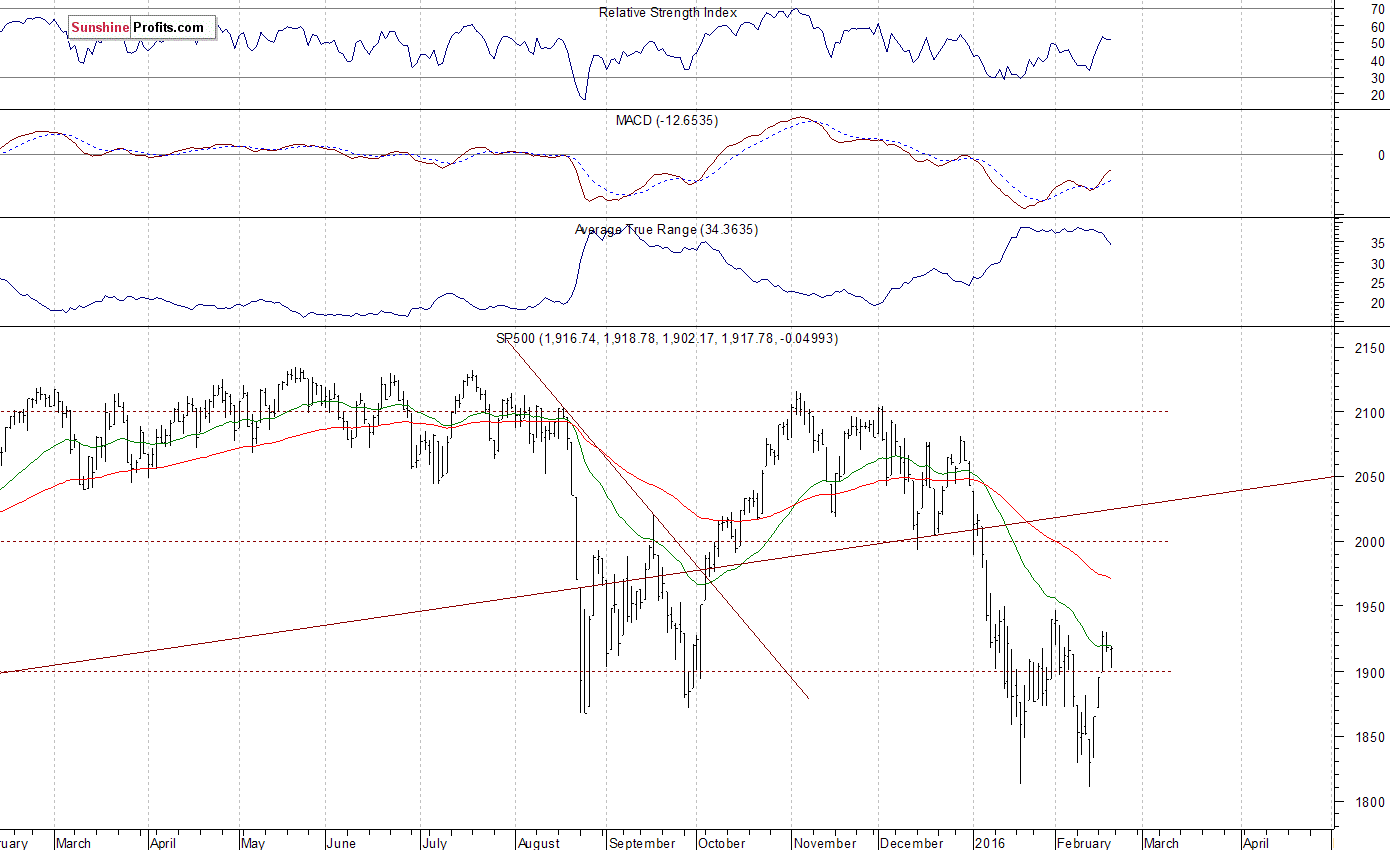
The U.S. stock market indexes were mixed between -0.1% and +0.3% on Friday, extending their short-term consolidation, as investors took profits off the table following recent move up. The S&P 500 index continues to trade along the level of 1,900. The nearest important level of resistance is at around 1,930-1,950, marked by some previous local highs. On the other hand, support level remains at 1,900, marked by Wednesday's daily gap up of 1,895.77-1,898.80. The next support level is at 1,870, marked by Tuesday's daily gap up. For now, it looks like a consolidation following first half of January sell-off. Will it continue downwards? Or is the bullish downtrend's reversal scenario currently in play? Last year's August - September lows continue to act as medium-term support level, as we can see on the daily chart:
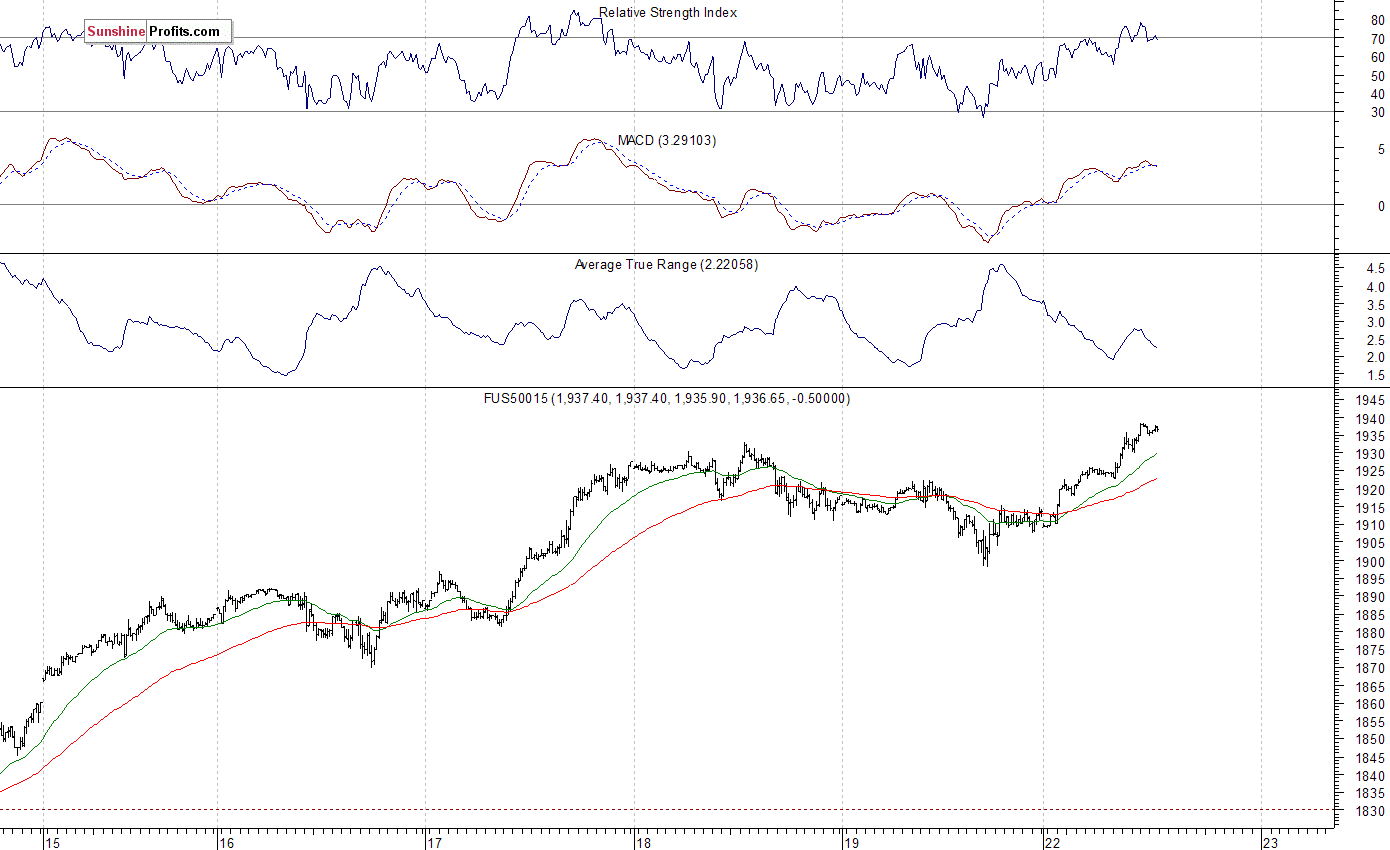
Expectations before the opening of today's trading session are positive, with index futures currently up 1.2-1.3%. The main European stock market indexes have gained 1.3-1.9% so far. The S&P 500 futures contract trades within an intraday uptrend, as it extends its last week's move up. The nearest important level of resistance is at around 1,940-1,950, marked by the early February local high. The nearest important level of support is at 1,900-1,920, marked by recent consolidation, as the 15-minute chart shows:
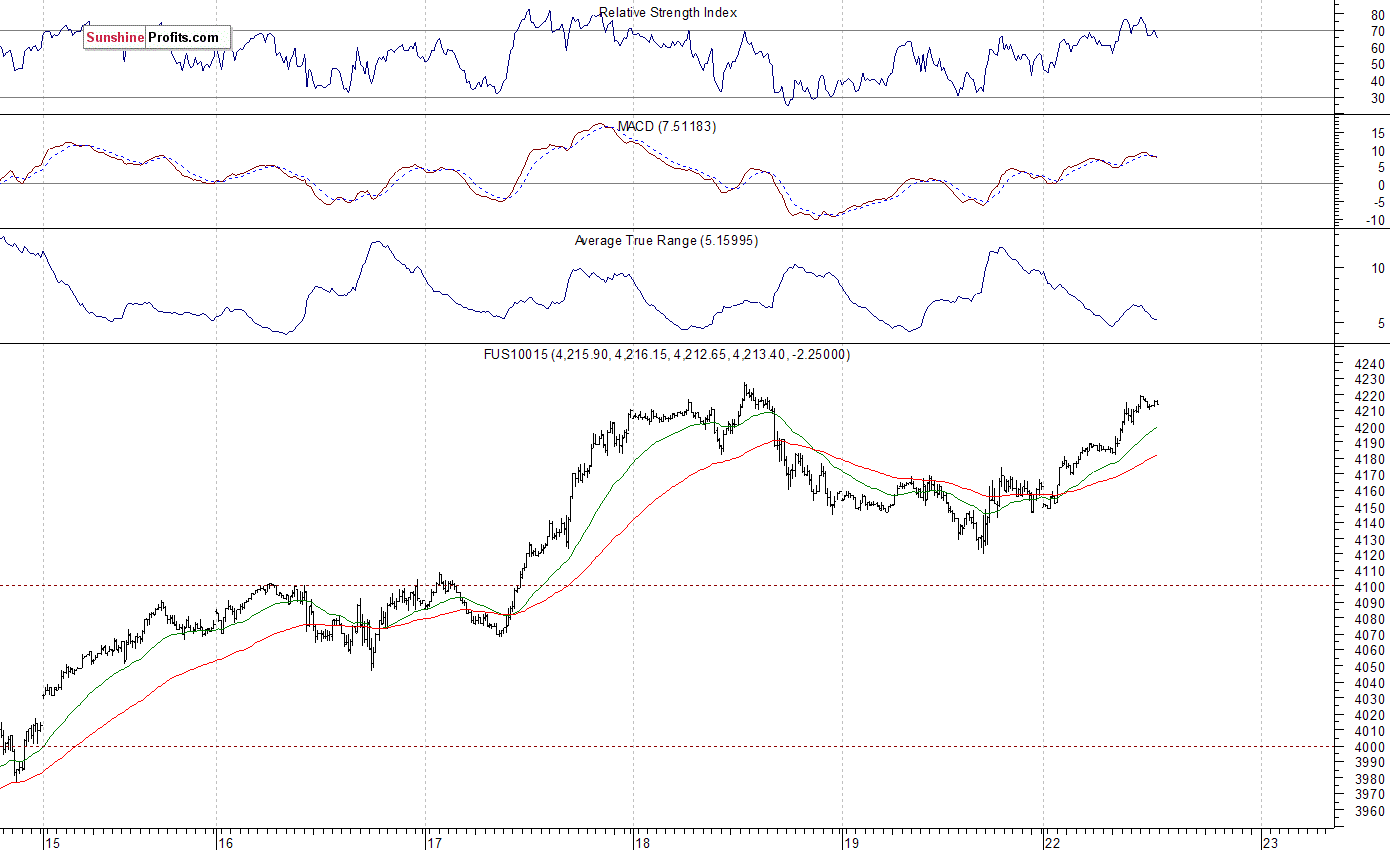
The technology Nasdaq 100 futures contract follows a similar path, as it currently trades close to its last week's high. The nearest important level of support is at around 4,170-4,200. On the other hand, resistance level is at 4,230, among others. There have been no confirmed negative signals so far. However, we can see some short-term overbought conditions:
Concluding, the broad stock market remains within a short-term consolidation following recent move up. Expectations before the opening of today's trading session are very positive, so it may continue its last week's move up. The S&P 500 index continues to trade along its last year's August - September local lows, as they act as medium-term level of support. There have been no confirmed short-term negative signals so far. However, we can see some short-term overbought conditions. Our speculative long position has been closed at the opening of Thursday's cash market trading session (1,925, Thursday's average opening price of the S&P 500 index). Overall, we gained 90 index points on that trade. Currently, we prefer to be out of the market, avoiding low risk/reward ratio trades. We will let you know when we think it is safe to get back in the market.
Thank you.
Paul Rejczak
Stock Trading Strategist
Stock Trading Alerts

