
Briefly: In our opinion, speculative short positions are favored (with stop-loss at 2,050, and profit target at 1,900, S&P 500 index).
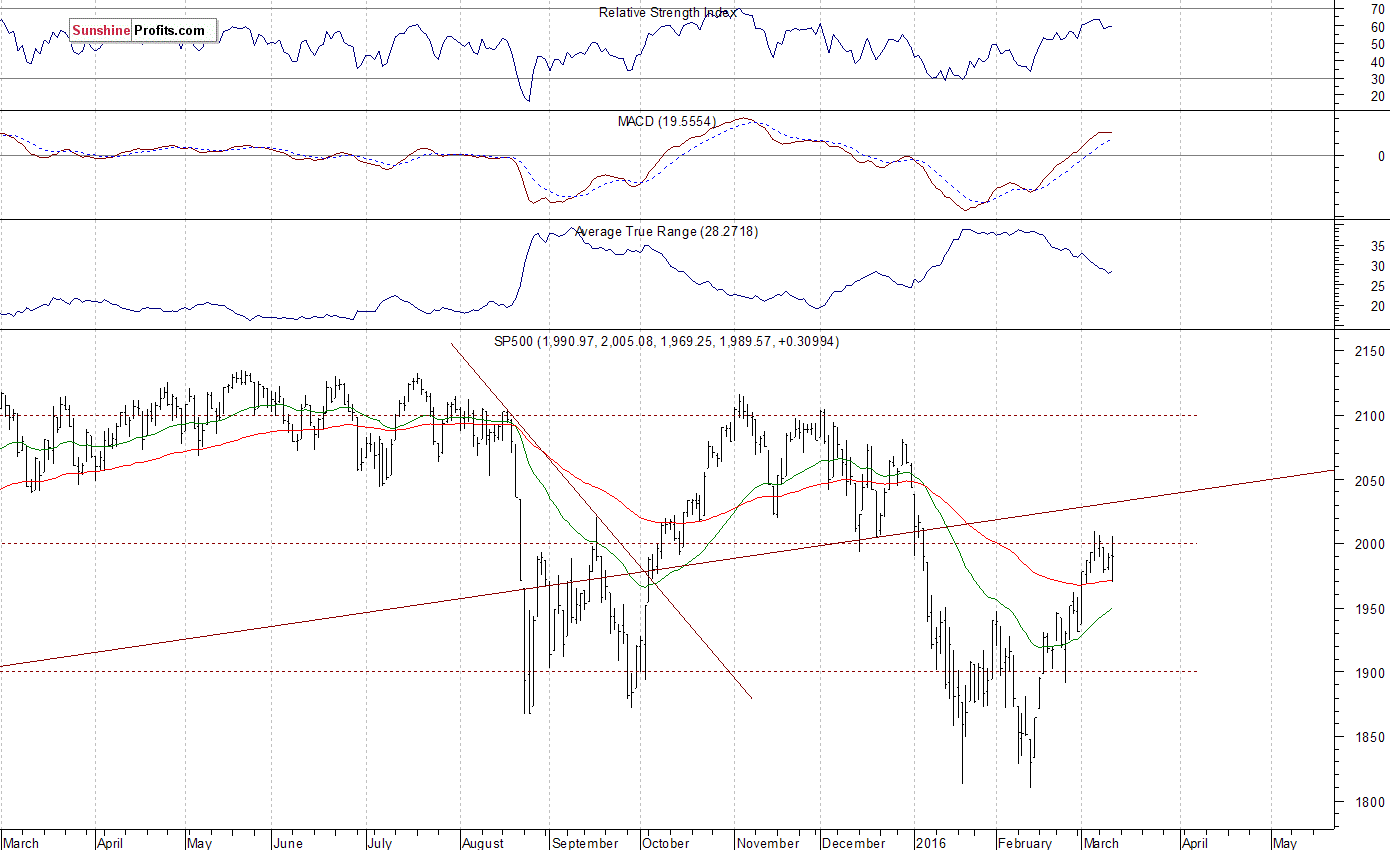
Our intraday outlook is bearish, and our short-term outlook is bearish, as we expect a downward correction or short-term uptrend's reversal at some point. Our medium-term outlook remains bearish, as the S&P 500 index extends its lower highs, lower lows sequence. We decided to change our long-term outlook to neutral recently, following a move down below medium-term lows:
Intraday outlook (next 24 hours): bearish
Short-term outlook (next 1-2 weeks): bearish
Medium-term outlook (next 1-3 months): bearish
Long-term outlook (next year): neutral
The U.S. stock market indexes were virtually flat on Thursday, following volatile trading session, as investors reacted to economic data releases and the European Central Bank's rate decision announcement. The S&P 500 index continues to trade along the level of 2,000. It remains within a short-term consolidation since Friday's better-than-expected Non-Farm Payrolls data release. The nearest important level of resistance is at around 2,000-2,010. The next important level of resistance is at 2,040, marked by the early January daily gap down of 2,038.20-2,043.62. On the other hand, support level is at 1,960-1,980, marked by previous level of resistance. The next important level of support is at 1,950, marked by previous local high. There have been no confirmed negative signals so far. For now, it looks like a consolidation within a month-long uptrend. We still can see some technical overbought conditions:
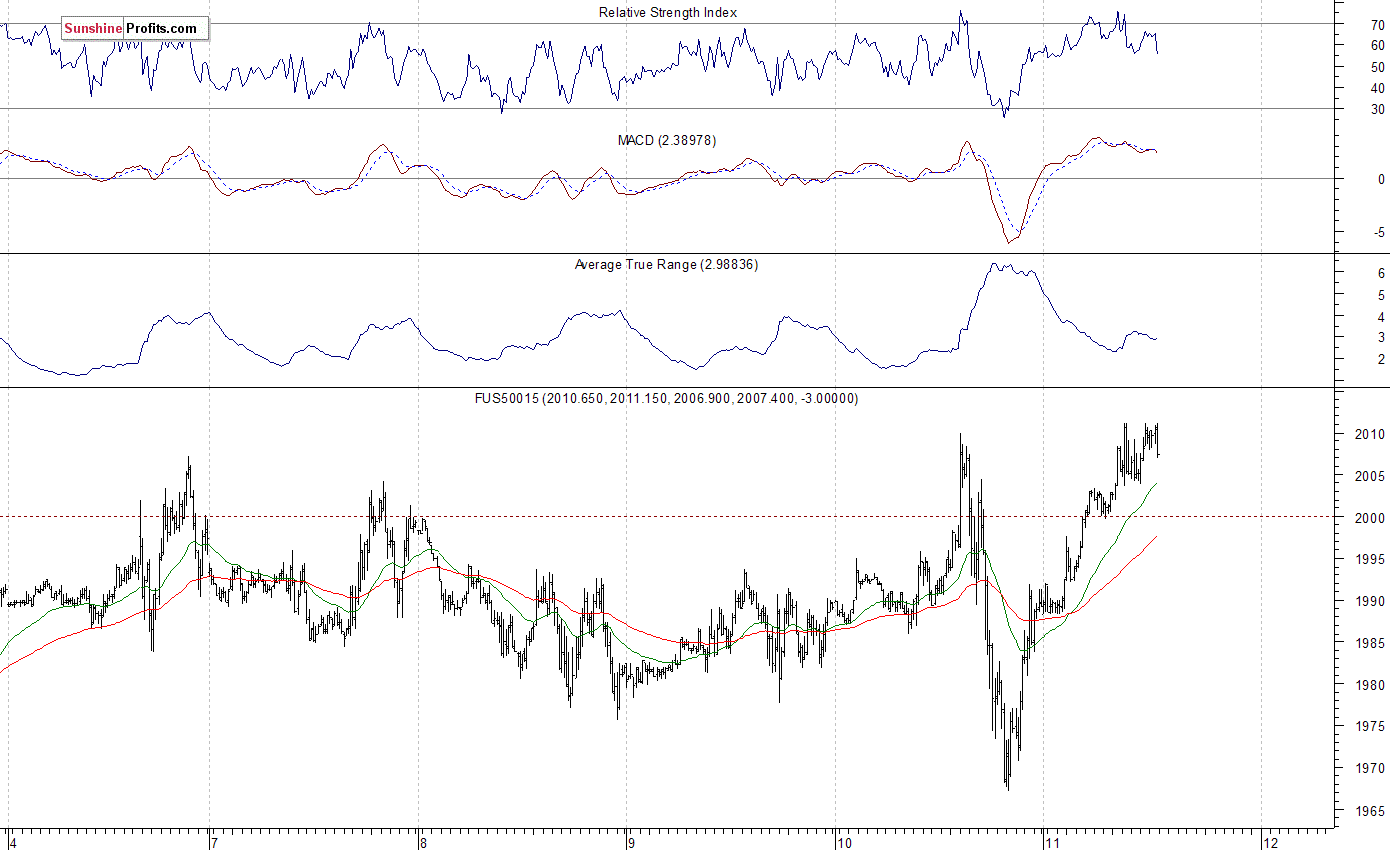
Expectations before the opening of today's trading session are positive, with index futures currently up 0.9-1.3%. The main European stock market indexes have gained 1.3-2.7% so far. The S&P 500 futures contract trades within an intraday uptrend, following yesterday's fluctuations. The nearest important level of resistance is at around 2,010, marked by local highs, and the next resistance level is at 2,040. On the other hand, support level is at 1,990-2,000, marked by recent local lows, among others, as we can see on the 15-minute chart:
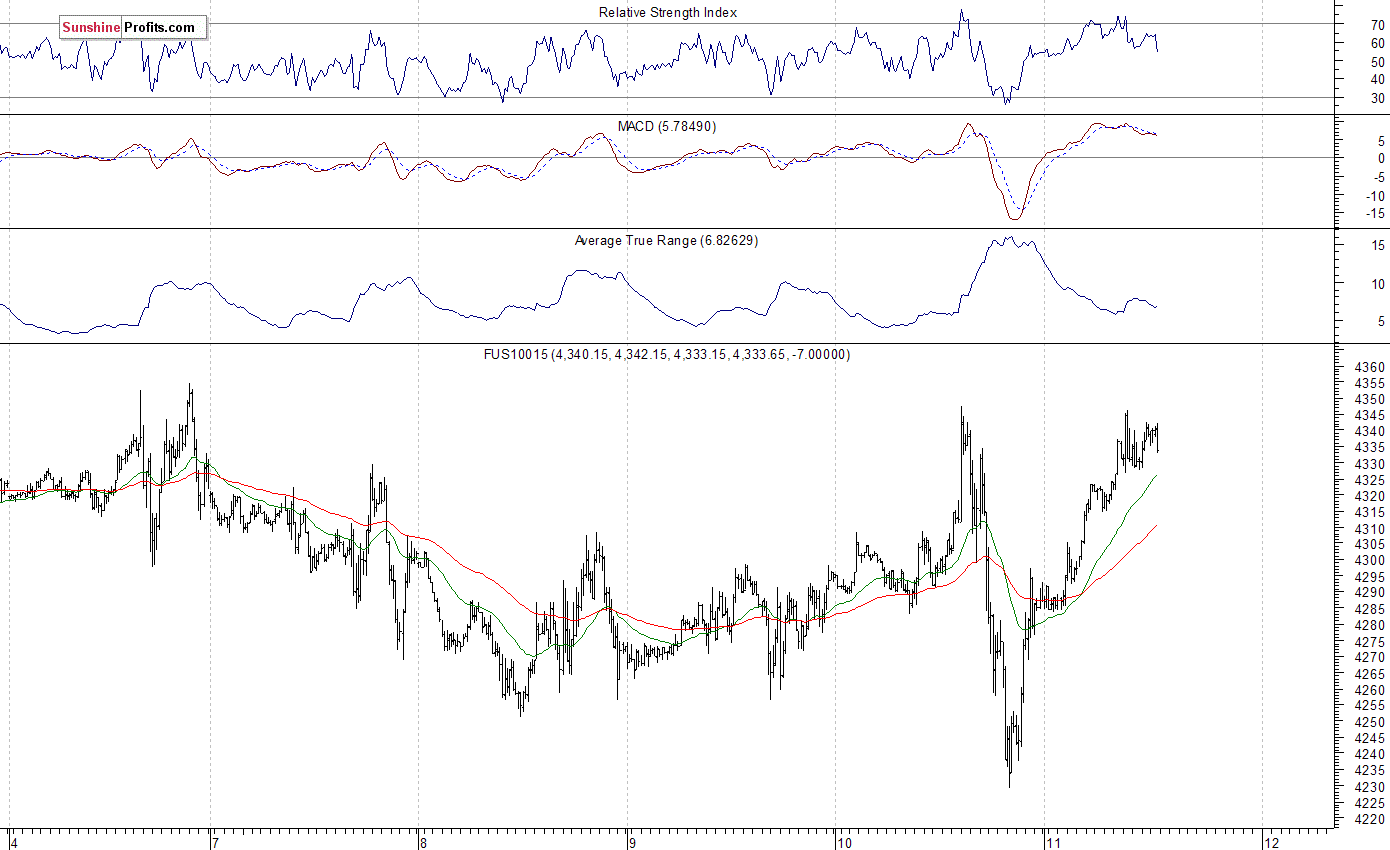
The technology Nasdaq 100 futures contract trades within an intraday uptrend, as it retraces yesterday's sell-off towards support level of 4,200. The nearest important level of resistance is at around 4,330-4,350, marked by last week's local highs. There have been no confirmed negative signals so far. For now, it looks like a relatively flat consolidation within a month-long uptrend off February low:
Concluding, the broad stock market extended its short-term consolidation on Thursday, as the S&P 500 index continued to trade along the level of 2,000. Is this just a correction within month-long rebound or a topping pattern before some more meaningful decline? There have been no confirmed short-term negative signals so far. However, we continue to maintain our speculative short position (opened on Monday at 1,995 - Monday's average opening price of S&P 500 index). We expect a downward correction or uptrend reversal at some point. Stop-loss level is at 2,050, marked by the above-mentioned daily gap down resistance level, and potential profit target is at 1,900 (S&P 500 index). You can trade S&P 500 index using futures contracts (S&P 500 futures contract - SP, E-mini S&P 500 futures contract - ES) or an ETF like the SPDR S&P 500 ETF - SPY. It is always important to set some exit price level in case some events cause the price to move in the unlikely direction. Having safety measures in place helps limit potential losses while letting the gains grow.
Thank you.
Paul Rejczak
Stock Trading Strategist
Stock Trading Alerts

