

Briefly: In our opinion, speculative short positions are favored (with stop-loss at 2,330, and profit target at 2,150, S&P 500 index).
Our intraday outlook remains bearish, and our short-term outlook is bearish. Our medium-term outlook remains neutral, following S&P 500 index breakout above last year's all-time high:
Intraday outlook (next 24 hours): bearish
Short-term outlook (next 1-2 weeks): bearish
Medium-term outlook (next 1-3 months): neutral
Long-term outlook (next year): neutral
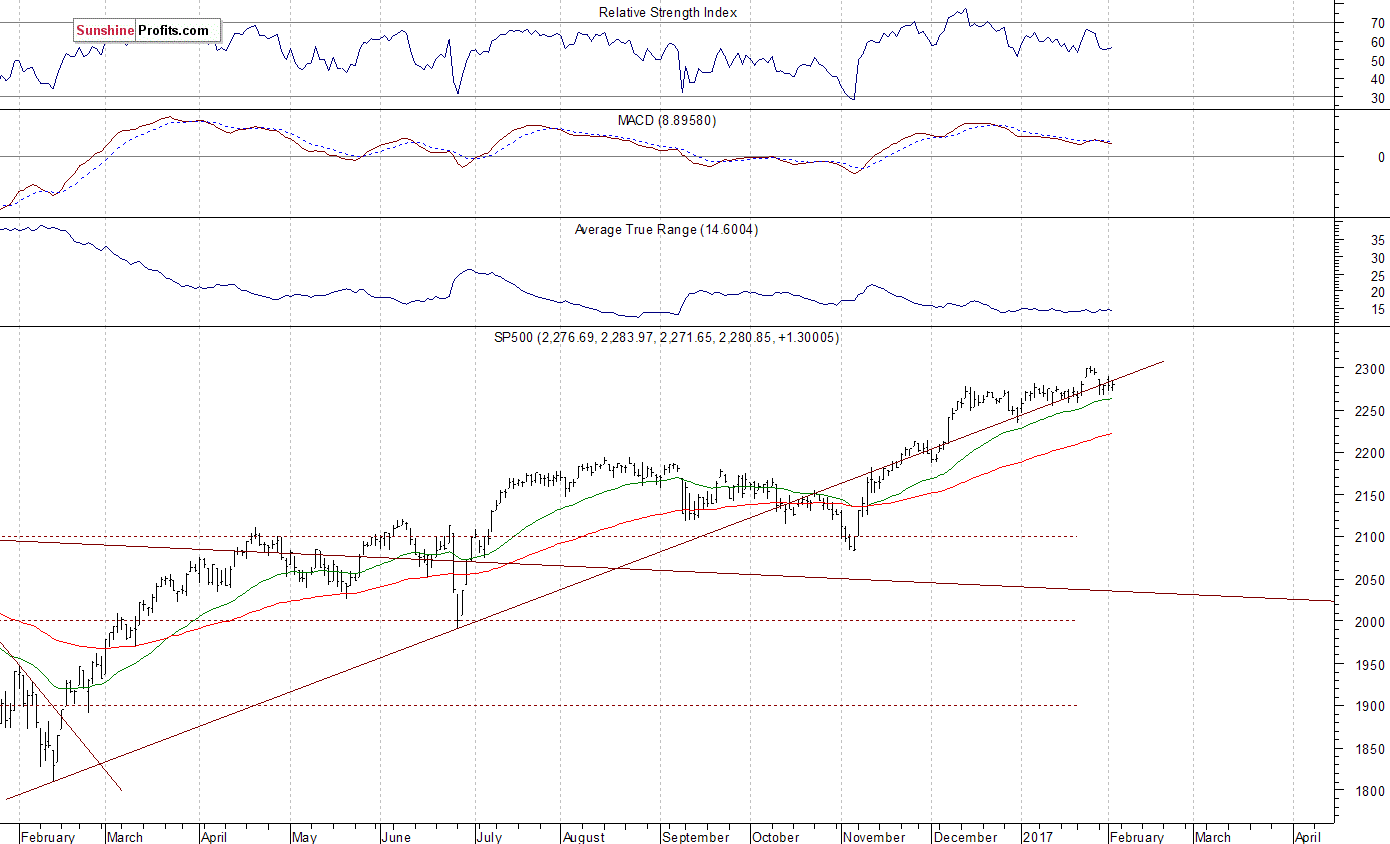
The U.S. stock market indexes were virtually flat on Thursday, extending their short-term uncertainty, as investors continued to take some profits off the table following quarterly corporate earnings, economic data releases. The S&P 500 index extended its short-term consolidation following Monday's daily gap down of 2,286.01-2,291.62. The Dow Jones Industrial Average broke below 20,000 mark on Monday, and the technology Nasdaq Composite Index remains above its support level of 5,600. Technology stock were relatively stronger than the broad stock market recently, as investors reacted to better-than-expected earnings releases. Will the market extend its year-long medium-term uptrend even further before some more meaningful downward correction? The nearest important resistance level of the S&P 500 index is currently at around 2,290, marked by Monday's daily gap down. The next resistance level is at 2,300, marked by last Thursday's record high of 2.300.99. On the other hand, level of support remains at 2,260-2,270, marked by the above-mentioned short-term consolidation. The next support level is at around 2,230-2,235, marked by the late December local low. We can see some short-term volatility following recent move up. Is this a topping pattern before downward reversal? The S&P 500 index still trades along medium-term upward trend line, as we can see on the daily chart:
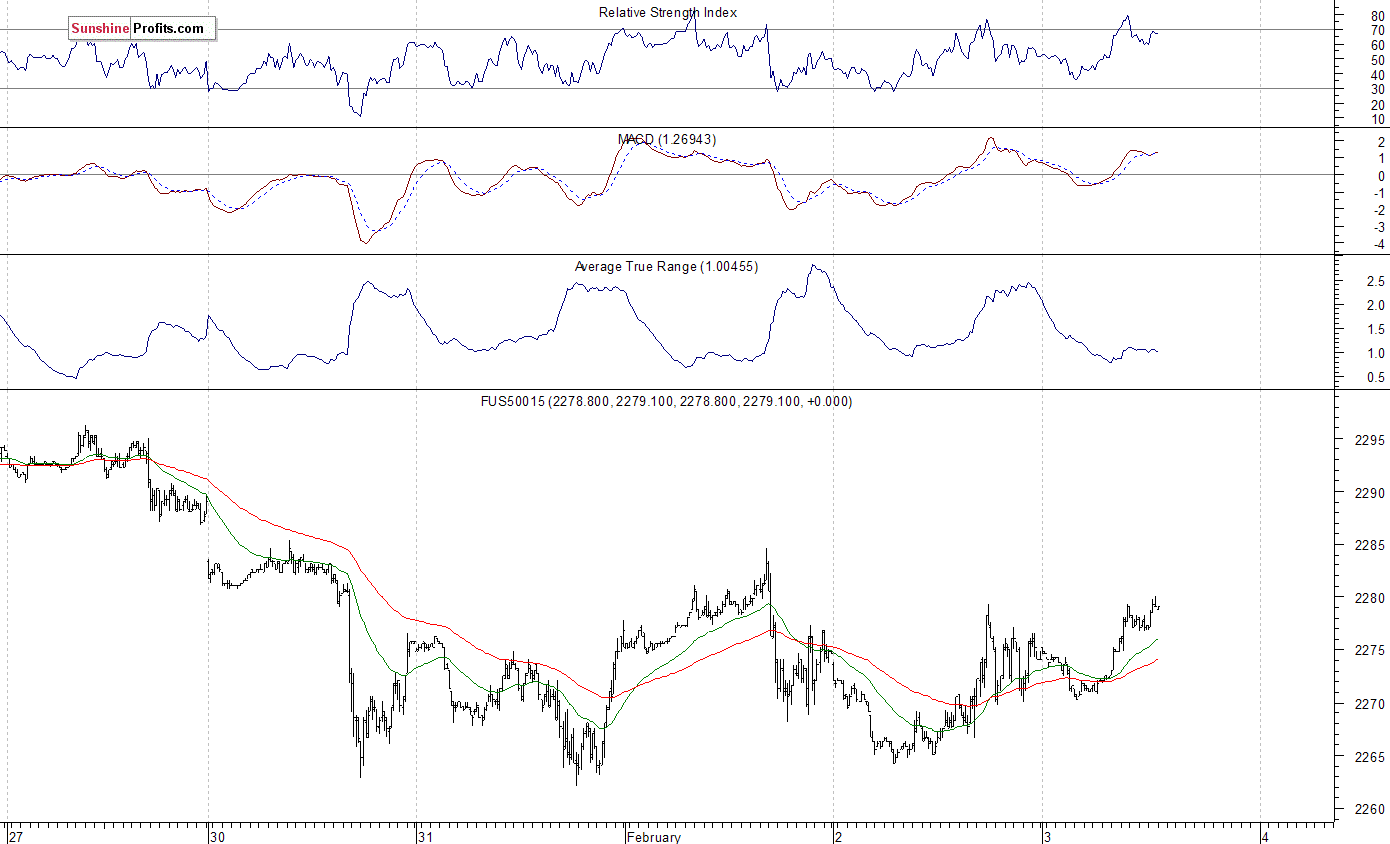
Expectations before the opening of today's trading session are positive, with index futures currently up 0.2%. The European stock market have gained 0.6-0.9% so far. Investors will wait for more quarterly corporate earnings releases, along with some important economic data announcements: Nonfarm Payrolls, Unemployment Rate, Average Hourly Earnings, Average Workweek at 8:30 a.m., Factory Orders, ISM Services at 10:00 a.m. The market expects the Unemployment Rate in January was unchanged at 4.7%, and Nonfarm Payrolls number was 170,000. The S&P 500 futures contract trades within an intraday uptrend, as it retraces its yesterday's move down. The nearest important level of resistance is at around 2,280-2,285, marked by Monday's consolidation following a gap down opening. On the other hand, support level is at 2,260-2,265, marked by local lows. For now, it looks like a relatively flat correction within a short-term downtrend. The futures contract broke below its last week's consolidation along new record highs, as the 15-minute chart shows:
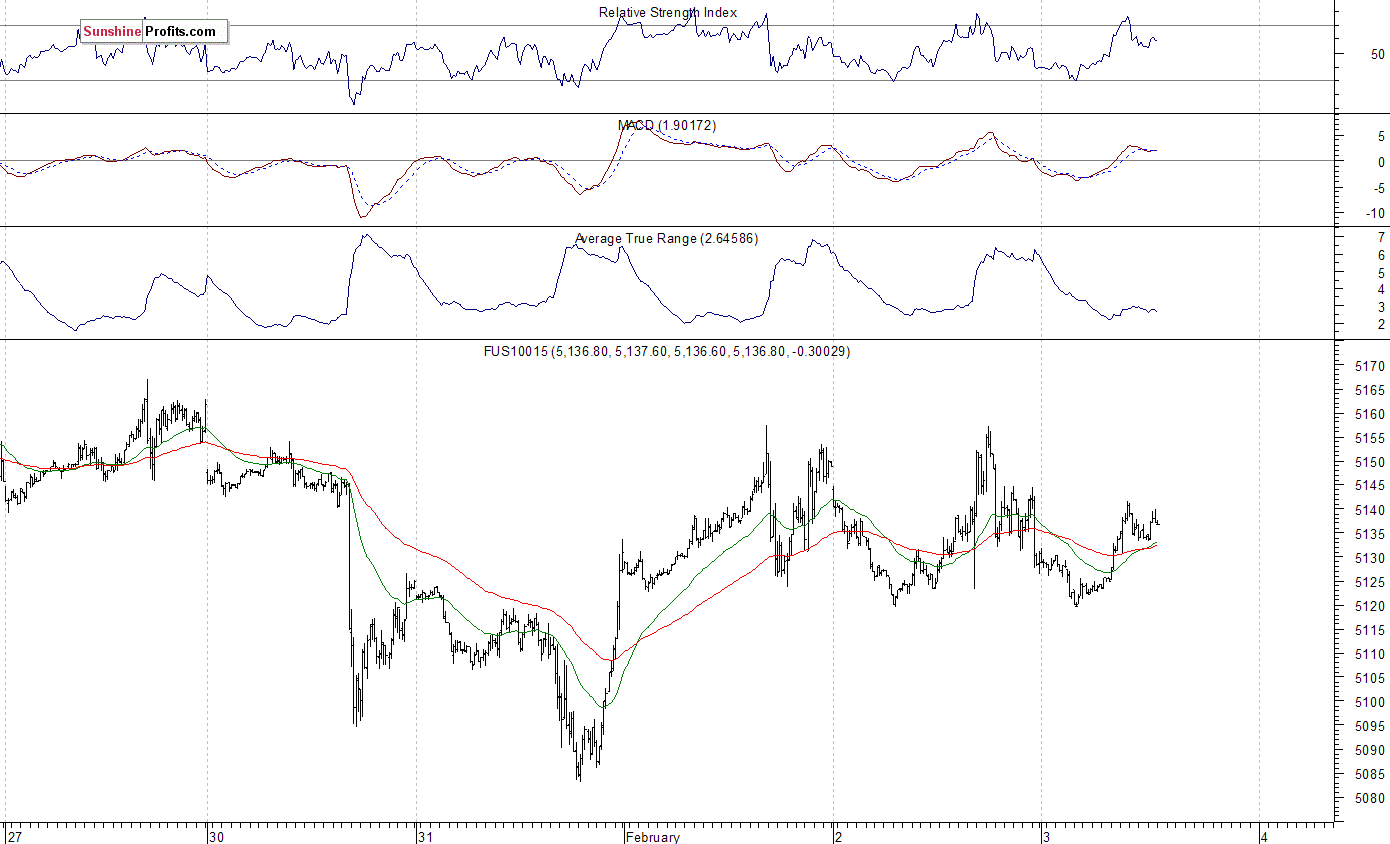
The technology Nasdaq 100 futures contract follows a similar path, as it currently trades within an intraday uptrend, after an overnight decline. The technology sector is relatively weaker than the broad stock market today, following worse-than-expected quarterly earnings release from Amazon. The nearest important level of resistance is at around 5,150-5,170, marked by record highs. On the other hand, support level is at 5,100-5,120, marked by some recent local lows. There has been no clear direction since Wednesday. Is this a flat correction within new downtrend following Monday's reversal or just consolidation before another leg up?
Concluding, the broad stock market remained within its short-term consolidation on Thursday, despite series of quarterly earnings, economic data releases. For now, it looks like a relatively flat correction within a short-term downtrend. We still can see medium-term overbought conditions accompanied by negative technical divergences. Therefore, we continue to maintain our speculative short position (opened on December 14 at 2,268.35 - daily opening price of the S&P 500 index). Stop-loss level remains at 2,330 and potential profit target is at 2,150 (S&P 500 index). You can trade S&P 500 index using futures contracts (S&P 500 futures contract - SP, E-mini S&P 500 futures contract - ES) or an ETF like the SPDR S&P 500 ETF - SPY. It is always important to set some exit price level in case some events cause the price to move in the unlikely direction. Having safety measures in place helps limit potential losses while letting the gains grow.
To summarize: short position in S&P 500 index is justified from the risk/reward perspective with the following entry prices, stop-loss orders and profit target price levels:
S&P 500 index - short position: profit target level: 2,150; stop-loss level: 2,330
S&P 500 futures contract (March 2017) - short position: profit target level: 2,145; stop-loss level: 2,325
SPY ETF (SPDR S&P 500, not leveraged) - short position: profit target level: $214; stop-loss level: $232
SDS ETF (ProShares UltraShort S&P500, leveraged: -2x) - long position: profit target level: $16.35; stop-loss level: $14.00 (calculated using trade's opening price on Dec 14 at $14.78).
Thank you.
Paul Rejczak
Stock Trading Strategist
Stock Trading Alerts

