
Briefly: In our opinion, no speculative positions are justified.
Our intraday outlook is neutral, and our short-term outlook is neutral. Our medium-term outlook remains neutral, following S&P 500 index breakout above last year's all-time high:
Intraday outlook (next 24 hours): neutral
Short-term outlook (next 1-2 weeks): neutral
Medium-term outlook (next 1-3 months): neutral
Long-term outlook (next year): neutral
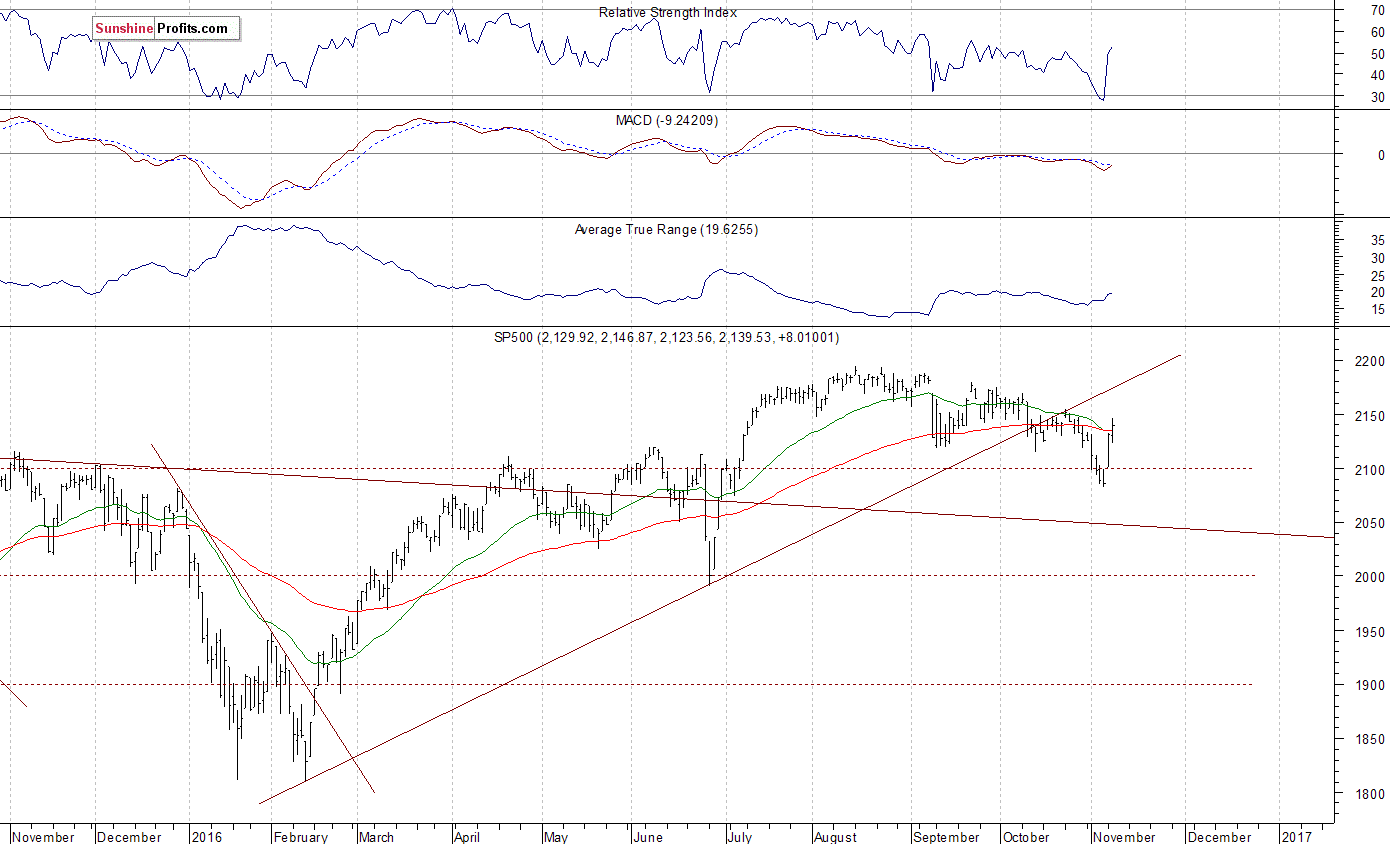
The U.S. stock market indexes gained 0.4-0.7% on Tuesday, extending their short-term move up, as investors' sentiment improved ahead of the U.S. presidential elections. The S&P 500 index trades below the resistance level of 2,150-2,160, marked by some previous local highs. The next resistance level is at 2,180-2,200, marked by record high. On the other hand, support level is at 2,100-2,120, marked by previous resistance level. The next important level of support remains at around 2,080, marked by recent local lows, as we can see on the daily chart:
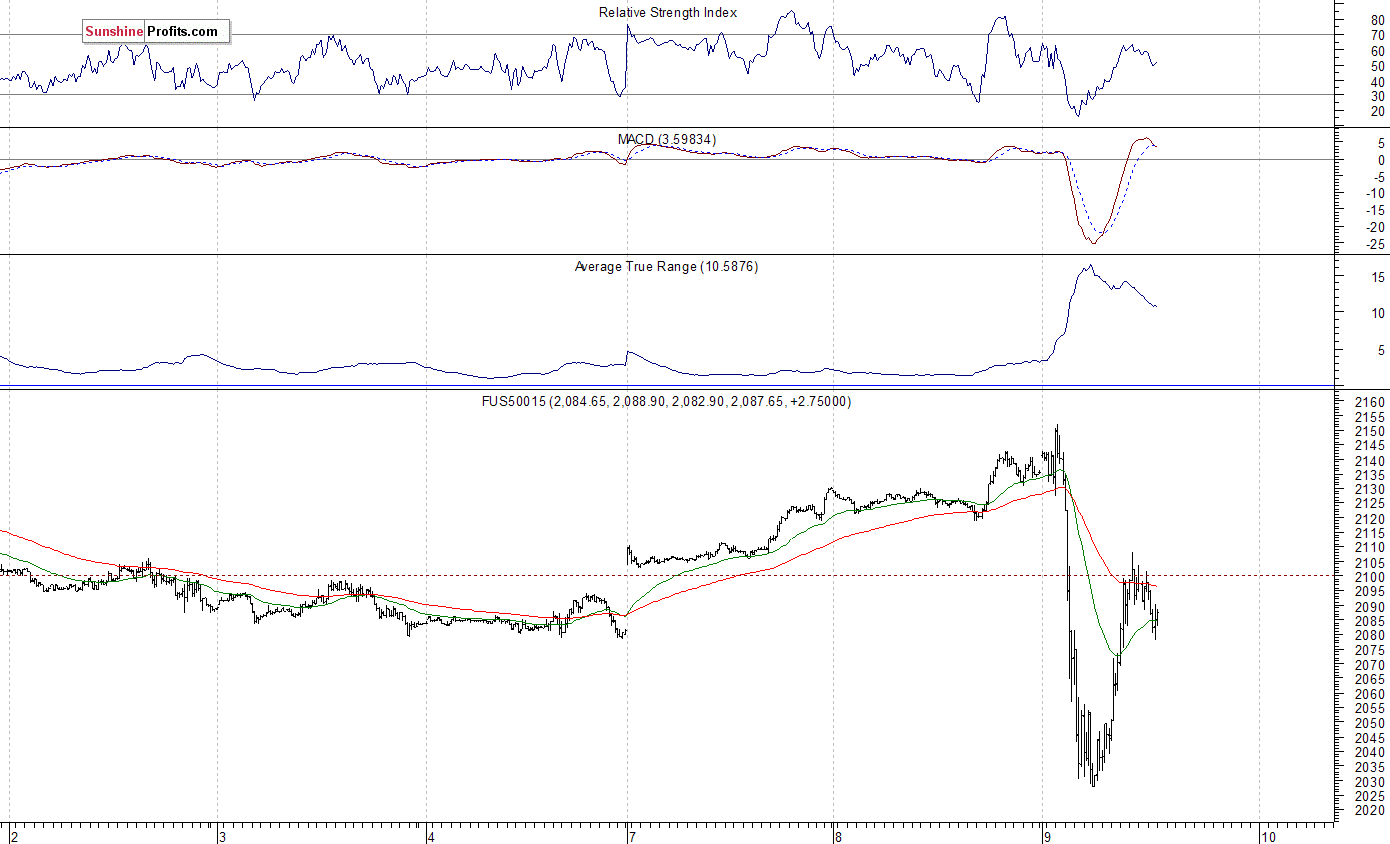
Expectations before the opening of today's trading session are negative, with index futures currently down 2.1-2.7%. The European stock market indexes have lost 0.7-1.6% so far. The S&P 500 futures contract trades within an intraday consolidation following an overnight breakout below its last week's low, and a sharp rebound to resistance level of 2,100. The nearest important level of support is at 2,025-2,050:
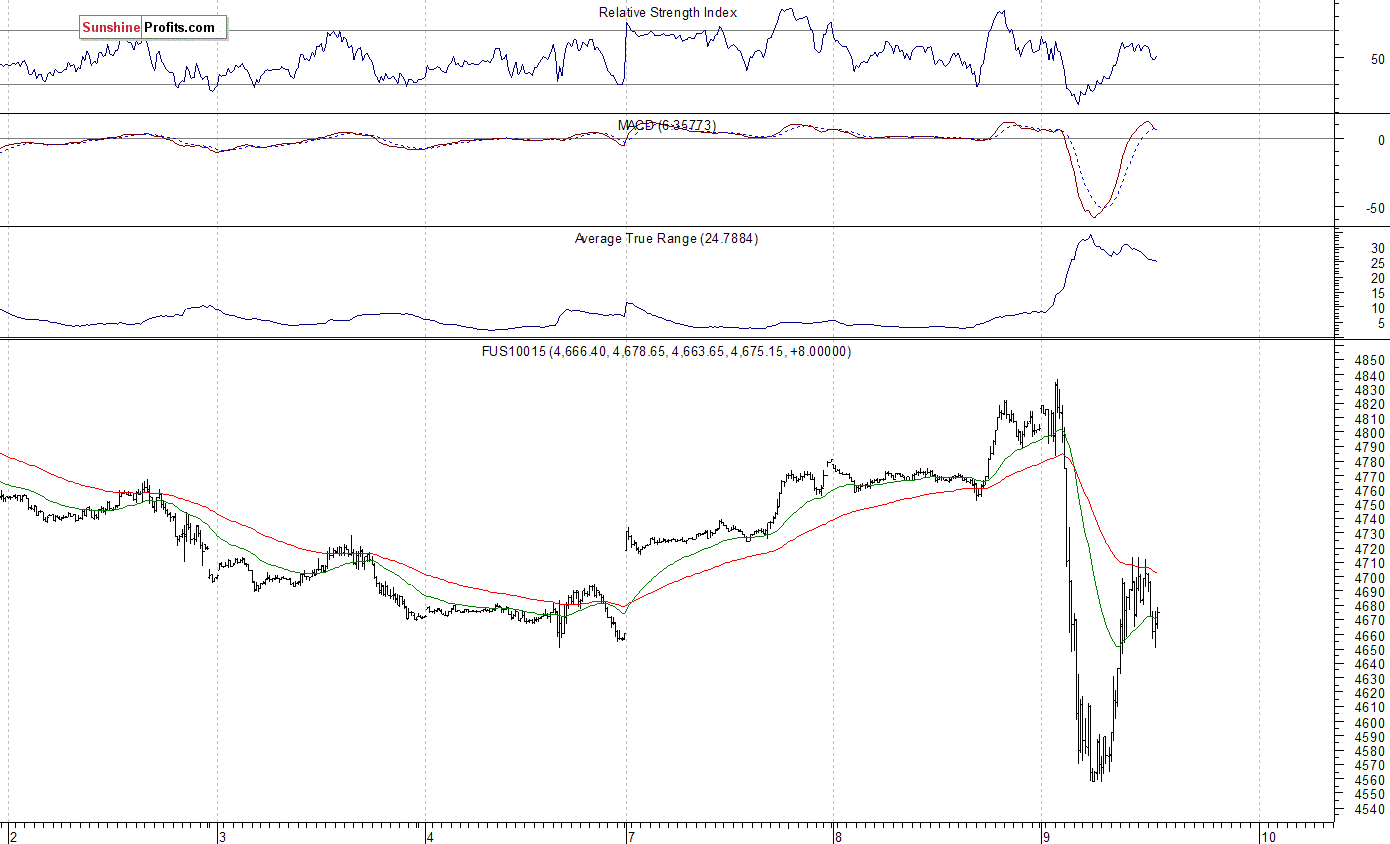
The technology Nasdaq 100 futures follows a similar path, as it currently trades within an intraday consolidation following bounce off support level at 4,550-4,600. The nearest important level of resistance is at around 4,700, and the next resistance level is at 4,750-4,800, marked by recent consolidation. On the other hand, support level remains at the above-mentioned level of 4,550-4,600. The market extends its downtrend, as the 15-minute chart shows:
Concluding, the broad stock market extended its short-term uptrend on Tuesday, before selling off to new lows (S&P 500 futures contract). Will it continue lower? Or is this some volatile bottoming pattern before a downtrend reversal? We decided to close our profitable short position (opened on July 18 at 2,162 - S&P 500 index) at the opening of Friday's trading session - the average opening price of the S&P 500 index was at 2,085. Overall, we gained 77 index points on that over three-month-long speculative short trade following June - July rally off "Brexit" low. Currently, we prefer to be out of the market, avoiding low risk/reward ratio trades. We will let you know when we think it is safe to get back in the market.
Thank you.
Paul Rejczak
Stock Trading Strategist
Stock Trading Alerts

