
Briefly: In our opinion, no speculative positions are justified.
Our intraday outlook is neutral, and our short-term outlook is neutral. Our medium-term outlook remains bearish, as the S&P 500 index extends its lower highs, lower lows sequence:
Intraday outlook (next 24 hours): neutral
Short-term outlook (next 1-2 weeks): neutral
Medium-term outlook (next 1-3 months): bearish
Long-term outlook (next year): neutral
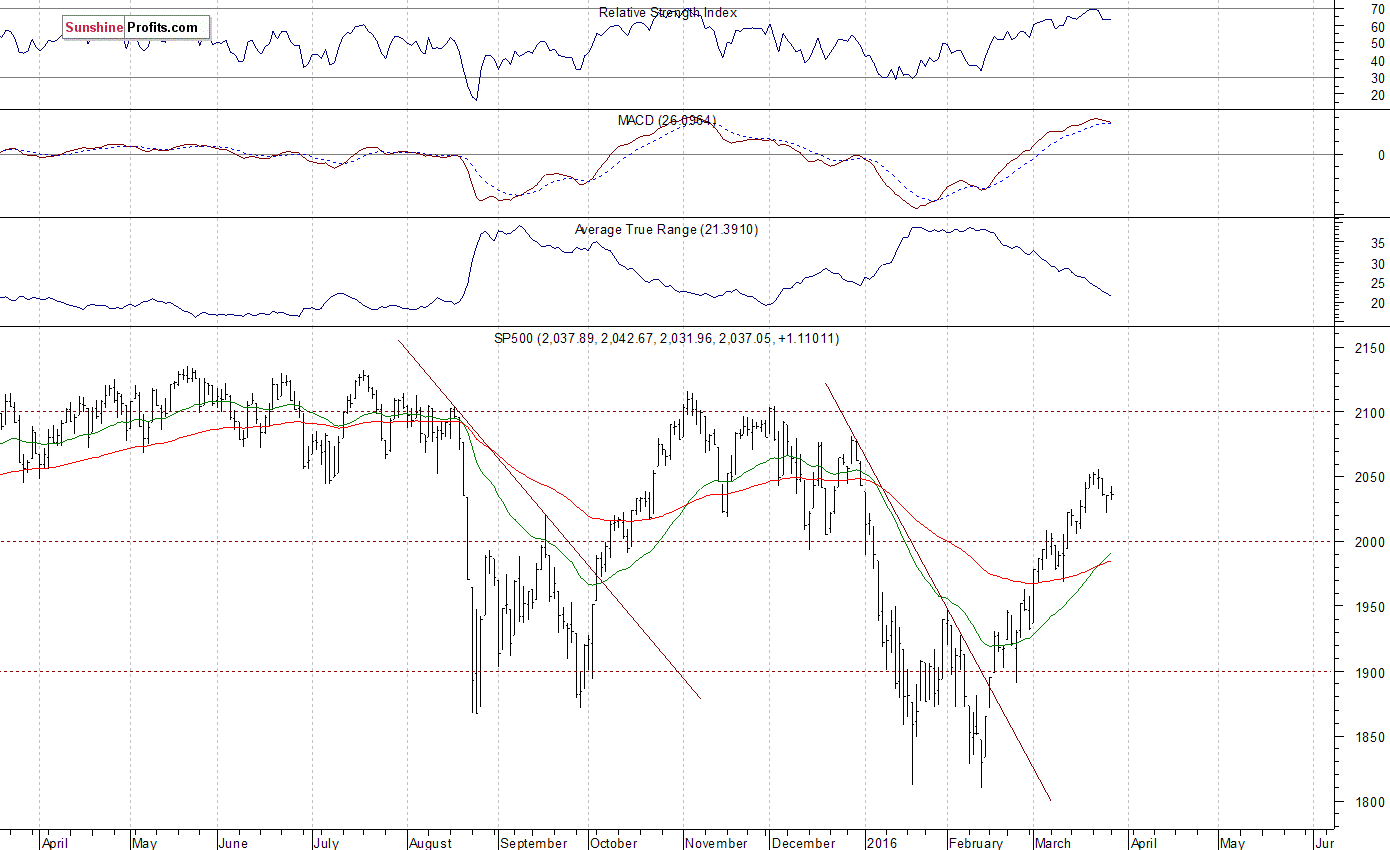
The U.S. stock market indexes were mixed between -0.2% and +0.1% on Monday, extending their recent uncertainty, as investors continued to hesitate following month-long uptrend. The S&P 500 index trades along the level of 2,050. The nearest important level of resistance is at around 2,080, marked by the late December local high of 2,081.56. On the other hand, support level remains at 2,000, and the next support level is at 1,960-1,980, marked by previous level of resistance. There have been no confirmed negative signals so far. However, we can see some technical overbought conditions, along with short-term uncertainty. The index continues to trade within a slightly descending medium-term trading channel, as the daily chart shows:
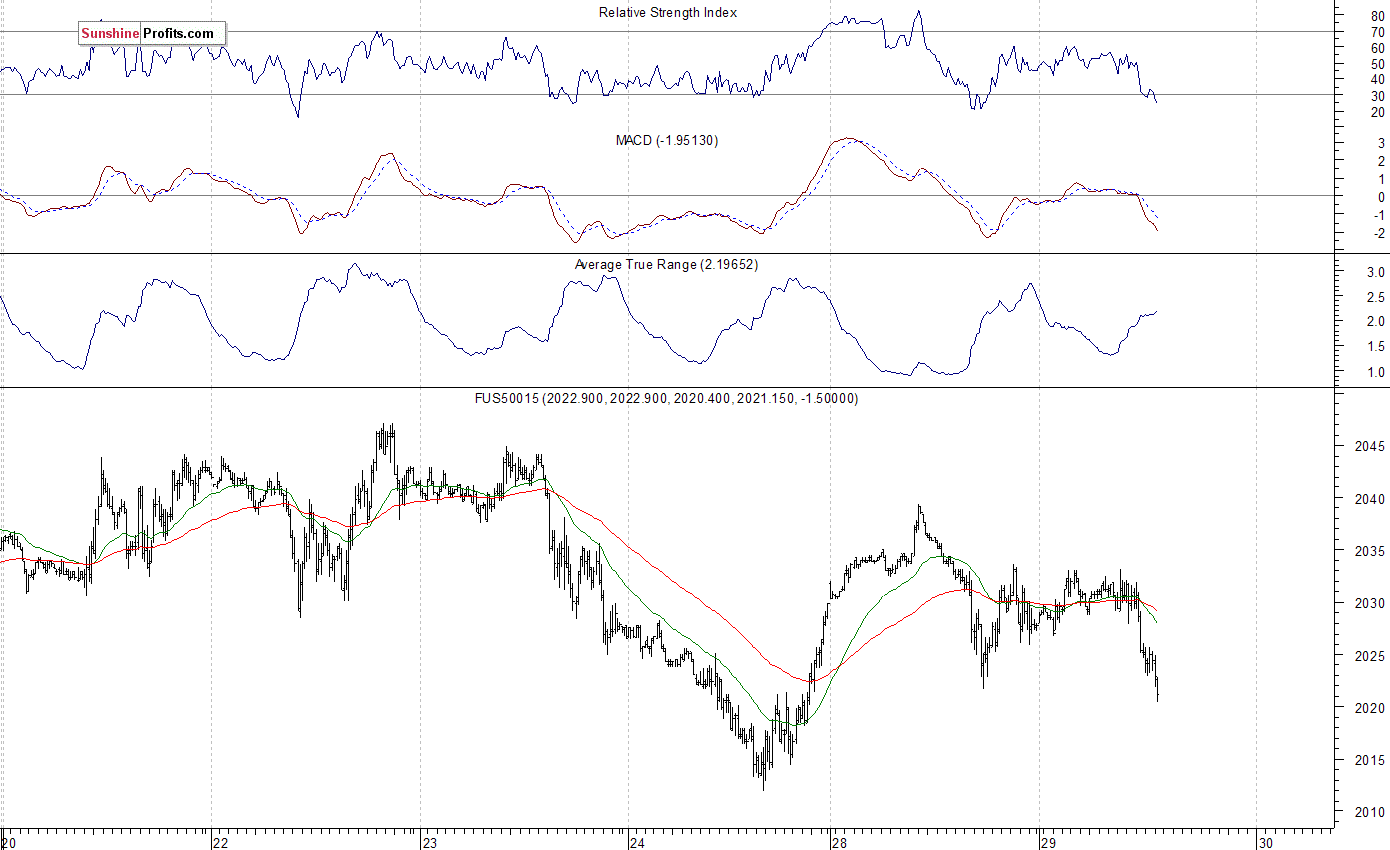
Expectations before the opening of today's trading session are negative, with index futures currently down 0.2-0.3%. The main European stock market indexes have been mixed so far. Investors will now wait for some economic data announcements: Case-Shiller 20-city Index at 9:00 a.m., Consumer Confidence at 10:00 a.m. The S&P 500 futures contract trades within an intraday downtrend, as it extends its yesterday's move down. The nearest important level of resistance remains at around 2,040-2,050, marked by local highs. On the other hand, support level is at 2,010-2,020, among others. For now, it looks like short-term consolidation following month-long advance. Or is this some sort of a topping pattern before uptrend reversal?
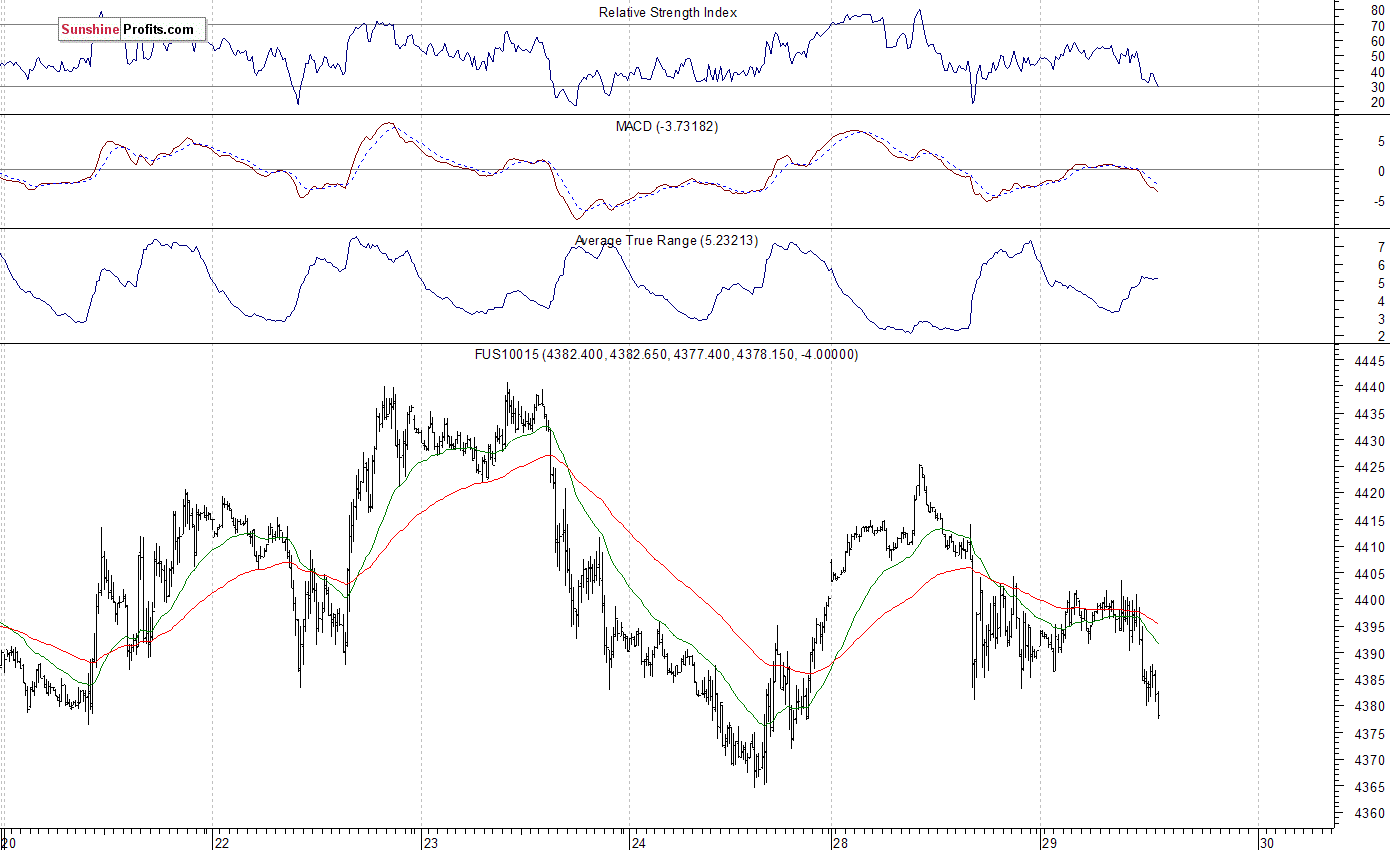
The technology Nasdaq 100 futures contract follows a similar pattern, as it trades below the level of 4,400 again. The nearest important level of support is at around 4,320-4,350, marked by previous consolidation, among others. On the other hand, resistance level is at 4,400, marked by previous level of support, as we can see on the 15-minute chart:
Concluding, the broad stock market extends its short-term consolidation, as investors take some profits off the table, following February - March rally. There have been no confirmed negative signals so far. However, we can see technical overbought conditions. Will it lead to a short-term uptrend reversal or some more meaningful downward correction? We still prefer to be out of the market, avoiding low risk/reward ratio trades. We will let you know when we think it is safe to get back in the market.
Thank you.
Paul Rejczak
Stock Trading Strategist
Stock Trading Alerts

