

Briefly: In our opinion, no speculative positions are justified.
Our intraday outlook is neutral, and our short-term outlook is neutral. Our medium-term outlook remains bearish, as the S&P 500 index extends its lower highs, lower lows sequence:
Intraday outlook (next 24 hours): neutral
Short-term outlook (next 1-2 weeks): neutral
Medium-term outlook (next 1-3 months): bearish
Long-term outlook (next year): neutral
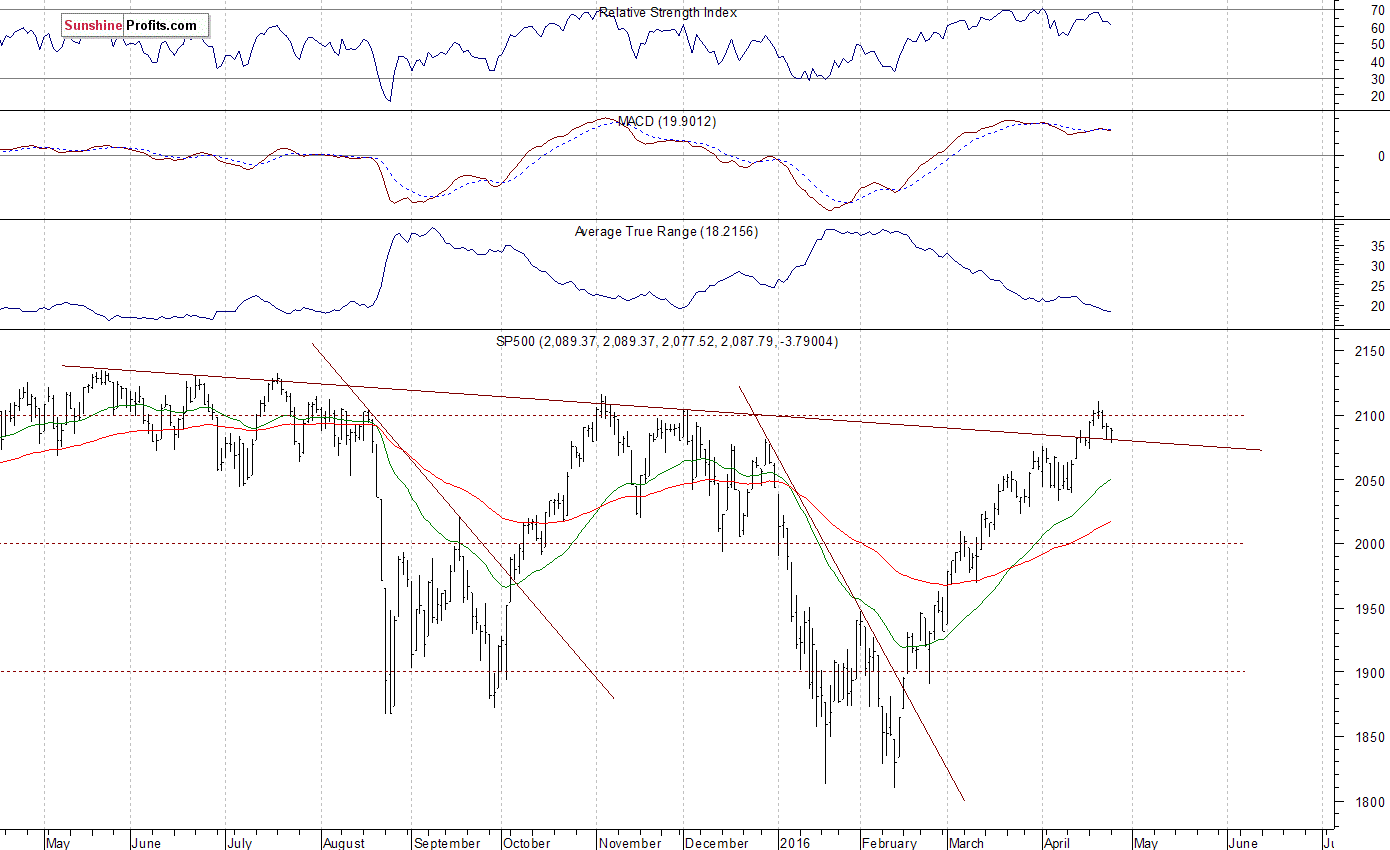
The U.S. stock market indexes were mixed between -0.2% and 0.0% on Monday, as investors continued to hesitate following last week's volatility, ahead of quarterly earnings releases and tomorrow's Fed Rate Decision announcement. The S&P 500 index remains slightly below the level of 2,100, after bouncing off support level at around 2,075-2,080, marked by previous local lows. The nearest important level of resistance is at 2,100-2,115, marked by last year's medium-term local highs. The next important level of resistance is at 2,120-2,135, marked by last year's May S&P 500's all-time high of 2,134.72. There have been no confirmed negative signals so far. However, we can see some technical overbought conditions. But will the market break above its last year's all-time high? For now, it looks like a short-term consolidation within an uptrend:
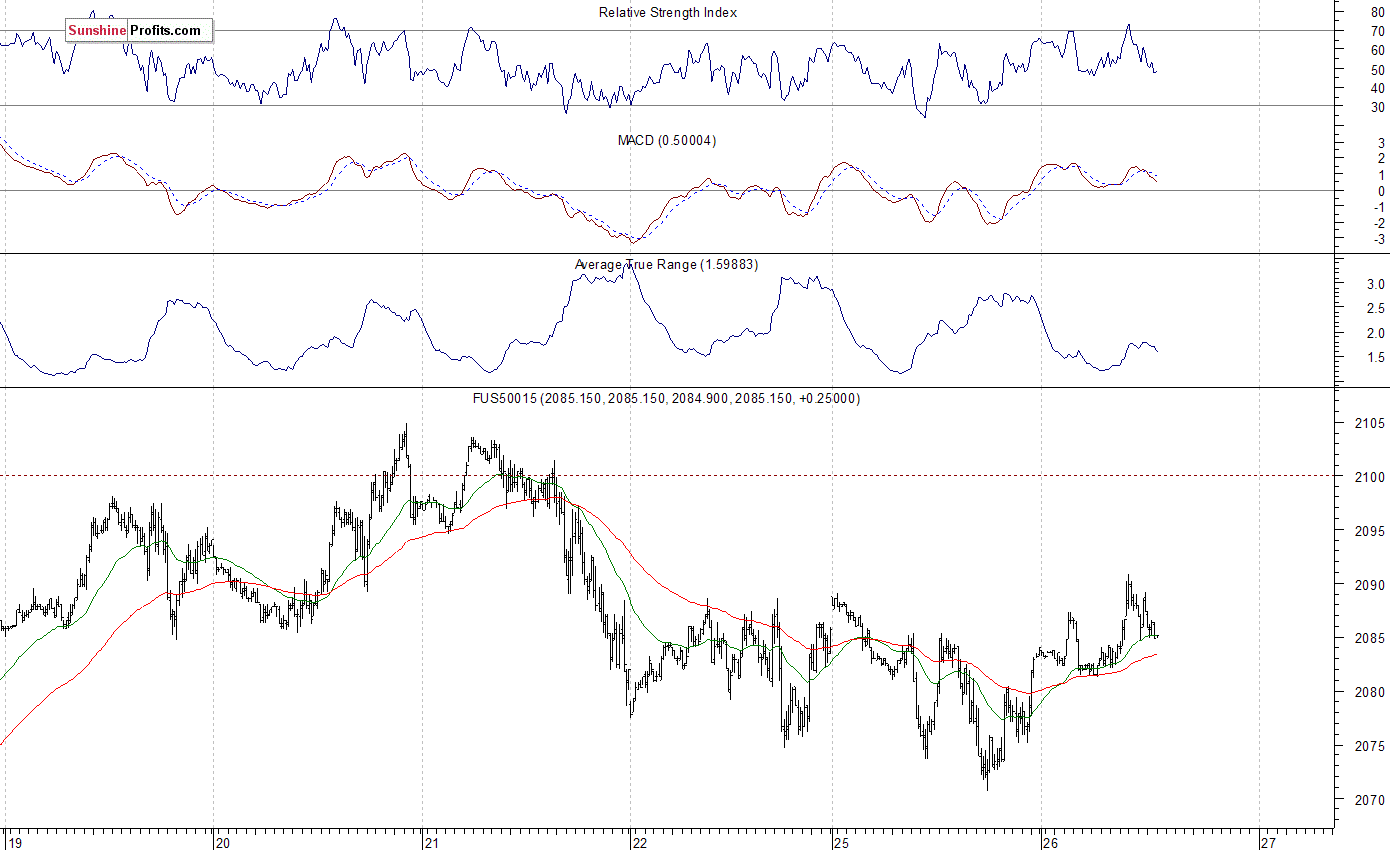
Expectations before the opening of today's trading session are virtually flat, with index futures currently up 0.1%. The main European stock market indexes have been mixed so far. Investors will now wait for some economic data announcements: Durable Orders at 8:30 a.m., Case Shiller 20-city Index at 9:00 a.m., Consumer Confidence number at 10:00 a.m. The S&P 500 futures contract trades within an intraday consolidation. The nearest important level of resistance remains at around 2,090, marked by previous local high. On the other hand, support level is at 2,070, as we can see on the 15-minute chart:
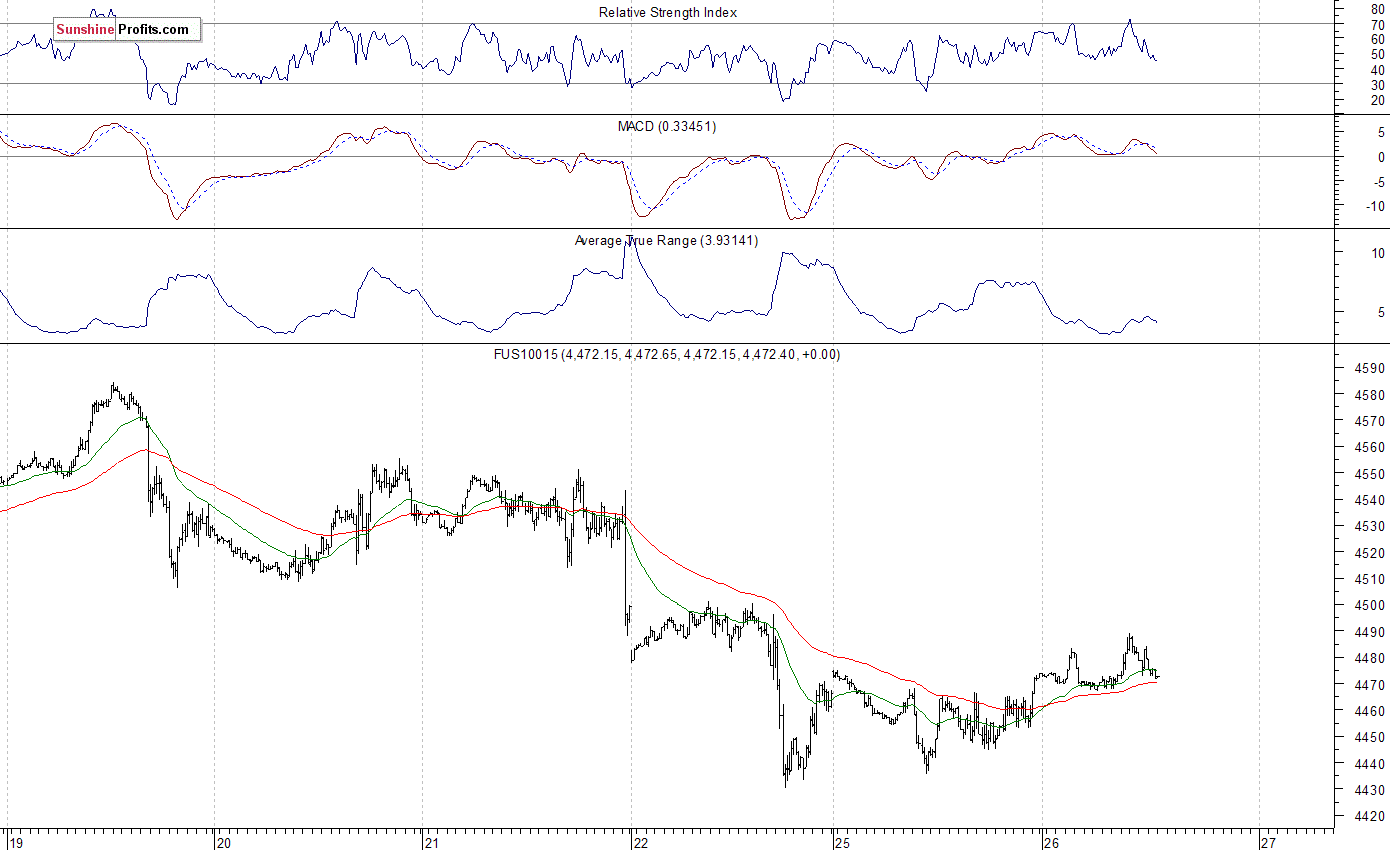
The technology Nasdaq 100 futures contract continues to fluctuate, following its recent breakdown below the level of 4,500. The nearest important level of resistance is at around 4,480-4,500. On the other hand, support level remains at around 4,430-4,450, as the 15-minute chart shows:
Concluding, the broad stock market extended its short-term consolidation on Monday, as investors awaited quarterly corporate earnings releases, tomorrow's Fed Rate Decision announcement. The S&P 500 index remains relatively close to its last year's medium-term local highs. We still can see technical overbought conditions that may lead to uptrend's reversal or downward correction. However, there have been no confirmed short-term negative signals so far. Our speculative short position has been closed at the stop-loss level of 2,100 on Tuesday (S&P 500 index; the S&P 500 futures contract has reached its pre-session high at the level of 2,098 - 10 points above yesterday's daily high). We lost 54.44 index points on that trade, betting against over two-month-long uptrend. It is always important to set some exit price level in case some events cause the price to move in the unlikely direction. Having safety measures in place helps limit potential losses while letting the gains grow. Currently, we prefer to be out of the market, avoiding low risk/reward ratio trades. We will let you know when we think it is safe to get back in the market.
Thank you.
Paul Rejczak
Stock Trading Strategist
Stock Trading Alerts

