
Briefly: In our opinion, no speculative positions are justified.
Our intraday outlook is now neutral, and our short-term outlook is neutral. Our medium-term outlook remains neutral, following S&P 500 index breakout above last year's all-time high:
Intraday outlook (next 24 hours): neutral
Short-term outlook (next 1-2 weeks): neutral
Medium-term outlook (next 1-3 months): neutral
Long-term outlook (next year): neutral
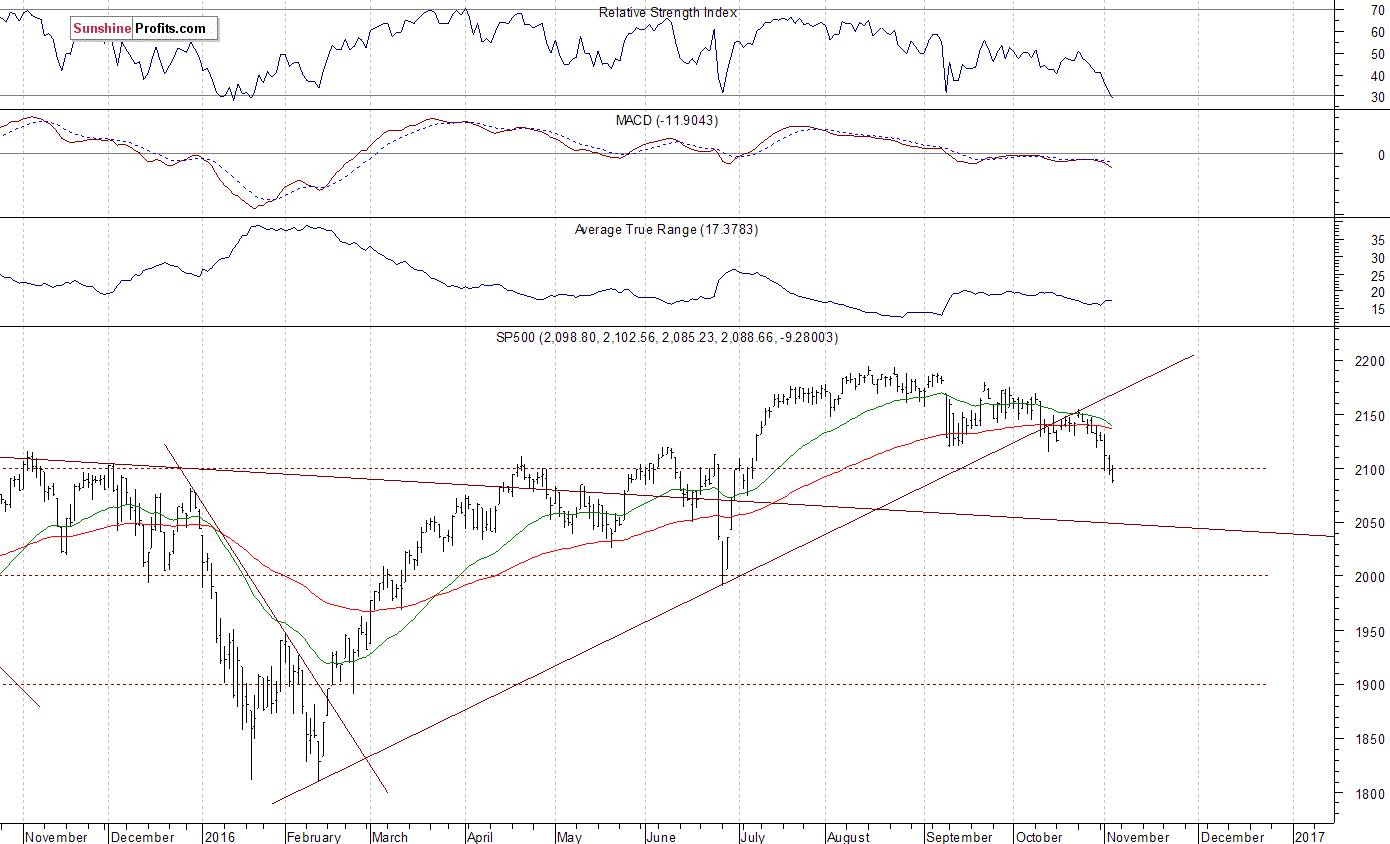
The main U.S. stock market indexes lost between 0.2% and 1.0% on Thursday, extending their short-term downtrend, as investors' sentiment further worsened following quarterly earnings releases, among others. The S&P 500 index broke below its September - October local lows on Tuesday. It is the lowest since early July. The nearest important support level is at around 2,075-2,090, marked by previous consolidation. The next important level of support is at 2,035-2,045, marked by the late June daily gap up. On the other hand, resistance level is at 2,110-2,120, and the next resistance level is at 2,150 marked by last month's local highs, as we can see on the daily chart:
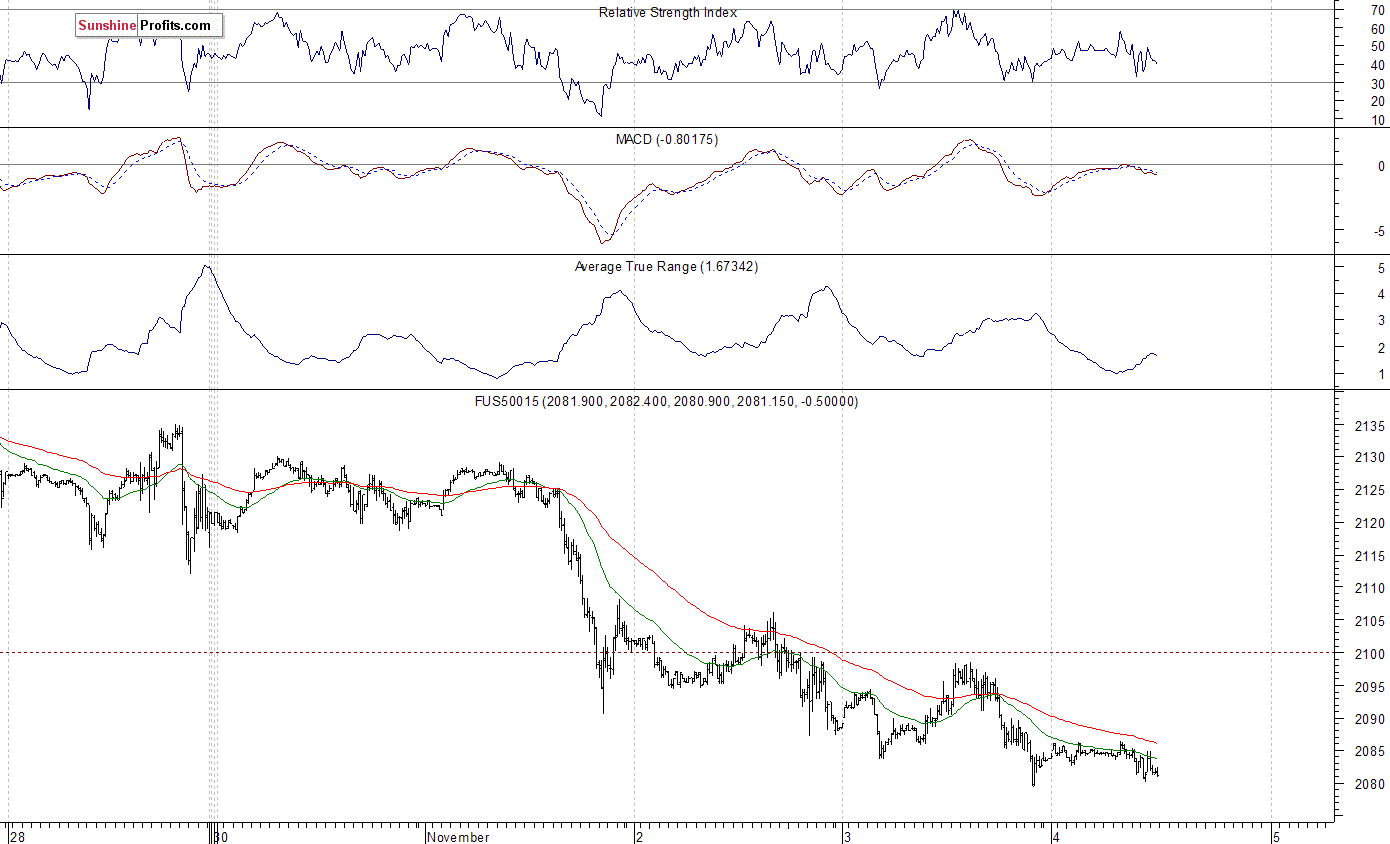
Expectations before the opening of today's trading session are slightly negative, with index futures currently down 0.1%. The European stock market indexes have lost 0.9-1.2% so far. Investors will now wait for some important economic data announcements: Nonfarm Payrolls, Unemployment Rate, Trade Balance at 8:30 a.m. The S&P 500 futures contract trades within an intraday consolidation, as it fluctuates along the level of 2,080. The nearest important level of resistance is at around 2,090-2,100, marked by previous support level. On the other hand, the nearest important support level is at 2,075-2,080. There have been no confirmed short-term positive signals so far. However, we can see short-term oversold conditions:
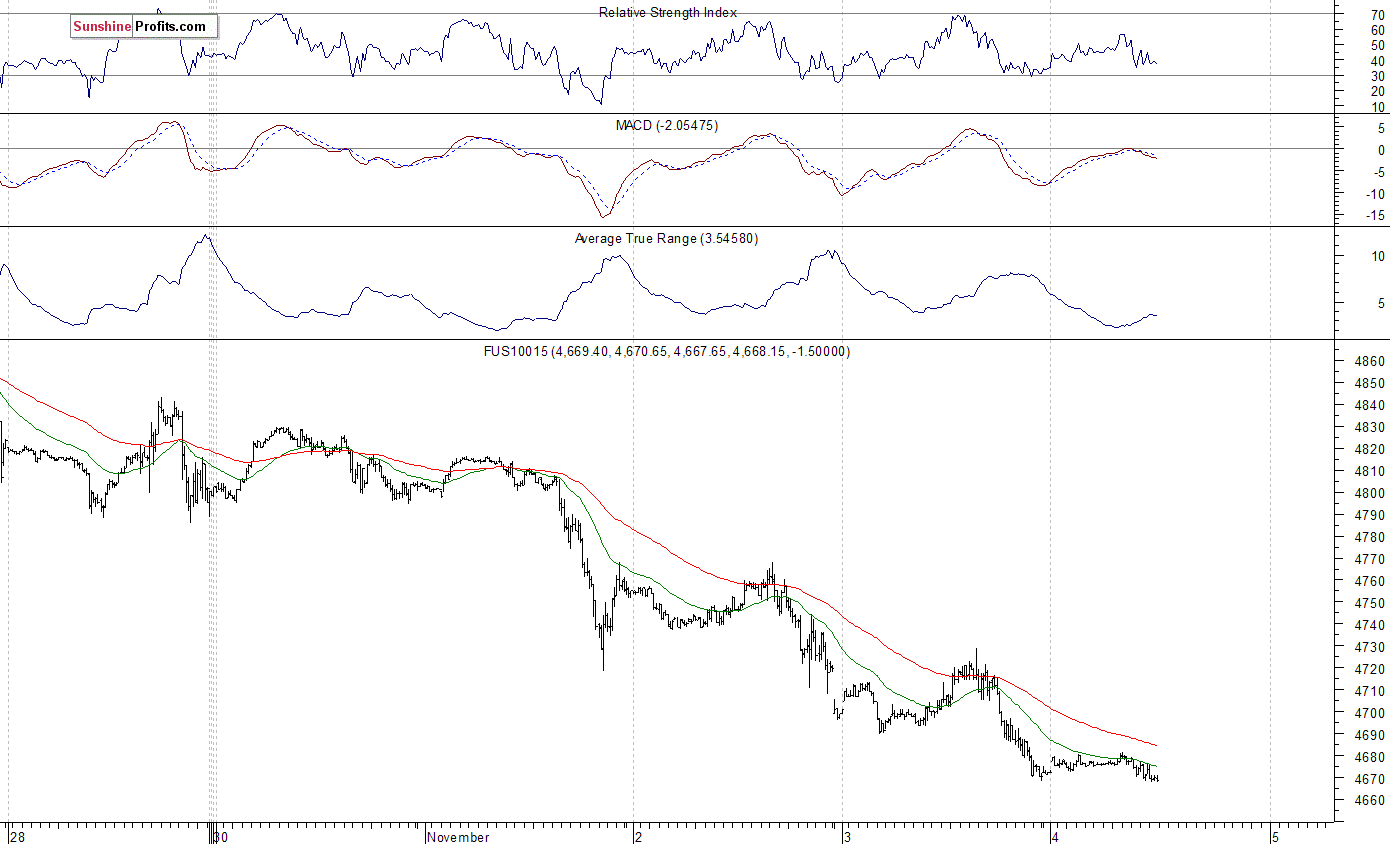
The technology Nasdaq 100 futures follows a similar path, as it currently trades within an intraday consolidation. It trades along the level of 4,670 following yesterday's sell-off. The nearest important level of resistance remains at 4,680-4,700, as the 15-minute chart shows:
Concluding, the broad stock market extended its short-term downtrend yesterday, as the S&P 500 index fell below 2,100 mark. There have been no confirmed positive signals so far. However, we can see some oversold conditions that may lead to an upward correction or downtrend reversal. Therefore, we decided to close our profitable short position (opened on July 18th at 2,162, S&P 500 index) at the opening of today's trading session - S&P 500 index. Currently, we prefer to be out of the market, avoiding low risk/reward ratio trades. We will let you know when we think it is safe to get back in the market.
Thank you.
Paul Rejczak
Stock Trading Strategist
Stock Trading Alerts

