

Briefly: In our opinion, no speculative positions are justified.
Our intraday outlook remains neutral, and our short-term outlook is neutral. Our medium-term outlook remains neutral, following S&P 500 index breakout above last year's all-time high:
Intraday outlook (next 24 hours): neutral
Short-term outlook (next 1-2 weeks): neutral
Medium-term outlook (next 1-3 months): neutral
Long-term outlook (next year): neutral
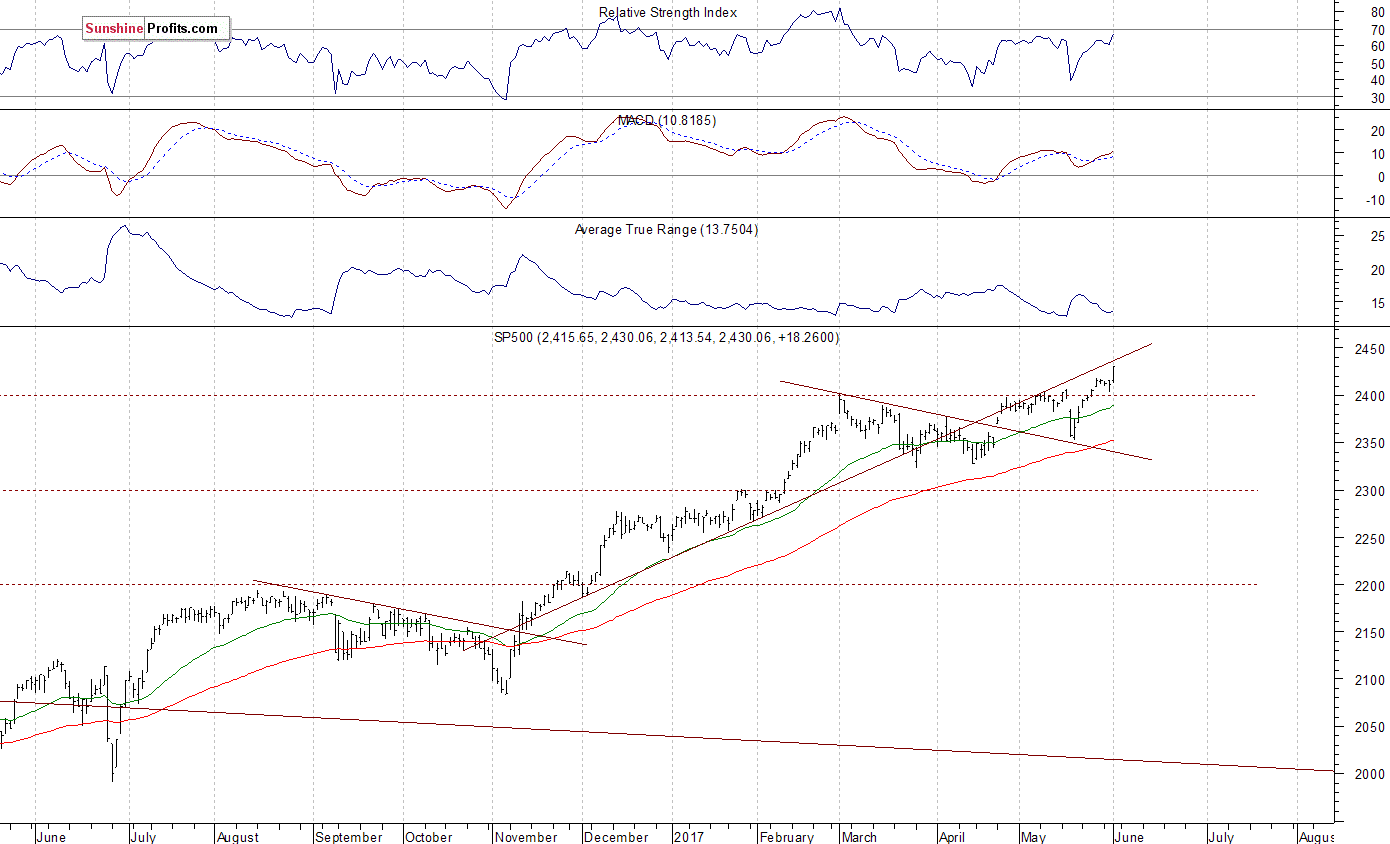
The main U.S. stock market indexes gained between 0.5% and 0.8% on Thursday, extending their recent move up, as investors reacted to better-than-expected economic data announcements, among others. The S&P 500 index has reached new all-time high at the level of 2,430.06, following a breakout above week-long consolidation above 2,400 mark. Stocks have rebounded strongly after their mid-May quick two-session sell-off. Then, they continued over eight-year-long bull market off 2009 lows. The Dow Jones Industrial Average remained above the level of 21,100 yesterday. However, it is still slightly below the March 1 all-time high of 21,169.1. The technology Nasdaq Composite reached new record high, as it extended its move up above the level of 6,200. The nearest important resistance level of the S&P 500 index is at around 2,430-2,450, marked by new record high, among others. On the other hand, support level is currently at around 2,415-2,420, marked by previous level of resistance. The next support level is at 2,400-2,410, marked by last Thursday's daily gap up of 2,405.58-2,408.01, among others. The support level is also at 2,390-2,395, marked by some short-term local lows. Will the uptrend continue towards 2,500 mark? There have been no confirmed negative signals so far. However, we can see some overbought conditions and negative technical divergences. The S&P 500 index continues to trade slightly below its November-April upward trend line, as we can see on the daily chart:
Bullish Expectations Ahead Of Monthly Jobs Data Release
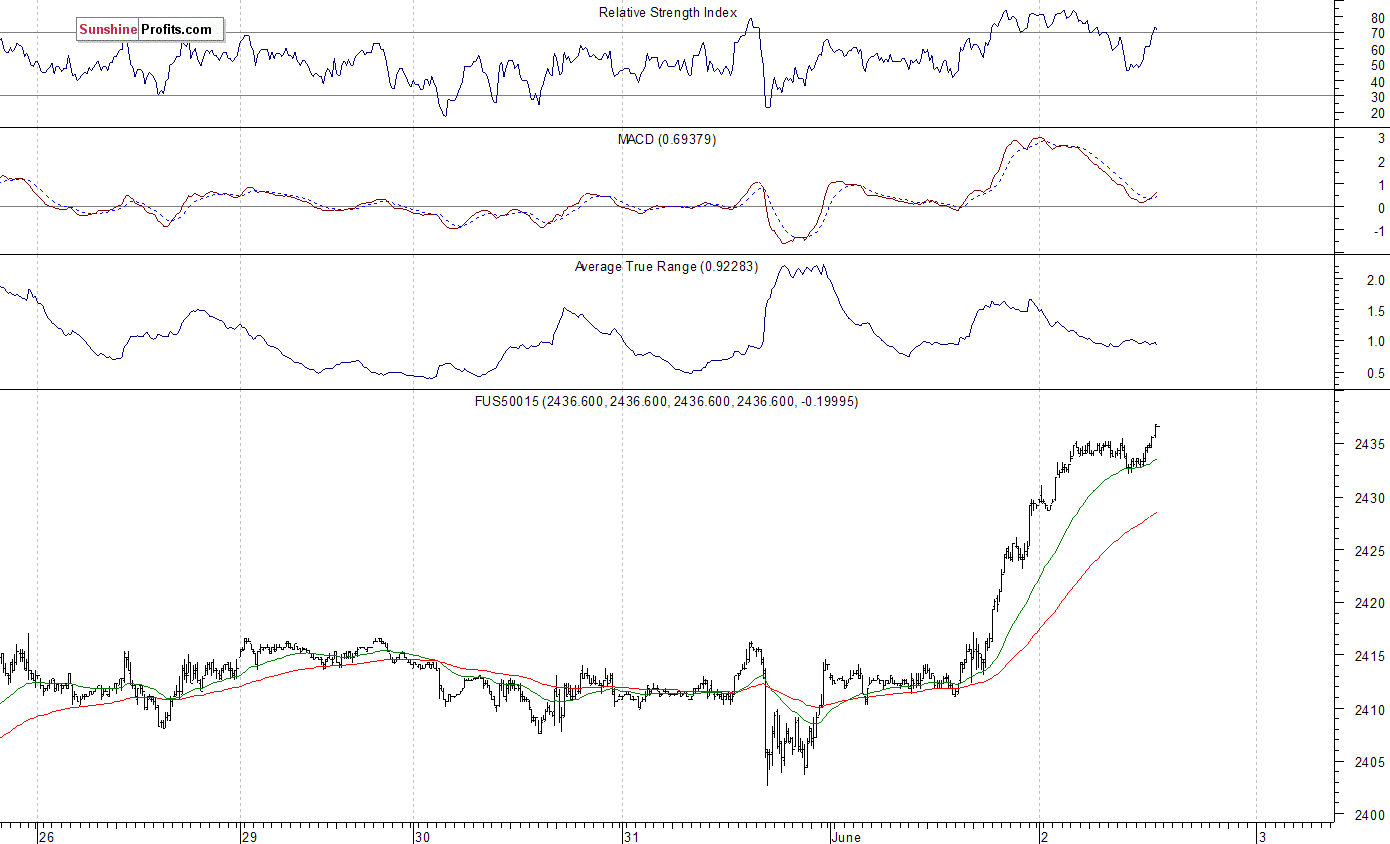
Expectations before the opening of today's trading session are very positive, with index futures currently up 0.3-0.5% vs. their Thursday's closing prices. The European stock market indexes have gained 0.4-1.5% so far. Investors will now wait for some important economic data announcements: Nonfarm Payrolls, Unemployment Rate, Trade Balance at 8:30 a.m. The market expects that the Nonfarm Payrolls were at 185,000, and Unemployment Rate was at 4.4% in May. The S&P 500 futures contract trades within an intraday consolidation, following an overnight advance. It has reached new record high above the level of 2,430. Potential resistance level is at around 2,450. On the other hand, the nearest important level of support is at 2,425-2,430, marked by some recent fluctuations. The next support level remains at 2,400-2,410. The market trades within a short-term uptrend, as it breaks above the early March local high. There have been no confirmed negative signals so far. However, we can see some short-term overbought conditions, along with negative technical divergences:
Technology Stocks Extend Their Rally
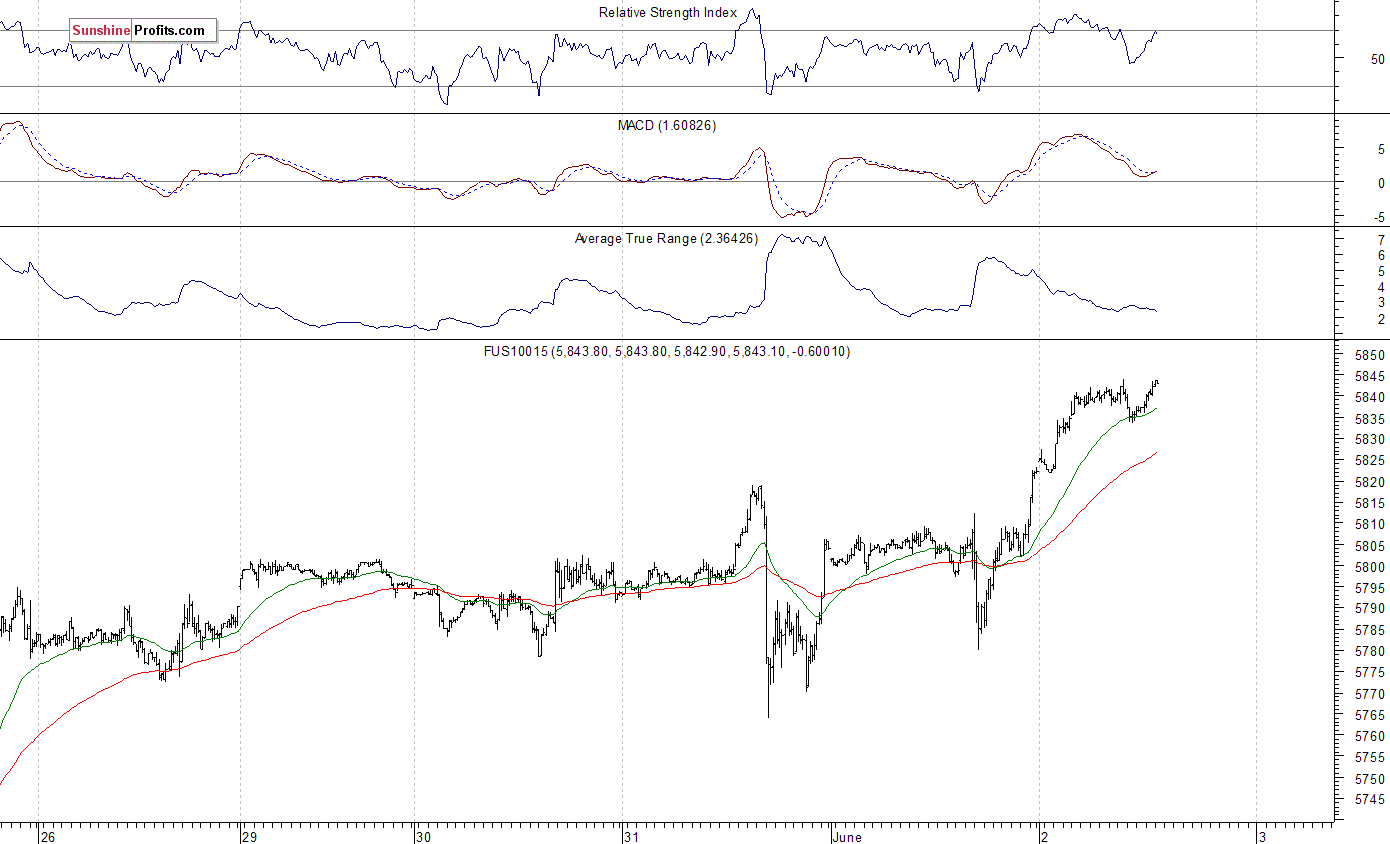
The technology Nasdaq 100 futures contract has reached new record high above the level of 5,840. The market extends its six-week-long rally following late April breakout above the level of 5,500. The nearest important level of resistance is at around 5,850, and potential resistance level is at 5,900-6,000. On the other hand, support level is at 5,800-5,820, marked by short-term consolidation. There have been no confirmed negative signals so far. But will technology stocks continue their rally despite some short-term overbought conditions? We can see some negative technical divergences:
Concluding, the S&P 500 index broke above its short-term consolidation yesterday, as investors' sentiment much improved following better-than-expected economic data announcements. The market continues its eight-year-long bull market. The index broke above three-month-long medium-term consolidation along the level of 2,400. But will the uptrend accelerate? Or is this some topping pattern before downward reversal? We still can see some negative medium-term technical divergences. However, there have been no confirmed negative signals so far.
Our speculative short position (opened on February 15 at 2,335.58 - opening price of the S&P 500 index) has been closed a week ago, on Thursday, at the stop-loss level of 2,410 - S&P 500 index, as the S&P 500 futures contract broke above the level of 2,407. We lost 74.42 index points on that trade, betting against over year-long medium-term uptrend off last year's February local low. It is always important to set some exit price level in case some events cause the price to move in the unlikely direction. Having safety measures in place helps limit potential losses while letting the gains grow. Currently, we prefer to be out of the market, avoiding low risk/reward ratio trades. We will let you know when we think it is safe to get back in the market.
To summarize: no speculative positions are justified from the risk/reward perspective at this moment.
Thank you.
Paul Rejczak
Stock Trading Strategist
Stock Trading Alerts

