

Monday gave us a fast snapback rally in the major US indices, with the S&P 500 adding 1.40% and erasing Friday’s losses. What’s on tap for the remainder of this week?
Good morning folks. Today we hear from Fed Chair Jerome Powell again at 2:00 PM, as he provides testimony on the Fed’s lending programs and policies. I am sure the market will be hanging on every word. However, what else could be said at this moment to either spook or encourage market participants? On Friday, the Fed’s Bullard talked about Q4 2022 for an initial hike and said that Chair Powell has already opened up talks of tapering. This commentary spooked the markets on Friday and led to the decline. But, we have already regained those losses (on Monday at least).
All of this hawkishness sure has moved the US Dollar to the upside. As I discussed in the May 19th publication, the $DXY had been approaching a key long-term Fibonacci retracement level before all of this hawkish talk even began. It never actually traded to it ($88.36); however, it got very close: around $89.60, and found support. Time will tell if the US dollar strength is sustainable. By looking at the technicals, it looks like it could be.
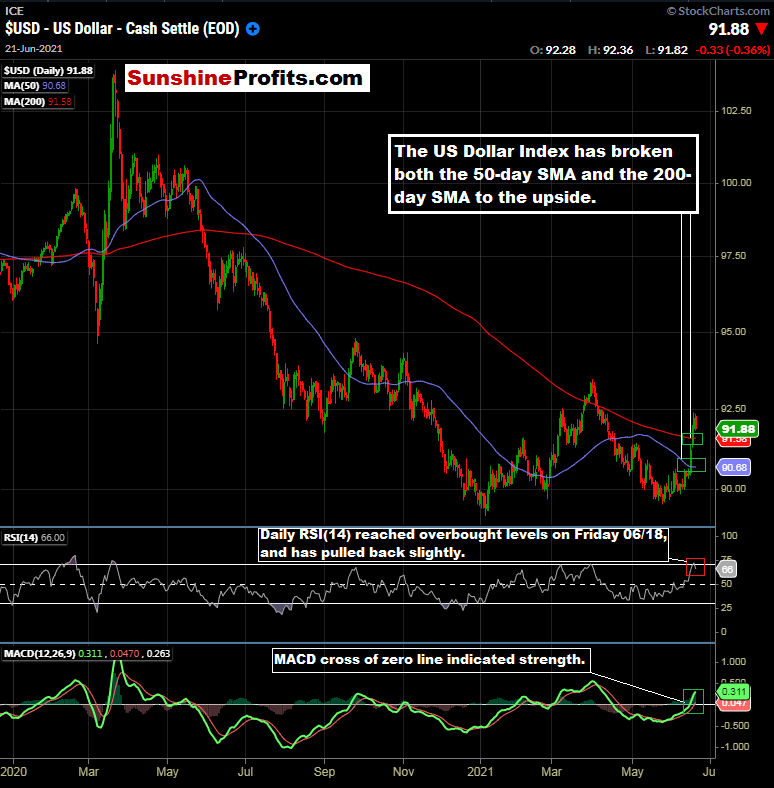
Figure 1 - US Dollar Index December 20, 2019 - June 21, 2021, Daily Candles Source stockcharts.com
We can see the breakout about the 50 and 200-day Simple Moving Averages. In addition, we have the MACD crossing the zero line to the upside. The next test of strength will be to see if the $DXY can hold its 200-day moving average on a test, which sits at 91.58 as of the close on June 21st.
Commodities, however, have broadly held their strength with the $DXY increasing. The big exception being interest-rate-sensitive precious metals. The general inflationary theme seems to be sticking right now.
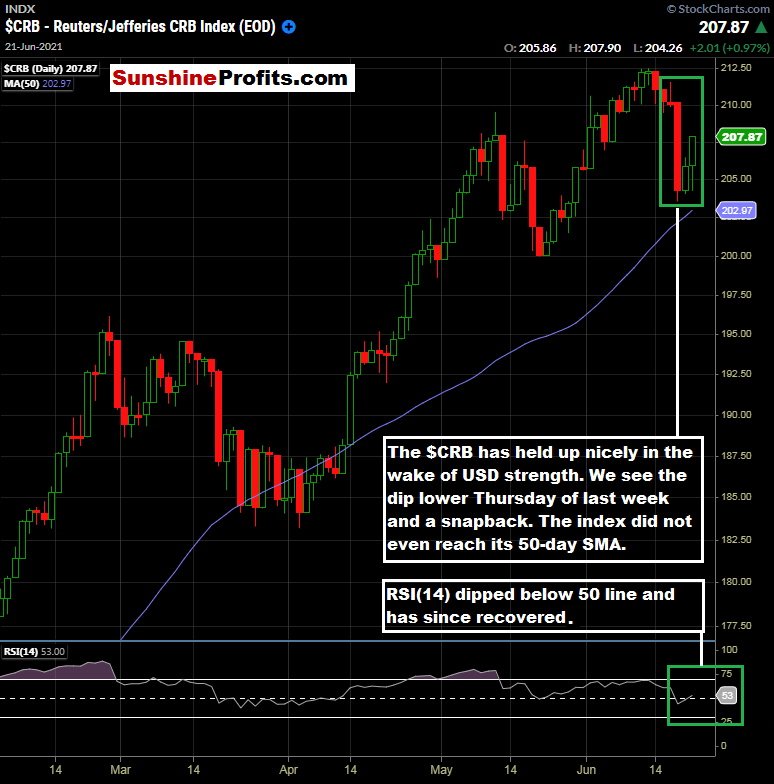
Figure 2 - $CRB Reuters/Jefferies CRB Index February 3, 2021 - June 21, 2021, Daily Candles Source stockcharts.com
Commodities are still firmly entrenched in an uptrend. It is an interesting phenomenon to see the US Dollar moving higher and commodities moving higher simultaneously. That could portend things to come in the future. Combined with higher rates, the overall market picture could change significantly over time in the long run. However, that’s a story for another time.
Instead of getting caught up in the longer-term picture for the markets, we want to stay focused and dialed in on the short and medium-term to capture potential opportunities. Based on the snapback that our subscribers were prepared for in the broader markets, we start to get a sense of how the market may react to the more hawkish Fed rhetoric in the short term.
Until things appear differently, buying the dips is still the higher probability move, in my opinion, especially in select names and themes.
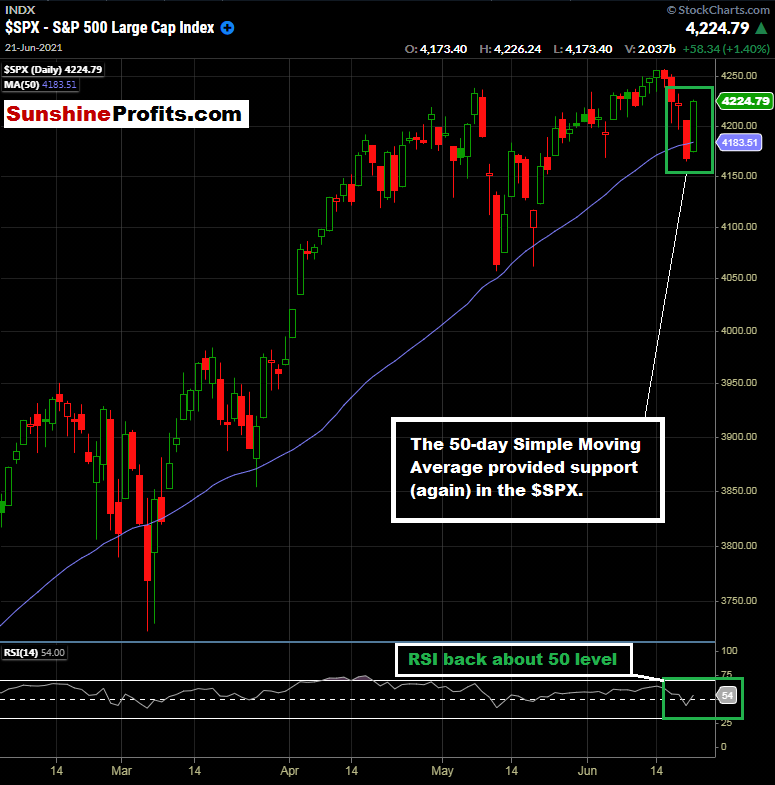
Figure 3 - S&P 500 Index February 3, 2021 - June 21, 2021, Daily Candles Source stockcharts.com
I want to emphasize the aforementioned select names and themes. A broader market rally like we saw yesterday is fantastic and was something that we were looking for based on a 50-day moving average pattern repetition. I think we can look to further stack the odds in our favor by drilling down to specific names, sectors, and stories.
Market Themes Change Over Time
Let’s not discount the fact that the Fed has changed its stance. Rates will most likely increase in the future. There should be some tapering coming soon, and tapering will not be instant; it is a process that occurs over many months or even over a year. These things will certainly impact overall market sentiment. Trading the S&P 500 via the ES, SPY, or $SPX (for equity options) is a solid strategy. However, I am beginning to realize the importance of individual names and themes in what could very soon be more of a stock pickers market versus a broader market story.
This is one reason I am currently covering nine markets for premium subscribers (S&P 500 and eight others). We just got great pullback action at the end of last week, and we were ready for it. Yesterday’s broader market action was just what we wanted to see.
Yesterday was an incredible day if you bought on Friday or in the morning yesterday. Many of the markets we are following touched and/or came very close to key levels.
Today we have the Fed again at 2:00 PM. I am wondering if he will be dishing out more hawkishness. I expect a quieter session today beforehand. Potential movement post 2:00 PM.
To sum up the current viewpoint and opinion:
I have BUY opinions for:
- iShares Trust Russell 2000 ETF (IWM) for an index reconstitution trade. At this time, I would be looking to be long and then exiting upon the actual reconstituted index going into place on June 28, 2021. Buy the rumor, sell the fact type of trade. Buy Pullbacks. For equity-bearish folks, see the IWM/SPY spread idea in the May 27th publication. Always use a stop loss level that caters to your individual risk tolerance. Update 06/22: this one is approaching our exit date of June 28th.
- Defiance Quantum ETF (QTUM) between $44.00 - $49.50. Update 06/17: QTUM closed at $49.08 on Wednesday. In case you missed this one, I think there is still time to get on board and will raise the buy idea zone to $44.00 - $49.50. It looks like it wants to break out of its range soon, but could find some sellers at the psychologically important $50 level. Update 06/22: I think there is still time to get on board here under $48.50 if AI and automation appeals to you. Always use a stop loss level that caters to your individual risk tolerance.
- Amplify Transformational Data Sharing ETF (BLOK) between the 200-day moving average and $40.00 200-Day Moving Average is currently $39.70 (06/17). BLOK has a history of high volatility, so proceed with caution. Always use a stop loss level that caters to your individual risk tolerance. Update 06/17: Patience still. I want to jump on board, but prefer to see how Bitcoin negotiates the $40,000 level. Wait for $40.00 to the 200-Day moving average. It could happen soon. Monitoring. Update 06/22: Crypto has been getting crushed hard yesterday and overnight. I am sticking to my guns and waiting for the 200-day moving average (currently $40.01). Always use a stop loss level that caters to your individual risk tolerance.
- Invesco MSCI Sustainable Future ETF (ERTH) between $67.76 - $70.82. Always use a stop loss level that caters to your individual risk tolerance. Update 06/17: ERTH closed in the green @ $75.74 on Wednesday bucking the overall market trend on FOMC day. This is a great sign. Hold longs. Chugging along. If you missed this one, let’s see if we can get a pullback to the 50-day moving average, which currently sits at $74.00. (This happened on Wednesday briefly, I hope you caught it if you are not on board yet!) I am liking this one more and more for a long-term holding and will be willing to hold through short-term pullbacks at this time. Update 06/22: Important note on ERTH: This one had me scratching my head on the open yesterday and then I quickly discovered that there had been a $9.95 dividend issued. You can read about the dividend on Invesco’s website here. Call your broker if you have any questions about how the dividend was applied to your account. This dividend was abnormally high for ERTH based on the past. Since $9.95 came out of the stock price in the form of a dividend, we must adjust our pricing outlook by $9.95. I like this name for the longer-term around $65-$65.80 (dividend adjust price) at this time. Always use a stop loss level that caters to your individual risk tolerance.
- Invesco Exchange-Traded Fund Trust - S&P SmallCap 600 Pure Value ETF (RZV) at the 50-day moving average. Patience and wait for the pullback. Always use a stop loss level that caters to your individual risk tolerance. Update 06/17: RZV 50-day MA is 92.67 as of the close Wednesday. Monitoring. This one bucked the downtrend on Wednesday too and finished higher. Update 06/22: This one touched the 50-day MA on Friday (we were waiting for that!) and tacked on 2.51% in yesterday’s session. If you didn’t catch the big pullback, look to enter on any pullback from $93 - $94.90. Always use a stop loss level that caters to your individual risk tolerance.
- iShares Global Timber & Forestry ETF (WOOD) Initial buy idea zone between $79.07 and the 200-day moving average ($79.82 as of 06/16 close). Update 06/16: Given the price action in the lumber futures described in today’s alert, consider an entry into ½ of a normal position size between $86.50 - $87.50. Should it pull back further, we can look to add another ½ position size. Update 06/17: WOOD provided the entry opportunity levels that we were looking for on Wednesday and even finished higher on the day. What a great sign. Look to be long on this underappreciated ETF. Update 06/21: WOOD traded through our first tranche level between $86.50 and $87.50. It closed Friday @ $84.15. I am looking at the above-mentioned price levels between $79.16 and $79.82 - $80.00 for the second tranche. See Above. Update 06/22: Wood tacked on 2.33% yesterday. Hold longs and look to add between $79.16 - $80.00. Always use a stop loss level that caters to your individual risk tolerance.
- Invesco Solar ETF (TAN) between the 50-day moving average ($80.32 as of June 14th) and $81.50. Look for an intraday pullback for entry. Update 06/16: We wanted a pullback, and we got a big one on Tuesday, with the range being $78.00 - $80.69. Ideally, this was taken advantage of on this pre-Fed meeting day. There could have been some “sell the news” price action with the SEIA report being released yesterday. Although we are below the 50-day MA, I like the previous consolidation and would look to be long at these levels. Update 06/17: TAN tacked on 1.51% in Wednesday’s overall down session. Great sign. I like this one and I think there is still time to get on board. Always use a stop loss level that caters to your individual risk tolerance. Update 06/21: We really nailed this entry and I am looking for continued upside. I think there is still time to get on board - look for pullbacks near the $81.00 level. I like this for a longer-term holding with price appreciation potential north of $100.00. Update 06/22: I think there is still time to get on board: look for pullbacks approaching the 50-day SMA of $79.75 - $81.00 for long entries. I like this one for a longer term move above $100.00. Always use a stop loss level that caters to your individual risk tolerance.
- First Trust NASDAQ Clean Edge Smart Grid Infrastructure Index Fund (GRID). GRID has traded through our idea range of between $86.91 and $88.17. Update 06/17: GRID closed at $91.50 yesterday, moving lower on the overall down day. I see no major technical damage and like this one over the longer run. Opinion: hold existing longs and.or look for entries on pullbacks. Update 06/22: Another one that briefly touched the 50-day SMA. Did you get it? If not I like it anywhere below $91 - look to enter on pullbacks. I am looking for $100 level or maybe higher in the longer-term. Always use a stop loss level that caters to your individual risk tolerance.
I have SELL opinions for:
NONE
I have a HOLD opinion for:
- SPDR S&P 500 ETF (SPY) between $412.26-$413.10 (61.8% Fibonacci retracement level) and the 50-day moving average ($416.90 as of the close on June 15th). Always use a stop loss level that caters to your individual risk tolerance. Update 06/17: Be alert SPY traders, you may get your chance this week. Update 06/22: the 50-day SMA came and went quickly. Hopeful you got it Friday or Yesterday! Right now, holding longs seems prudent with a target of $425 or a 70 Daily RSI (whichever comes first) Always use a stop loss level that caters to your individual risk tolerance.
Thanks for reading today’s Stock Trading Alert. Have a great day!
Thank you,
Rafael Zorabedian
Stock Trading Strategist

