

Briefly:
Intraday trade: The S&P 500 index gained 0.4% on Monday, after opening 0.4% higher. The broad stock market will probably open lower today. We may see more short-term uncertainty, as the index remains relatively close to its record high. We prefer to be out of the market, avoiding low risk/reward ratio trades.
Trading position (short-term; our opinion): no short-term positions are justified from the risk/reward perspective.
Our intraday outlook is neutral. Our short-term outlook is neutral, and our medium-term outlook is neutral:
Intraday outlook (next 24 hours): neutral
Short-term outlook (next 1-2 weeks): neutral
Medium-term outlook (next 1-3 months): neutral
The U.S. stock market indexes were mixed between -0.1% and +0.7% on Monday, as investors hesitated following the recent advance. The S&P 500 index has reached the new record high of 2,940.91 on September the 21st. It currently trades just 0.6% below that high. The Dow Jones Industrial Average gained 0.7% and the technology Nasdaq Composite lost 0.1% yesterday.
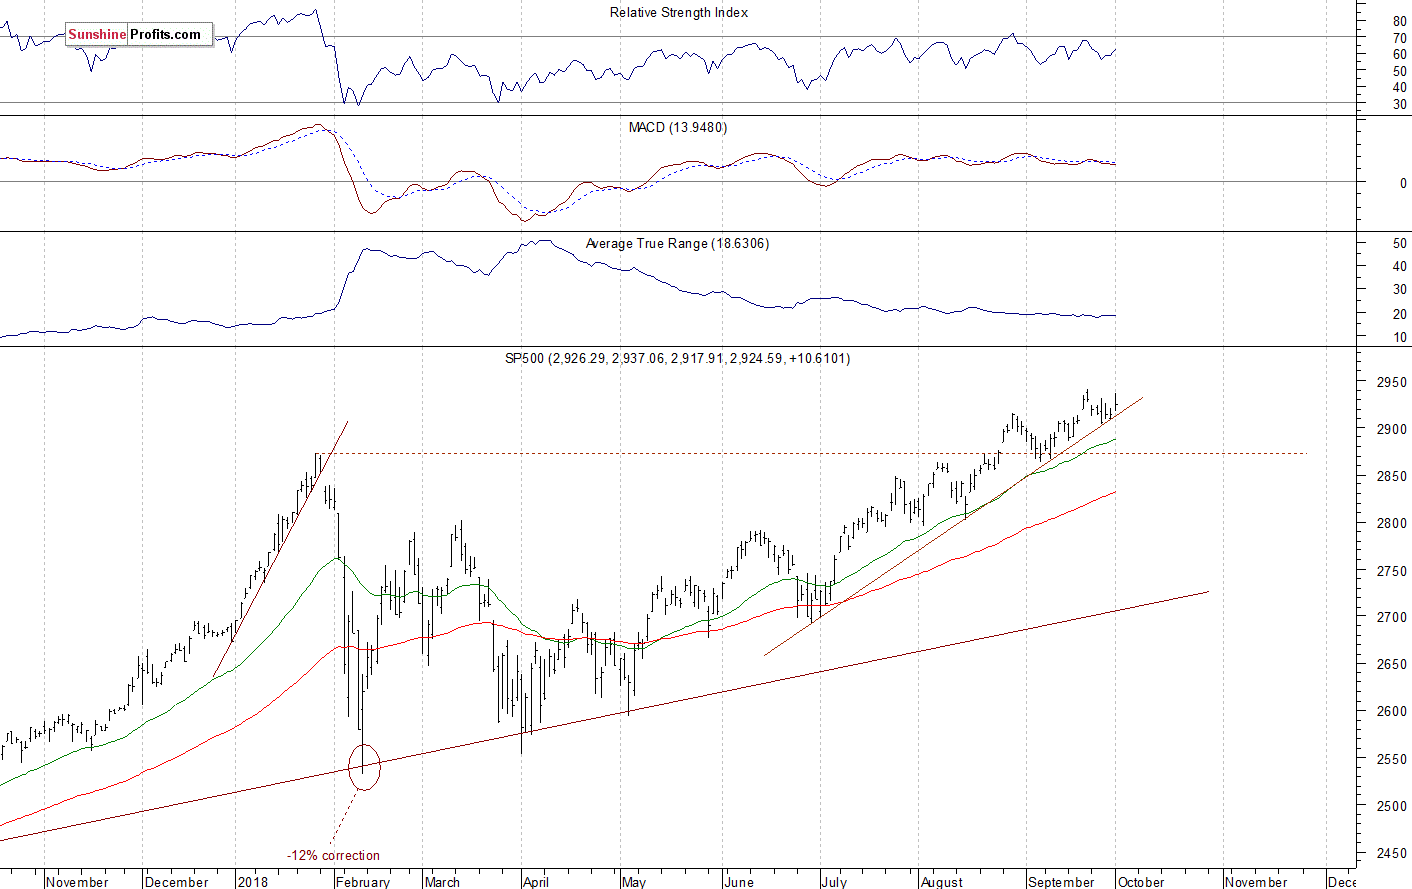
The nearest important level of support of the S&P 500 index is now at around 2,915-2,920, marked by the recent consolidation. The next support level is at 2,900. The support level is also at 2,885-2,890. On the other hand, the nearest important level of resistance remains at around 2,925-2,930, marked by the last week's Monday's daily gap down of 2,923.79-2,927.11. The resistance level is also at 2,940, marked by the record high.
The broad stock market reached the new record high recently, as the S&P 500 index extended its short-term uptrend above the level of 2,900. Will it continue higher despite some short-term technical overbought conditions? The index keeps bouncing off its three-month-long upward trend line following last Wednesday's intraday reversal, as we can see on the daily chart:
Slightly Negative Expectations
Expectations before the opening of today's trading session are slightly negative, because the index futures contracts trade 0.2-0.3% below their yesterday's closing prices. The European stock market indexes have lost 0.4-0.8% so far. There will be no new important economic data announcements today. The broad stock market will likely extend its short-term fluctuations after the recent record-breaking advance. Will the index break above the mentioned September's record high? It's hard to say. If it breaks higher, we could see more buying pressure. There have been no confirmed negative signals so far.
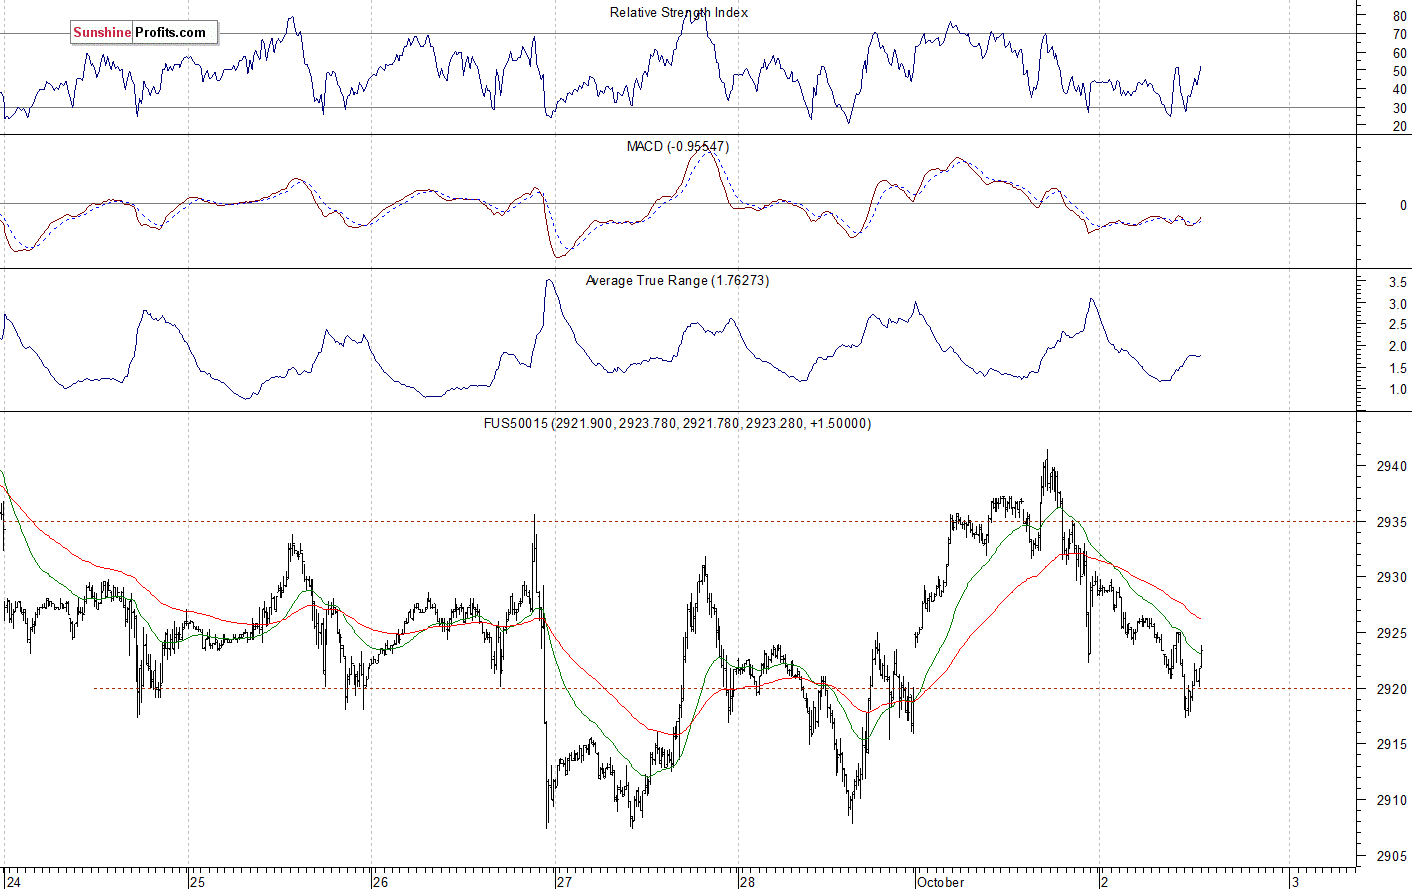
The S&P 500 futures contract trades within an intraday downtrend, as it retraces its yesterday's advance. The nearest important level of resistance remains at around 2,940-2,945, marked by the record high. On the other hand, the support level is at 2,910-2,920, marked by some recent fluctuations. The support level is also at 2,900-2,905, among others. The futures contract extends its short-term consolidation, as we can see on the 15-minute chart:
Nasdaq Also Lower
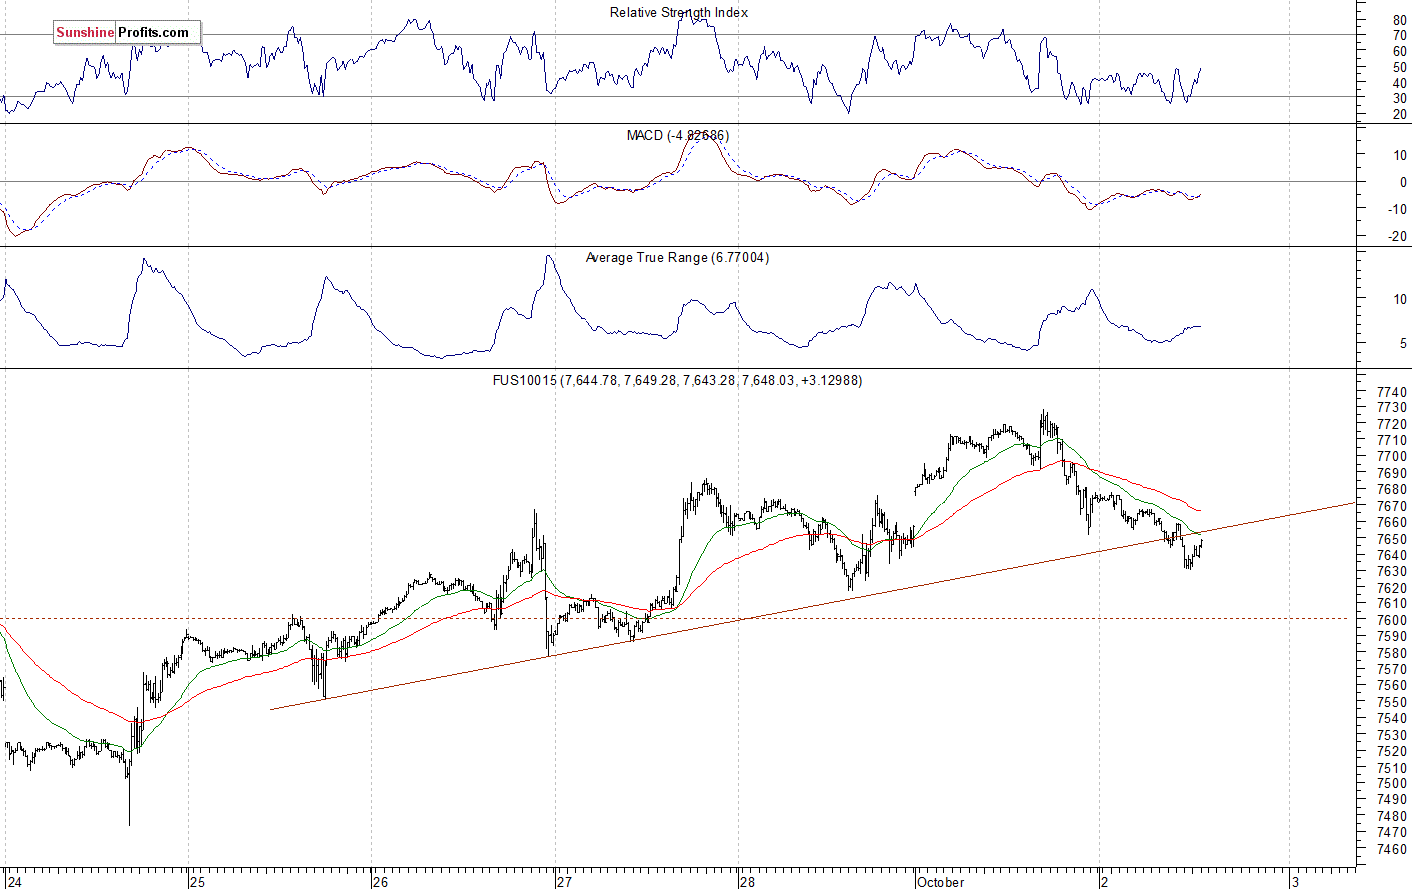
The technology Nasdaq 100 futures contract follows a similar path, as it retraces its yesterday's record-breaking rally. The tech stocks' gauge broke above the level of 7,700, and it reached the new record high of around 7,729, before reversing lower The nearest important support level is now at 7,600-7,620. On the other hand, level of resistance is at 7,680-7,700, among others. The Nasdaq futures contract broke slightly below its recent upward trend line, as the 15-minute chart shows:
Apple, Amazon - Closer to Record Highs, but..
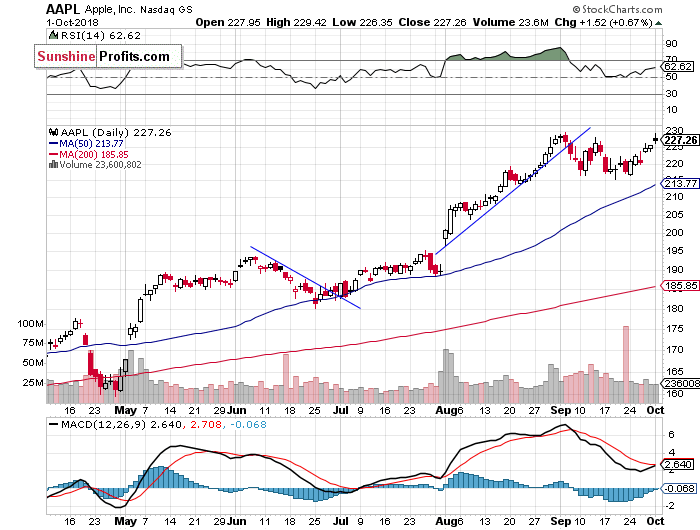
Let's take a look at Apple, Inc. stock (AAPL) daily chart (chart courtesy of http://stockcharts.com). It reached the new record high at the level of $229.67 a month ago, before reversing lower. Then it broke below its month-long upward trend line. The resistance level remains at $225-230. On the other hand, the support level is at $215. Now, the stock is advancing towards its record high, but we can see some short-term negative technical divergences:
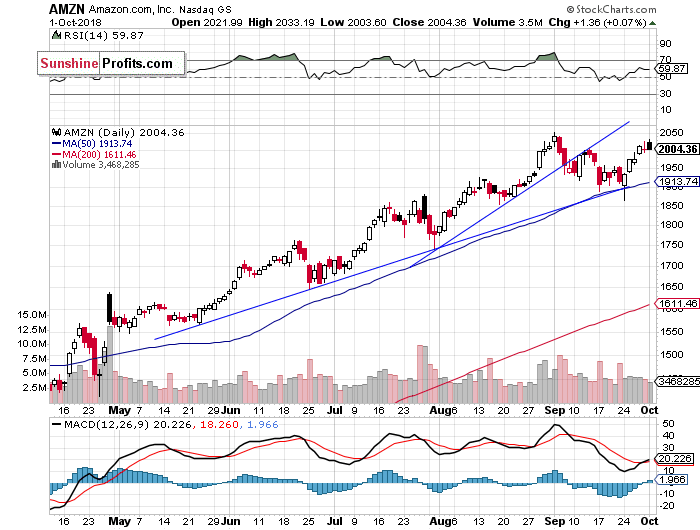
Now let's take a look at Amazon.com, Inc. stock (AMZN) daily chart. It has reached the new record high at the price of $2,050.50 in the early September. Since then it was retracing its record-breaking rally. The stock broke below the month-long upward trend line but it bounced off its medium-term upward trend line, and now it is slightly above the price of $2,000 again:
Dow Jones Higher Again
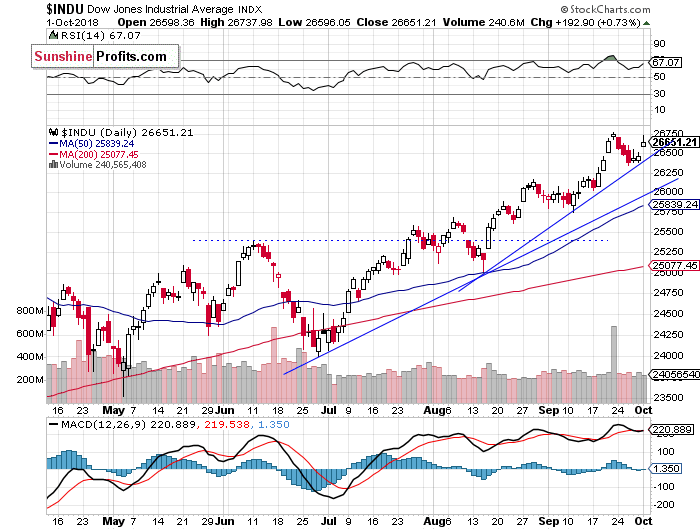
The Dow Jones Industrial Average reached the new all-time high at the level of 26,769.16 recently. Since then it was retracing that advance. It broke below the support of around 26,500 last week, but it continued to trade above the upward trend line. Yesterday, it bounced off that trend line. For now, it looks like a consolidation following the September rally:
The S&P 500 index got closer to its late September record high yesterday, but it failed to remain above the level of 2,930. The broad stock market continues to fluctuate following its September advance. Will stocks go higher at some point? For now, it looks like a relatively flat correction within a medium-term advance, because the index continues to trade above its upward trend line.
Concluding, the S&P 500 index will probably open lower today. The market trades just 0.6% below its September the 21st high of 2,940.91, so it looks like a relatively flat correction within an uptrend. There have been no confirmed medium-term negative signals so far. But if the index breaks below the mentioned trend line, we could see some more meaningful downward reversal.
Intraday trade:
No intraday position is justified from the risk/reward perspective today.
Trading position (short-term; our opinion): no short-term positions are justified from the risk/reward perspective.
Thank you.
Paul Rejczak
Stock Trading Strategist
Stock Trading Alerts

