

Trading position (short-term; our opinion): short positions (100% position size) with stop-loss at 3140 and initial downside target at 2990 are justified from the risk-reward perspective.
Stocks made quite a move out of the 5-day long congestion yesterday - is the downside move drawing to a close? I don't think so yet, and today's analysis will discuss quite a few reasons why. As for the battle of narratives, the corona fears are gaining the upper hand over the recovery focus currently, which highlights the S&P 500 downside potential in the short-term. Will stocks follow through on the many cues?
And how will the market take to the incoming unemployment claims? I think they would not bring about a bullish surprise, and will likely prove to be a catalyst of selling pressure during the regular U.S. market hours.
S&P 500 in the Short-Run
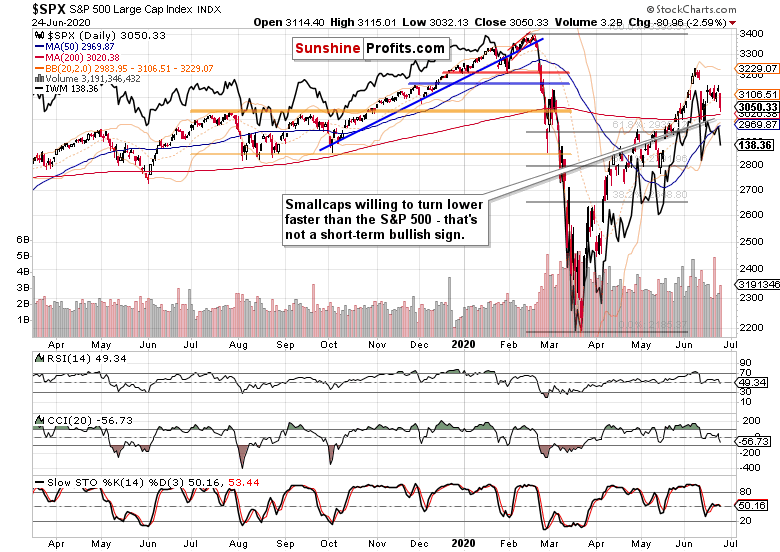
Let's start with the daily chart perspective (charts courtesy of http://stockcharts.com ):
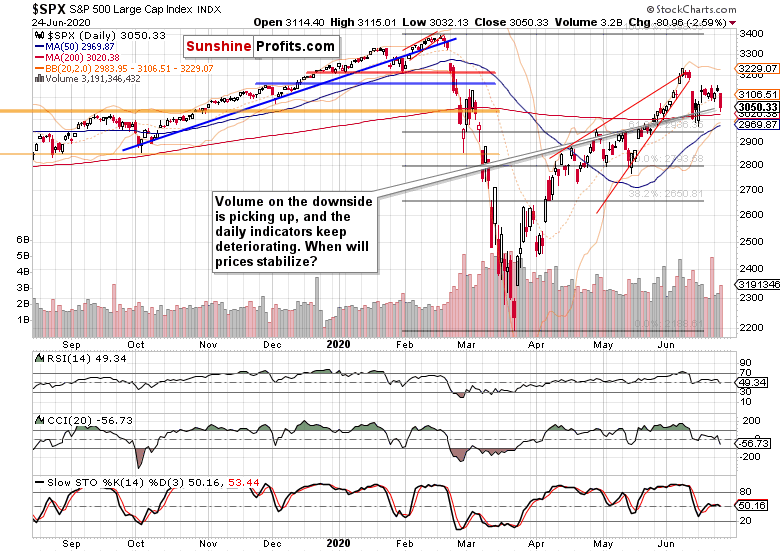
Wednesday's trading resolved the tight consolidation of recent days, and it was to the downside. Volume has picked up, and prices closing near the daily lows lend credibility to the move. So do the deteriorating daily indicators - while it's not unimaginable to see them stabilize for a few sessions, such behavior would only make the next bear raid likely.
Yes, the short-term balance of forces is moving over to the bears' side - just as the reactional sensitivity to narratives.
My yesterday's view of them remains valid also today:
(...) Yes, tensions are running high, and stocks have so far rebounded each time. But we all feel that the headline risk in this data-light week is skewed rather to the downside. Raise your hands if you expect another stimulus this week. That's it.
What are the credit markets saying this moment?
The Credit Markets' Point of View
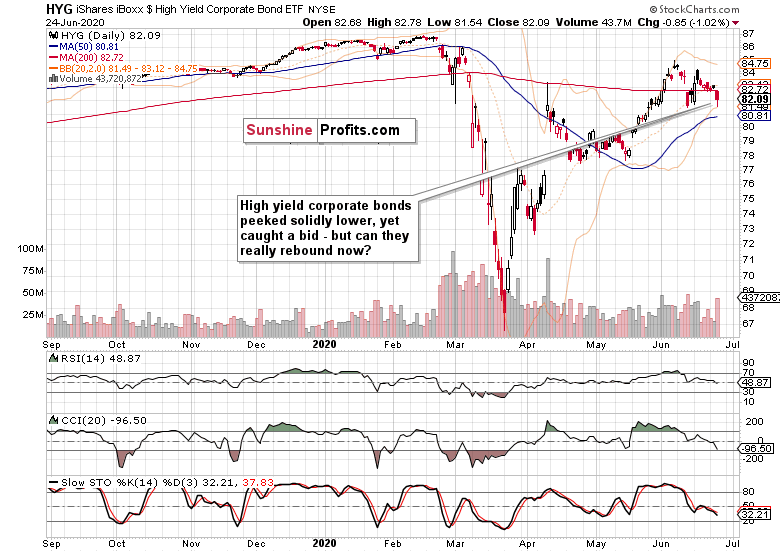
High yield corporate bonds (HYG ETF) took a plunge yesterday, but managed to crawl higher from the intraday lows. Will the high volume of yesterday's session (i.e. increased selling interest) overpower those who decided to step in at those prices? I think the credit markets have the potential to extend the move lower, especially should that push happen during the nearest sessions.
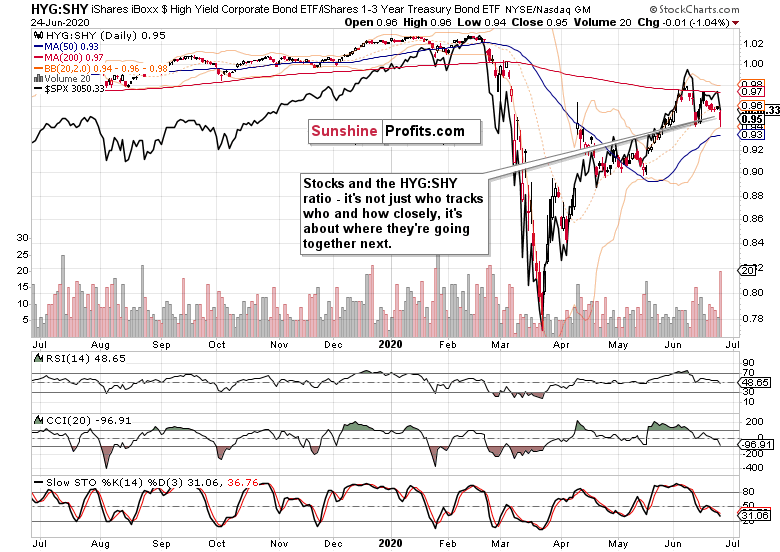
The S&P 500 and the high yield corporate bonds to short-term Treasuries ratio (HYG:SHY) are trading more closely aligned now, relatively speaking. But this is not about the short-term red flag through extension - it's now where both of them would go next. The swing structure and unwillingness of stocks to outperform, favors the bears.
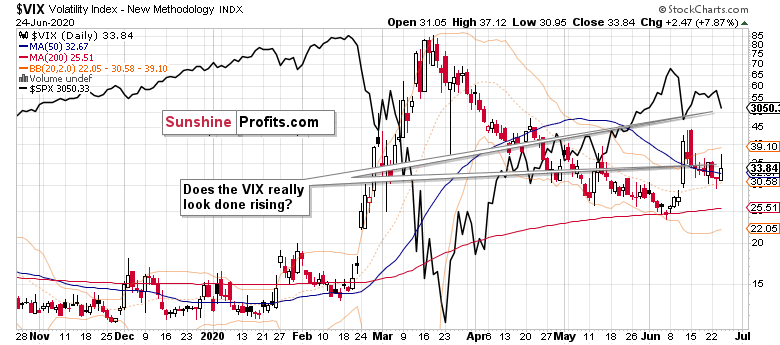
To me, volatility doesn't look finished rising just yet. I think that yesterday's upper knot will be overcome on an intraday basis at least, before this metric gets a chance to calm down again.
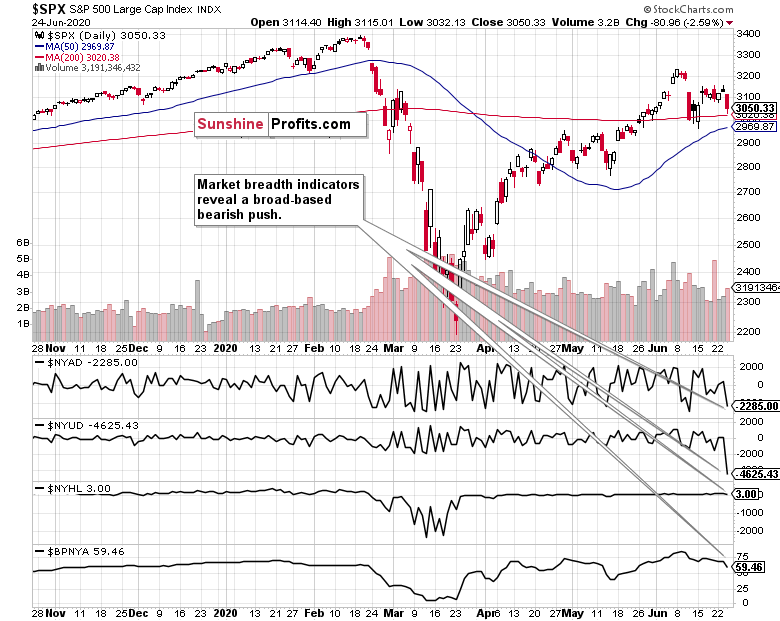
The market breadth indicators have short-term flipped to the bearish side, and the declining bullish percent index is telling me that the slide might not yet be quite over. We are transitioning to a more risk-off period now, especially given the USDX refusing to budge much, and actually building bullish short-term divergences.
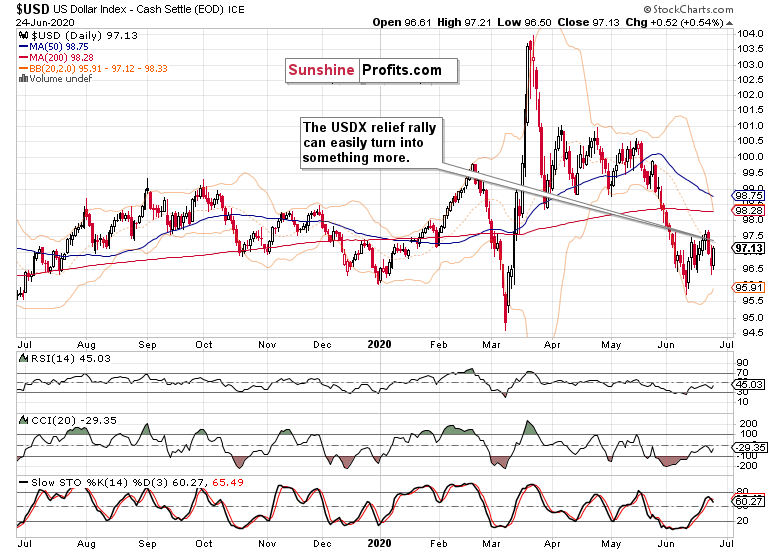
Since mid-Feb, the USD Index has been steadily declining for 3 weeks, and that's almost what we've recently seen too. The mighty greenback might be on the verge of rising some more - take a look at the chart below. Whiff of deflation, anyone?
Key S&P 500 Sectors in Focus
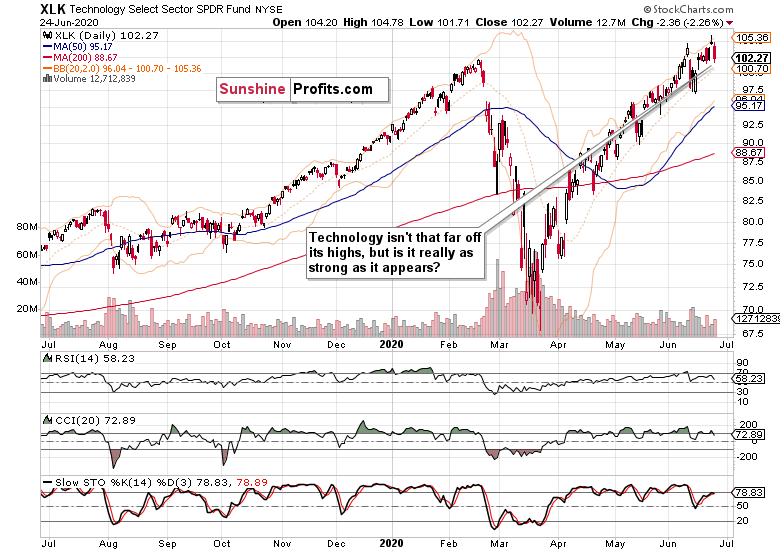
Technology (XLK ETF) keeps hanging quite close to its recent highs, so its yesterday's plunge might not seem that concerning given the swing structure. But its daily indicators spell caution as they look to be forming bearish divergences. Forming is the key word here - they're not finished yet.
But where to look for more clues? Enter semiconductors.
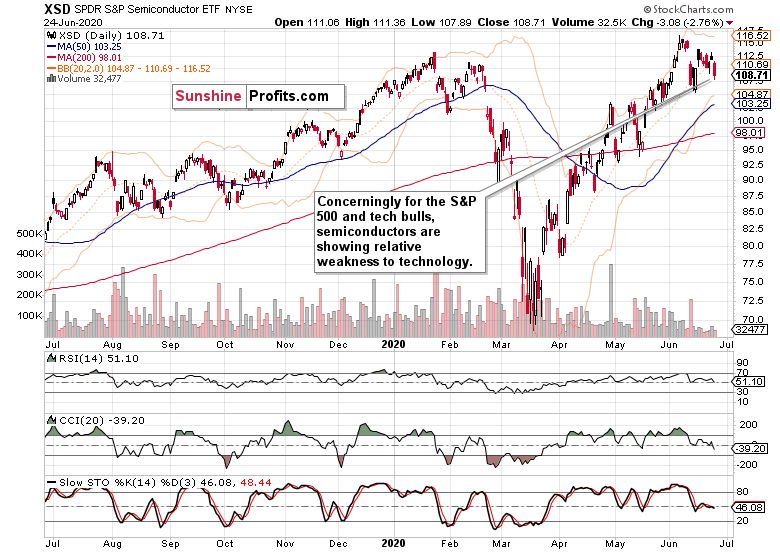
Where technology goes, the index goes. And for technology, semiconductors (XSD ETF) are playing that role. The picture they're painting, is not a short-term bullish one - compare the swing structure of both tech and semiconductors, and you'll see that this leading segment of tech is acting relatively weak now.
That's one more factor in support of the bearish short-term outlook - just as the Russell 2000 (IWM ETF) relative weakness shown below is.
From the Readers' Mailbag
Q: Within the June 11th drop, you can see the angle that is being proposed by the market that is being reproduced today. My current understanding is that we are following the patterns close to the start of a bear market and we are finishing the second part this week.
And what about all red candles in last two weeks - they are of such a fat volume. Doesn't that stink of distribution to you? Oh I forgot, in the long run stonks are bound to rise.
A: The lessons you derive from the angle, is what I arrive at by looking at momentum, candlestick shape and volume. I agree that the short-term horizon has darkened for stocks with yesterday's action, and also agree that the beginnings of selling episodes (bear markets) do come in fits and starts.
Over a longer period of time, the recent volume spikes tell their story, and it's increasingly becoming one of selling into strength. Price recoveries on low volume, are best viewed with suspicion - unless they get a bullish follow through, which just didn't come this week
Q: Fundamental analysis market index S&P500 P/E is currently just under 22, above the LT average of 16. Even with zero ST interest rates, given an expected decline in earnings, the index P/E will continue to rise and then sell off until "fair value" is reached. Fair value could result in a S&P 500 value of 2100-2700, depending on actual earnings and PE.
A: The problem with P/E ratios is, that they are a tool for long-term decision making. The fact that a market is relatively expensive at one moment, doesn't mean that it can't get more expensive a month or a quarter down the road. I don't talk bubbles here, it's just what the market place deems an appropriate valuation given the prevailing circumstances.
Talking bubbles, they can go on longer than most people think - who thought the Dot-Com bubble would burst that late? Or the housing one when anyone being with a pulse, would be eligible for buying a house, 0% money down?
It can take a long time for any bubble to burst, and while living in the era of universal bullishness, pay attention to the white elephants (e.g. tallest skyscrapers, outrageous IPOs) that make you go hmmm. Just sharing timeless wisdom that can be viewed as analogical to why the gold price isn't tracking the money aggregates in circulation...
Q: If asset prices go up, but the cash flows they represent goes down, wouldn't that lead to indifference between the assets and the dollars. The yield are way too low on bonds for anyone to buy except those in the captive market. No one in their right mind thinks inflation will be low enough that yield in bonds or stocks makes any sense. That captive market is huge though. All those countries with trade surpluses, banks, pension funds, ect. looking for safety, but is it actually safe now? If I were a European banker I would probably rather just invest in my home country where I felt I understood the situation better.
A: Yes, the captive market is indeed huge, and corralling is what makes financial repression so efficient. It works by pushing people and institutions farther on the yield curve, This helps support riskier assets (think TINA), and keeping yields artificially low facilitates capital misallocation and zombification of the real economy, decreasing its long-term growth potential.
Q: I bought long puts and didn't try to go long as you did. Never thought a put 4 months away would yield almost 30% profit on a moderate asset plunge. Didn't close it yet, though.
A: That's the world of options, where you consider time decay and volatility - and the volatility projections are working for you nicely. With your time horizon as far as I gather, your pleasant issue would be when to cash in profits. I merely played the possibility for an overnight rebound yesterday, and closed at B/E - that's how it goes with taking momentum / breakout trades. There are many of them, and careful risk management is a must in order to enjoy the profitable opportunities to ride a larger move when it unfolds.
I believe in diversification, the greatest edge - and within one market, that calls for various trading techniques. Trend plays are great to play when we have a trend, but supplementing it with other styles helps improve the equity curve (smaller drawdowns, less volatility of returns).
Summary
Summing up, the risk-off sentiment made a powerful entry on the stage yesterday, tipping the balance of short-term forces towards the bears. The relative resiliency of the credit markets appears likely to be overpowered by the deteriorating S&P 500 market breadth, precarious position of the tech sector with regard to semiconductors, or the plain unwillingness of stocks to outperform the HYG:SHY ratio - not to mention the bearish daily indicator signals the index is sending. The corona fears narrative is rearing its head increasingly more, which presents a clear downside risk for stocks, which are led lower by the Russell 2000, and also helped by oil.
The prospect of a more bumpier ride ahead for the bulls over the summer, clearly remains on.
Thank you.
Trading position (short-term; our opinion): short positions (100% position size) with stop-loss at 3140 and initial downside target at 2990 are justified from the risk-reward perspective.
Thank you.
Monica Kingsley
Stock Trading Strategist
Sunshine Profits: Analysis. Care. Profits.

