

Briefly:
Intraday trade: In our opinion, the S&P 500 is likely to move lower today, as we expect more downward pressure on U.S. stocks following global stock markets' move down. Stop-loss level is at 2,480, marked by yesterday's close and daily high, and potential profit target is at 2,450 or 1% below yesterday's closing price (S&P 500 index).
Medium-term trade: In our opinion, short position is favored (opened on June 5 at 2,437.83, with stop-loss at 2,510, and profit target at 2,300, S&P 500 index).
Our intraday outlook is bearish, and our short-term outlook is bearish, as we expect downward correction. Our medium-term outlook remains neutral:
Intraday outlook (next 24 hours): bearish
Short-term outlook (next 1-2 weeks): bearish
Medium-term outlook (next 1-3 months): neutral
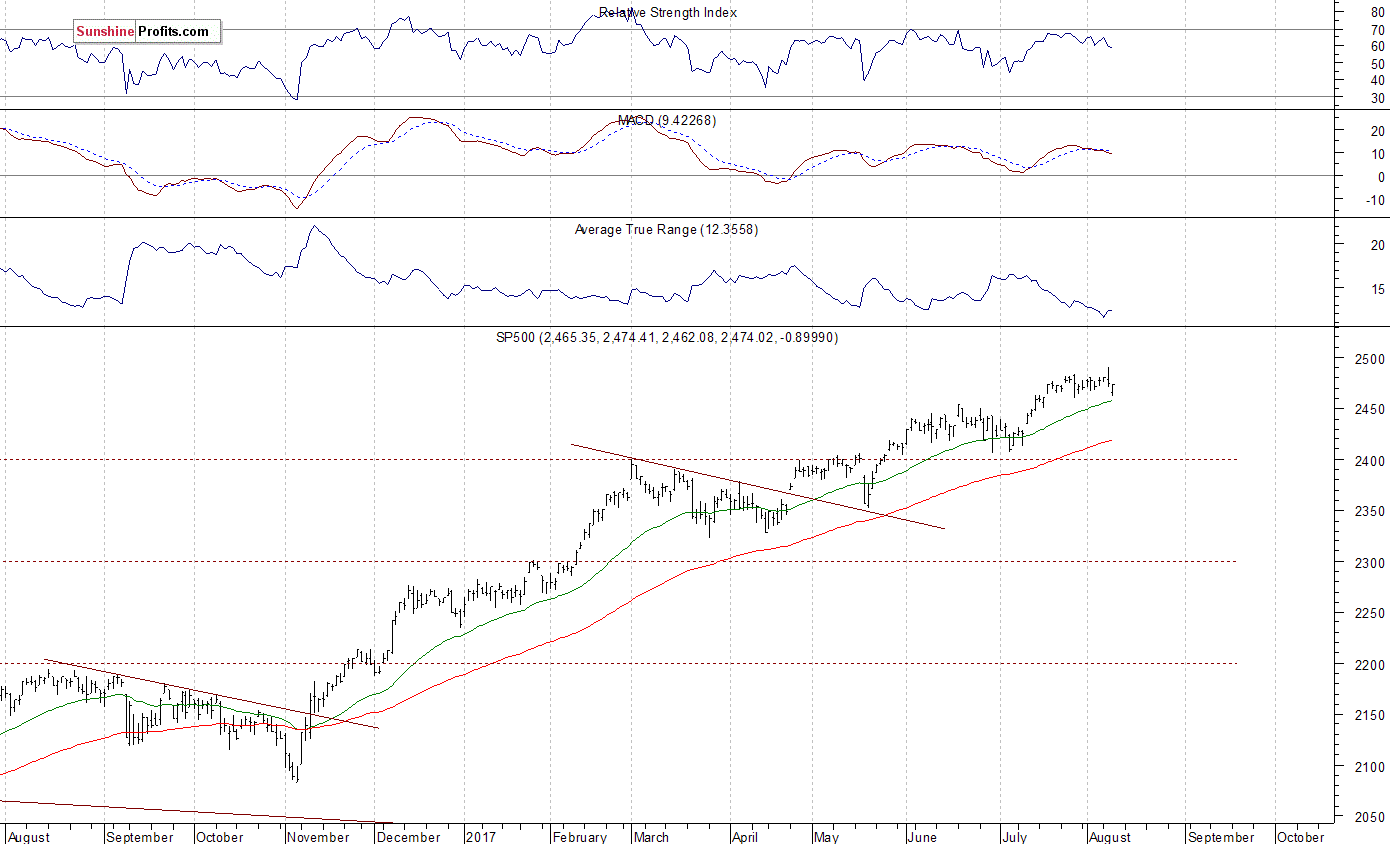
The U.S. stock market indexes were mixed between -0.3% and 0.0% on Wednesday, extending their short-term fluctuations, as investors continued to take profits off the table following some negative geopolitical news, among others. The S&P 500 index has reached new all-time high at the level of 2,490.87 on Tuesday, before reversing lower. The broad stock market gauge bounced off resistance level at around 2,490-2,500. The Dow Jones Industrial Average lost 0.2% yesterday, as it extended its Tuesday's move down off new record high. The technology Nasdaq Composite lost 0.3%, as it was relatively weaker than the broad stock market again. The nearest important support level of the S&P 500 index remains at 2,460-2,465, marked by July 19 daily gap up of 2,460.92-2,463.85 along with yesterday's daily low of 2,462.08. The next level of support is at 2,450-2,455, marked by June 19 local high. The support level is also at 2,430-2,435, marked by July 12 daily gap up of 2,429.30-2,435.75. On the other hand, level of resistance is at 2,485-2,490, marked by all-time high along with previous local high. The next resistance level is at 2,500 mark. There have been no confirmed negative signals so far. However, we can see medium-term overbought conditions and negative technical divergences. The S&P 500 index trades within an almost month-long consolidation, as we can see on the daily chart:
Futures Lower
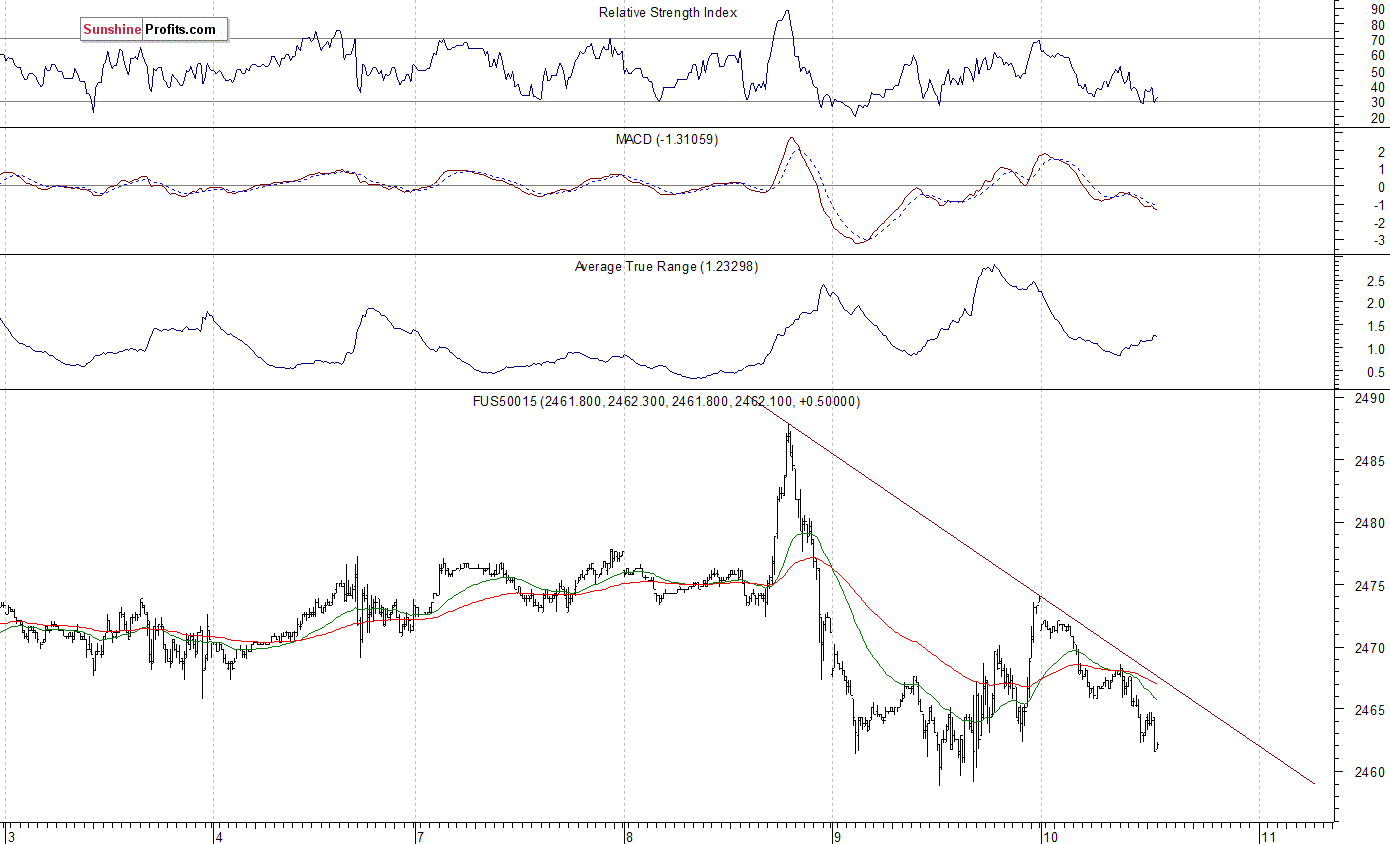
Expectations before the opening of today's trading session are negative, with index futures currently down between 0.2% and 0.6% vs. their Wednesday's closing prices. The European stock market indexes have lost 0.4-1.2% so far. Investors will now wait for some economic data announcements: Producer Price Index, Initial Claims at 8:30 a.m. The market expects that Producer Price Index grew 0.1% in July, and Initial Claims were at 240,000 last week. The S&P 500 futures contract trades within an intraday downtrend, as it retraces yesterday's intraday move up. The market trades within a short-term consolidation following Tuesday's intraday reversal. The nearest important level of resistance is at around 2,470-2,475, marked by local high. The next resistance level remains at 2,480-2,490, marked by record high. On the other hand, support level is at 2,460, marked by short-term local low. The next support level remains at 2,450, among others. Will the market break below this short-term consolidation? It is currently trading close to lower consolidation band:
Nasdaq Still Weaker
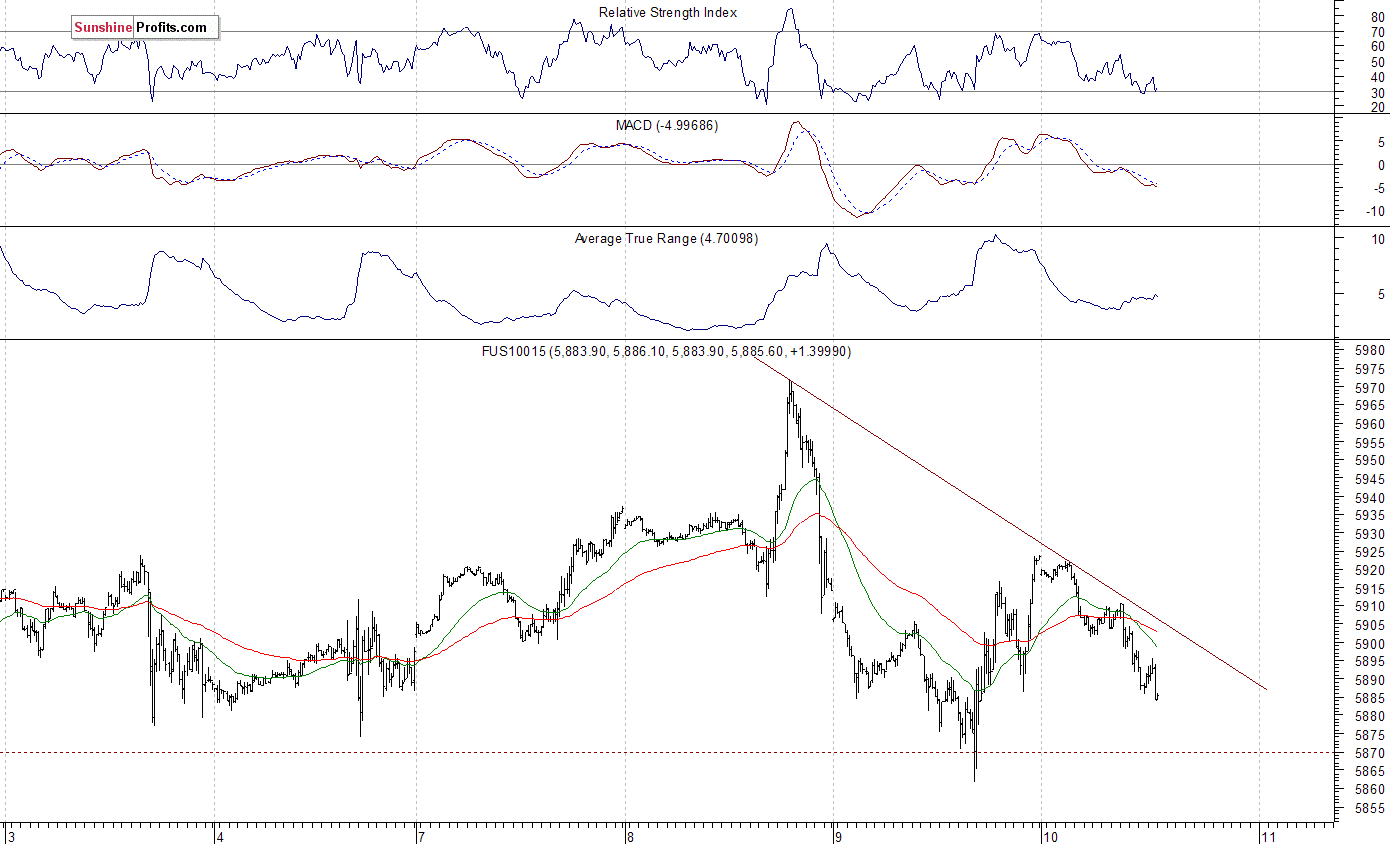
The technology Nasdaq 100 futures contract follows a similar path, as it retraces some of yesterday's intraday rebound off support level at around 5,860. The market remains within a few-week-long trading range along new record high, slightly below the level of 6,000. The nearest important level of resistance is at around 5,920-5,930, marked by short-term local highs. The next resistance level remains at 5,950-6,000. On the other hand, support level is at 5,850-5,870, marked by short-term local lows, as the 15-minute chart shows:
Concluding, the S&P 500 index continued to fluctuate on Wednesday, as it retraced some of Tuesday's decline. Is this a short-term bottom or just pause before another leg down? The index extends its almost month-long consolidation following early July move up. Is this just flat correction before another leg up or some medium-term topping pattern? There have been no confirmed medium-term negative signals so far. However, the market remains technically overbought. We can also see some negative technical divergences.
Therefore, we continue to maintain our short position (opened at 2,437.83 on June 5 - opening price of the S&P 500 index). Stop-loss level is at 2,510 and potential profit target is at 2,300 (S&P 500 index). One can trade S&P 500 index using futures contracts (S&P 500 futures contract - SP, E-mini S&P 500 futures contract - ES) or an ETF like the SPDR S&P 500 ETF - SPY. It is always important to set some exit price level in case some events cause the price to move in the unlikely direction. Having safety measures in place helps limit potential losses while letting the gains grow.
To summarize: short position in S&P 500 index is justified from the risk/reward perspective with the following entry prices, stop-loss orders and profit target price levels:
Intraday trade:
S&P 500 index - short position: profit target level: 2,450; stop-loss level: 2,480
S&P 500 futures contract (September) - short position: profit target level: 2,457; stop-loss level: 2,477
SPY ETF (SPDR S&P 500, not leveraged) - short position: profit target level: $245.0; stop-loss level: $248.0
Medium-term trade:
S&P 500 index - short position: profit target level: 2,300; stop-loss level: 2,510
S&P 500 futures contract (September) - short position: profit target level: 2,297; stop-loss level: 2,507
SPY ETF (SPDR S&P 500, not leveraged) - short position: profit target level: $230; stop-loss level: $251
SDS ETF (ProShares UltraShort S&P500, leveraged: -2x) - long position: opening price: $12.56; profit target level: $13.98; stop-loss level: $11.82
Thank you.
Paul Rejczak
Stock Trading Strategist
Stock Trading Alerts

