

Briefly:
Intraday trade: The S&P 500 index gained 0.6% on Tuesday, after opening virtually flat. The broad stock market will probably open higher today. We may see an attempt at getting back to mid-October local highs.
Trading position (short-term; our opinion): no positions are justified from the risk/reward perspective.
Our short-term outlook is neutral, and our medium-term outlook is neutral:
Short-term outlook (next 1-2 weeks): neutral
Medium-term outlook (next 1-3 months): neutral
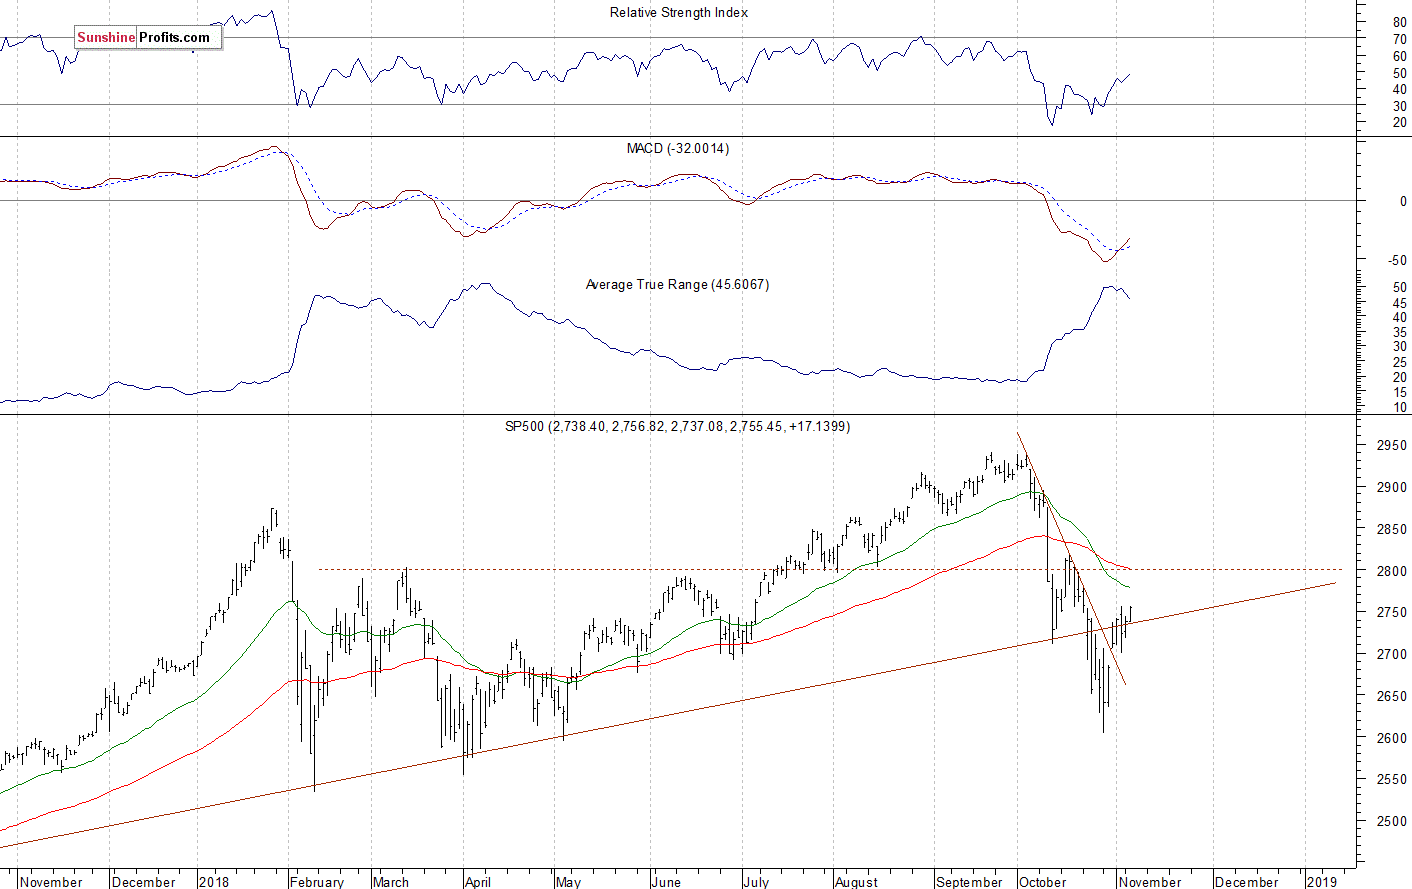
The U.S. stock market indexes gained 0.6-0.7% on Tuesday, extending their short-term consolidation, as investors' sentiment remained bullish following last week's rebound and Wednesday's breakout above 2,700 mark. It was 11.5% below September the 21st record high of 2,940.91 on last week's Monday. And now it trades 6.3% below the all-time high. The Dow Jones Industrial Average gained 0.7% and the Nasdaq Composite gained 0.6% yesterday.
The nearest important level of resistance of the S&P 500 index remains at around 2,750-2,760, marked by the previous level of support and Friday's daily high. The next resistance level is at 2,780-2,800, marked by mid-October consolidation. On the other hand, the level of support is now at 2,735-2,740, marked by yesterday's daily low. The next support level remains at around 2,685-2,705, marked by last Wednesday's daily gap up of 2,685.43-2,705.60. The next support level is at 2,630-2,650.
The broad stock market extended its downtrend more than a week ago, as the S&P 500 index fell closer to 2,600 mark. Then it bounced sharply and accelerated higher on Wednesday. For now, it looks like an upward correction within a downtrend. However, if the index breaks above 2,750, we could see more buying pressure. The market is at the broken long-term upward trend line, as we can see on the daily chart:
Very Positive Expectations
Expectations before the opening of today's trading session are positive, because the index futures contracts trade 0.7-1.1% above their yesterday's closing prices. The European stock market indexes have gained 1.0-1.4% so far. Investors will wait for the Crude Oil Inventories number release at 10:30 a.m. The broad stock market may continue retracing its October sell-off today. The S&P500 will likely get closer to the resistance level of around 2,780-2,800. However, we may see a short-term profit-taking action at some point.
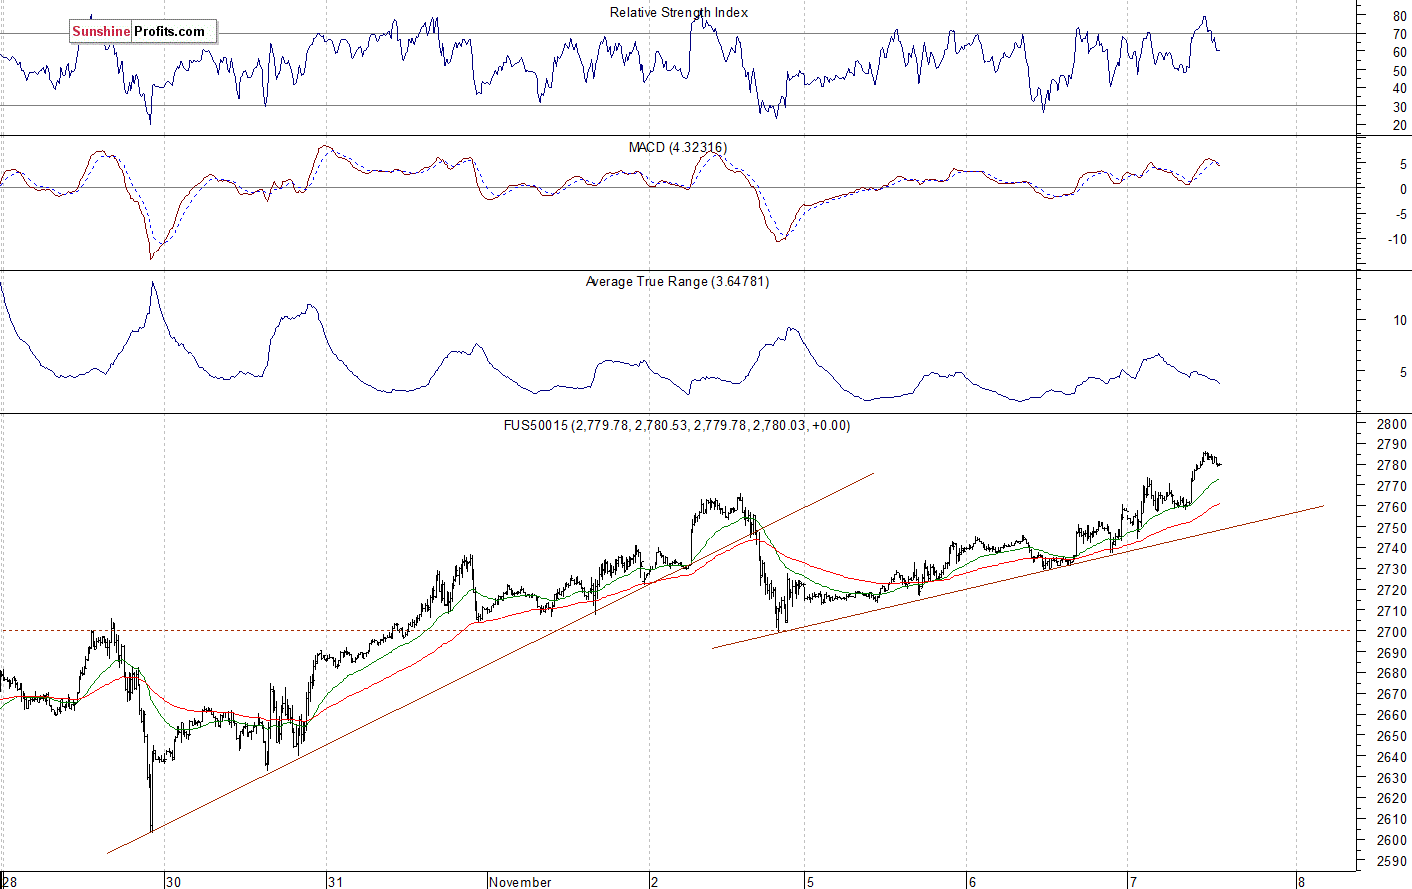
The S&P 500 futures contract trades within an intraday uptrend, as it extends its recent advance. The nearest important level of resistance is at around 2,800. The resistance level is also at 2,820-2,825, marked by the mid-October local high. On the other hand, the support level is at 2,750-2,760, marked by the recent level of resistance. The futures contract trades above its short-term upward trend line, as the 15-minute chart shows:
Nasdaq Above 7,000 Again
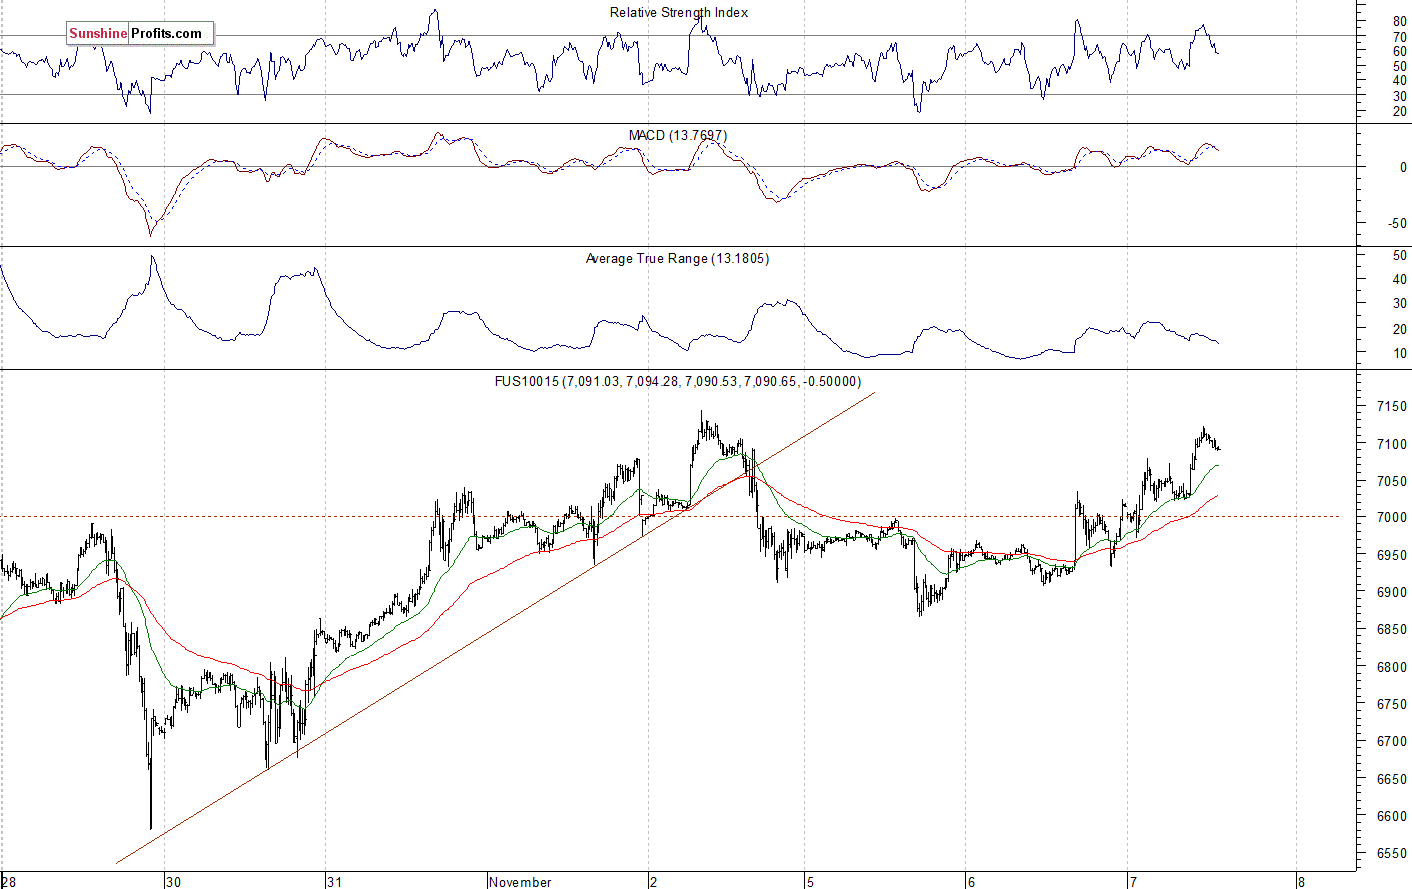
The technology Nasdaq 100 futures contract follows a similar path, as it trades within an intraday uptrend. The market got back above 7,000 mark. It currently trades along the level of 7,100. The next resistance level remains at 7,150-7,200, marked by the previous local highs. On the other hand, the support level is at 6,950-7,000, among others. The Nasdaq futures contract got back to its recent local high, as we can see on the 15-minute chart:
Big Cap Tech Stocks Remain Relatively Weak
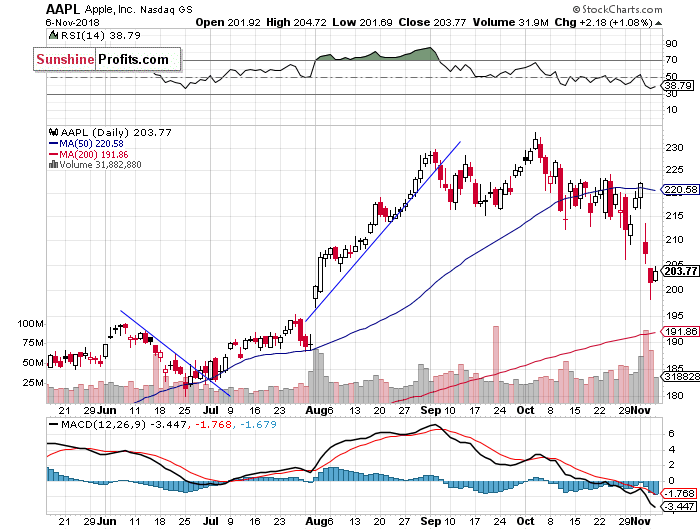
Let's take a look at Apple, Inc. stock (AAPL) daily chart (chart courtesy of http://stockcharts.com). It sold off below the level of $200 on Monday, before bouncing off the support level. It was relatively weaker than the broad stock market, as investors continued to react to Thursday's quarterly earnings release. The stock fell the lowest since the early August. Will the stock break even lower? We will probably see some short-term fluctuations along the mentioned support level of $200:
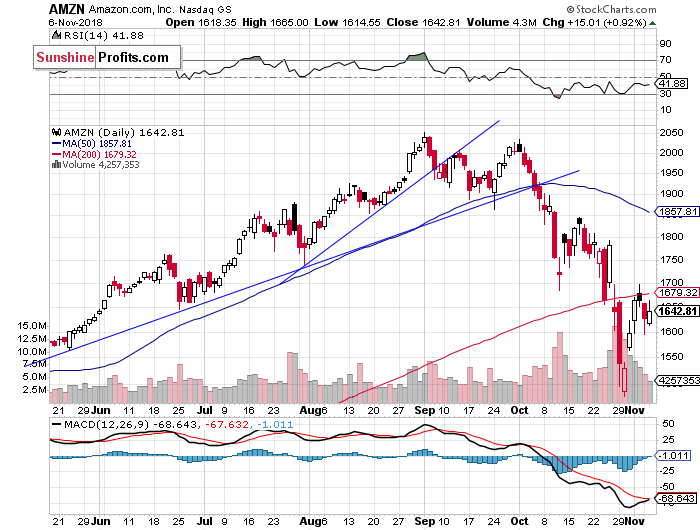
Now let's take a look at Amazon.com, Inc. stock (AMZN) daily chart. It accelerated its sell-off following quarterly earnings release. The stock continued lower last week, but then it bounced off support level of $1,500. Will it continue higher? Or was it just a quick upward correction before another leg down? The market may fluctuate along the resistance level of around $1,650-$1,700 for some time:
Dow Jones Breaks Higher
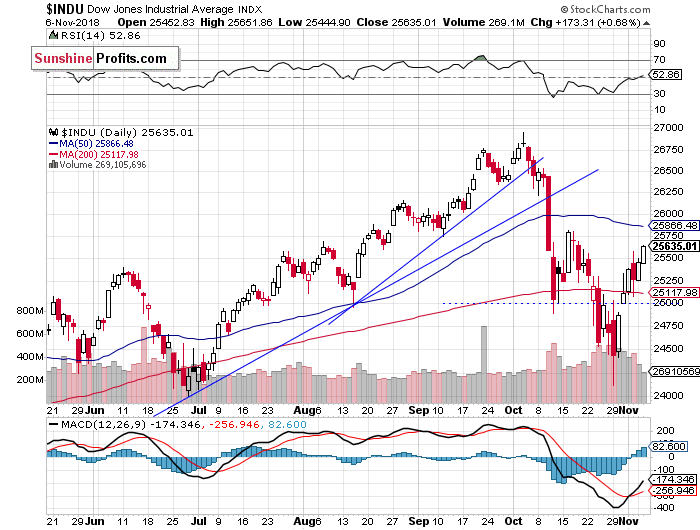
The Dow Jones Industrial Average retraced some more of its recent decline yesterday. It got back above the level of 25,500. The nearest important level of resistance is at around 25,500-25,750, marked by the previous local highs. The resistance level is also at 26,000:
Japanese Stocks Follow the U.S. Market
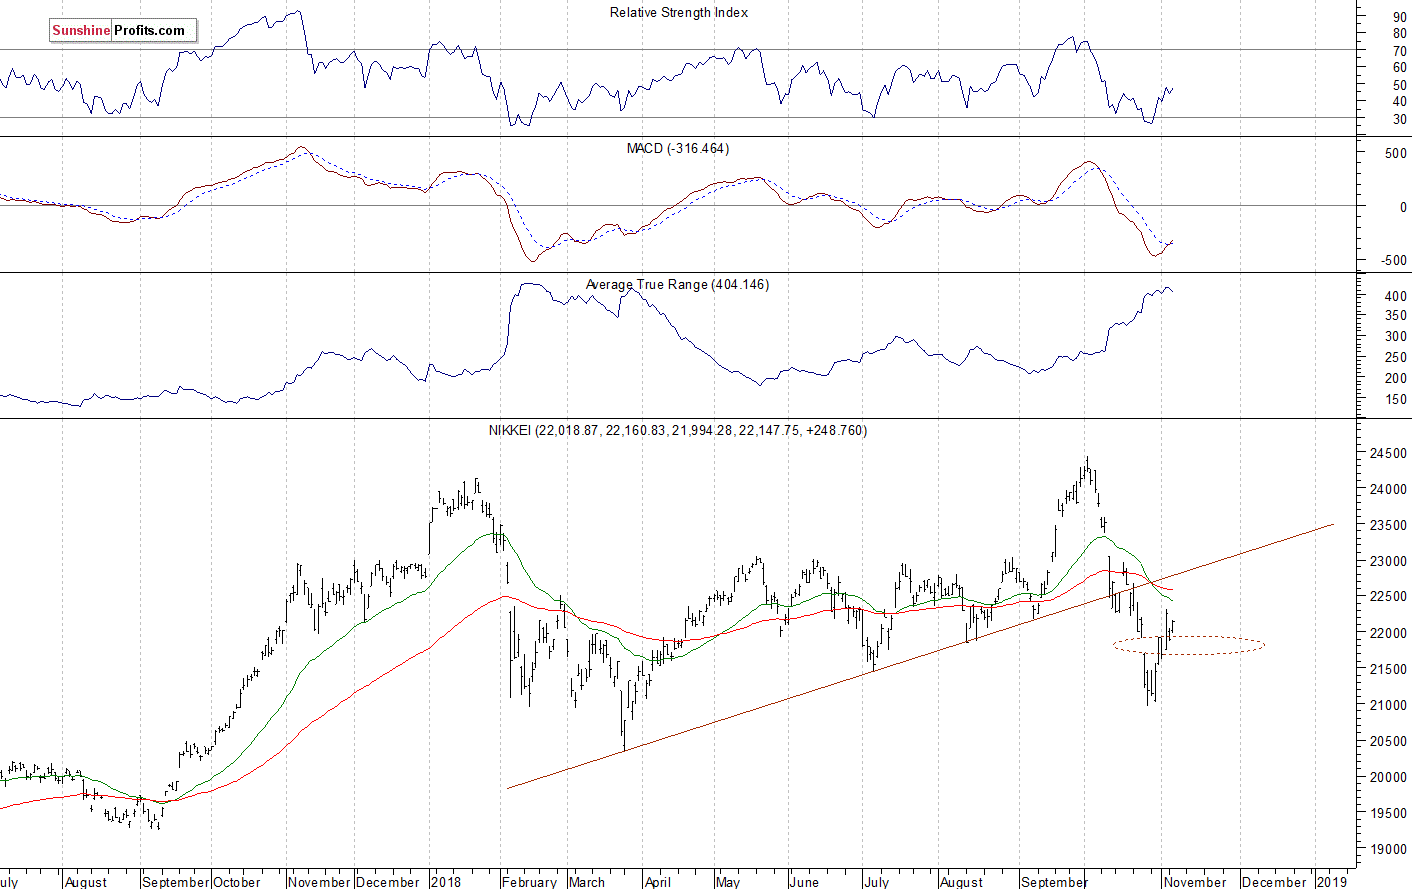
Let's take a look at the Japanese Nikkei 225 index now. It keeps retracing its October sell-off recently. The market got back above the resistance of October the 25th daily gap down. But for now, it looks like an upward correction within a downtrend. The Nikkei continues to trade below its broken long-term upward trend line, as the daily chart shows:
The S&P 500 index trades within a short-term uptrend, as it continues retracing its October sell-off. Stocks may have reached their short-term panic bottom a week ago on Monday. But will the bounce continue? The market is likely to break above the relatively important level of resistance of 2,750-2,760 today. But then, there is also a resistance level of around 2,800-2,820.
Concluding, the S&P 500 index will probably open higher today, as investors' sentiment improved following the U.S. Elections. We may see an attempt at getting back to 2,800 mark.
Trading position (short-term; our opinion): no positions are justified from the risk/reward perspective.
Thank you.
Paul Rejczak
Stock Trading Strategist
Stock Trading Alerts

