

Briefly:
Intraday trade: Our Thursday's intraday trading outlook was bearish. It proved wrong because the S&P 500 index gained 0.03%, following lower opening of the trading session. The market retraced some of its recent rally, before bouncing off support level at 2,550. There have been no confirmed negative signals so far. On the other hand, we still can see some short-term overbought conditions. Therefore, we prefer to be out of the market today, avoiding low risk/reward ratio trades.
Medium-term trade: In our opinion, no medium-term positions are justified.
Our intraday outlook is neutral today. Our short-term outlook is neutral, and our medium-term outlook is neutral:
Intraday outlook (next 24 hours): neutral
Short-term outlook (next 1-2 weeks): neutral
Medium-term outlook (next 1-3 months): neutral
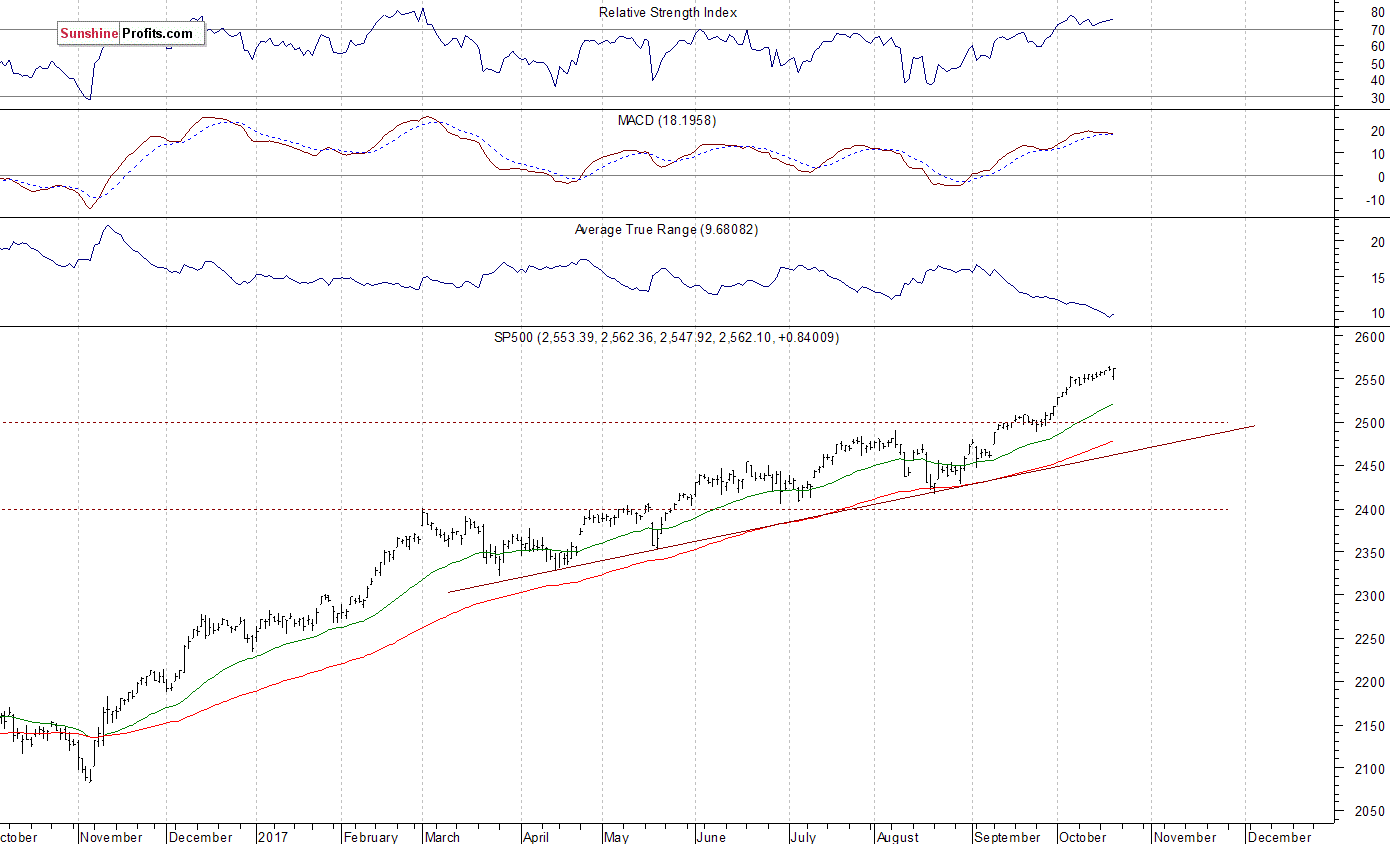
The U.S. stock market indexes were mixed between -0.3% and 0.0% on Thursday, following relatively volatile trading session, as investors took short-term profits off the table. The S&P 500 index retraced some of its recent move up. It fell slightly below the level of 2,550, before bouncing back closer to Wednesday's record high of 2,564.11. The Dow Jones Industrial Average remained close to its Wednesday's record high of 23,172.93, and the technology Nasdaq Composite was relatively weaker, as it retraced its two-week-long advance, before closing just 0.3% lower. The nearest important level of support of the S&P 500 index remains at around 2,550, marked by previous resistance level and yesterday's daily low. The next support level is at 2,540, marked by recent fluctuations. The support level is also at 2,520-2,530, marked by previous daily gap up of 2,519.44-2,520.40 and short-term local lows. On the other hand, resistance level is at around 2,560-2,565, marked by the above-mentioned new all-time high. The S&P 500 index fluctuates following its recent advance. Is this a topping pattern or just correction within an uptrend? We still can see medium-term negative technical divergences along with technical overbought conditions. However, there have been no confirmed negative signals so far:
Positive Expectations
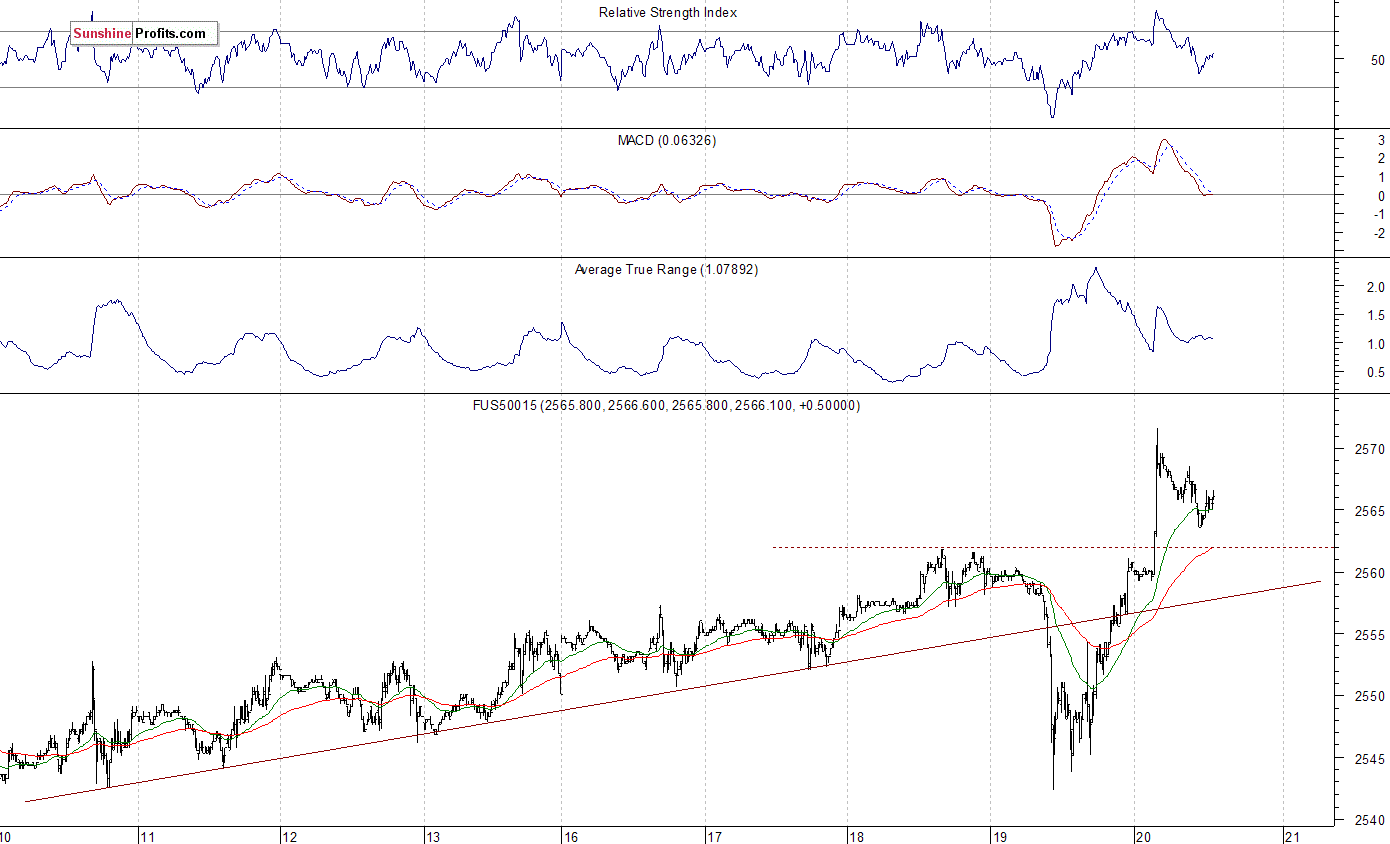
Expectations before the opening of today's trading session are positive, with index futures currently between +0.2% and +0.4% vs. Thursday's closing prices. The European stock market indexes have gained 0.2-0.3% so far. Investors will wait for the Existing Home Sales number at 10:00 a.m. The market expects that it was at 5.30M in September. Investors will also wait for more quarterly corporate earnings releases. The S&P 500 futures contract trades within an intraday consolidation, following an overnight rally. The market has reached new record high above the level of 2,570. The nearest important resistance level is at around 2,570. On the other hand, support level is at 2,560, marked by local high. The next level of support remains at 2,550. The futures contract reached new record high following an overnight breakout above resistance level, as the 15-minute chart shows:
Nasdaq Still Below Record High
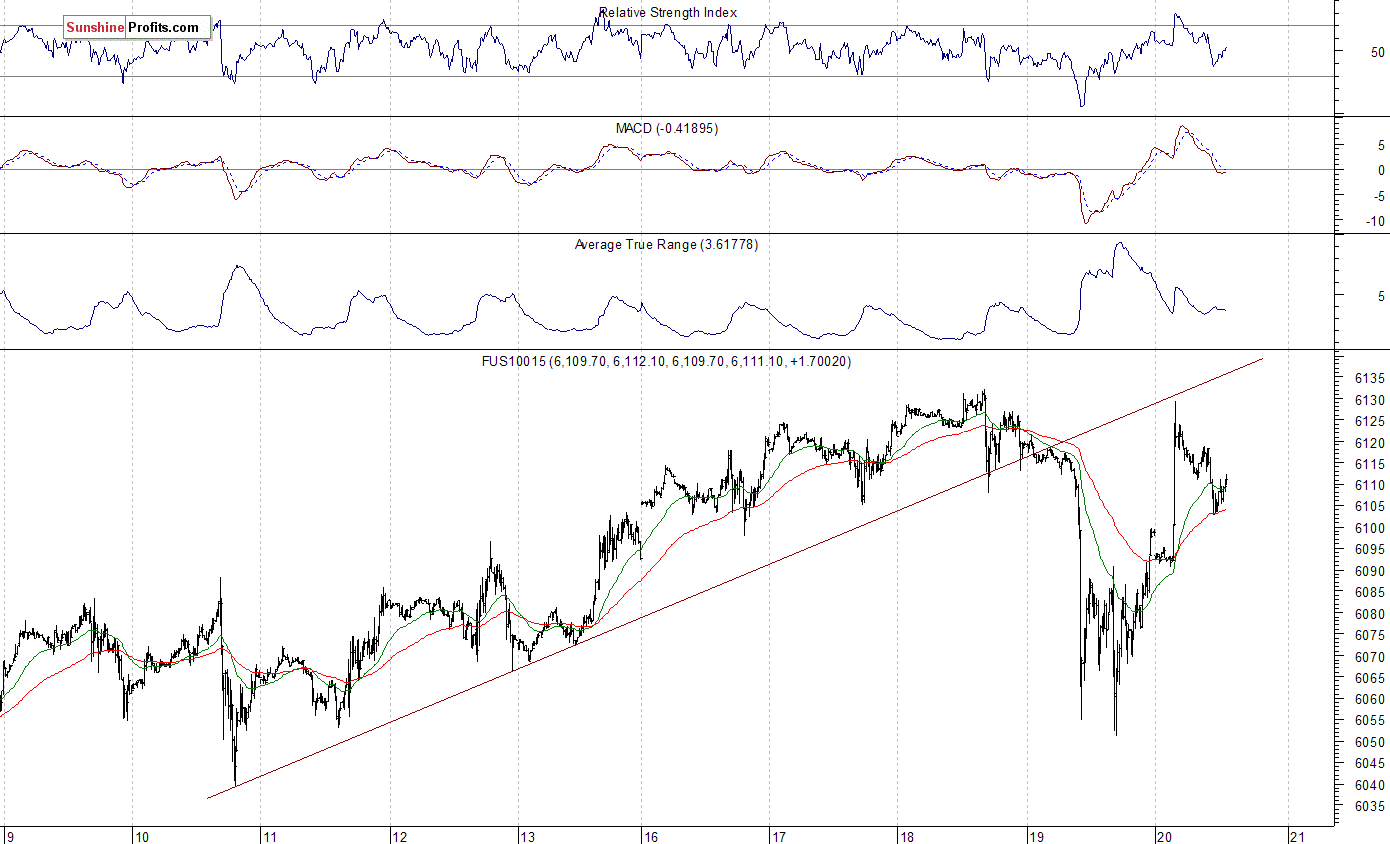
The technology Nasdaq 100 futures contract trades within an intraday consolidation following an overnight rally. However, it failed to reach new record high. The market trades slightly below the resistance level of 6,120-6,130, marked by its record high. On the other hand, support level remains at 6,080-6,100. The next support level is at around 6,050, marked by yesterday's daily low. The Nasdaq 100 futures contract broke below its short-term upward trend line yesterday, and it currently trades slightly below that line, following bounce off support level, as we can see on the 15-minute chart:
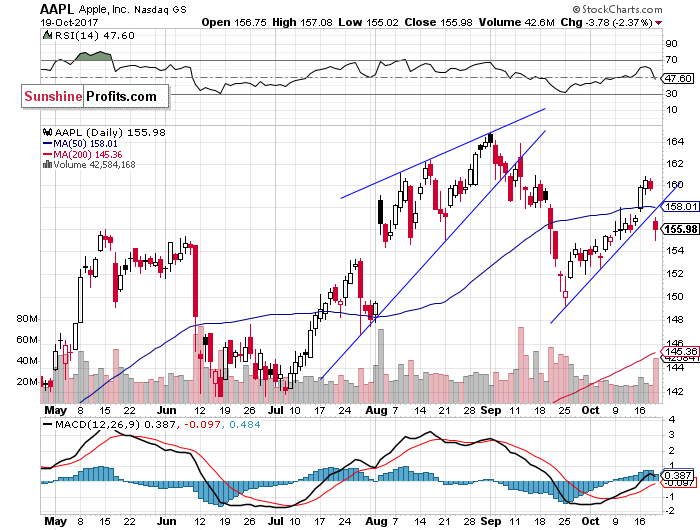
Let's take a look at Apple, Inc. stock (AAPL) daily chart (chart courtesy of http://stockcharts.com) again. It broke below its short-term upward trend line yesterday, after reaching the resistance level of $160 on Tuesday and Wednesday. The stock price bounced off support level at around $150 at the end of September. Is this a new downtrend or just downward correction following recent advance?
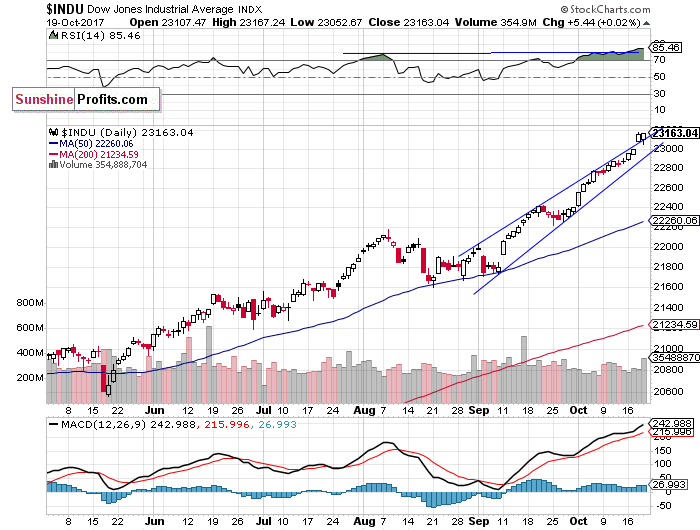
The Dow Jones Industrial Average daily chart (chart courtesy of http://stockcharts.com) shows that blue-chip index trades at new record highs, as it is above 23,000 mark. There have been no confirmed negative signals so far. The price broke above an over month-long rising wedge pattern on Wednesday. Is this some blow-off top pattern?
Concluding, the S&P 500 index was unchanged yesterday, following relatively big intraday decline, as investors took short-term profits off the table after economic data, quarterly corporate earnings releases. There have been no confirmed negative signals so far. However, we still can see technical overbought conditions, along with very bullish investors' sentiment. Will they lead to a downward correction?
Currently, we prefer to be out of the market, avoiding low risk/reward ratio medium-term trades. We will let you know when we think it is safe to get back in the market.
To summarize: no medium-term positions are justified from the risk/reward perspective at this moment.
Intraday trade:
No intraday position is justified from the risk/reward perspective today.
Medium-term trade:
No medium-term position is justified from the risk/reward perspective at this moment.
Thank you.
Paul Rejczak
Stock Trading Strategist
Stock Trading Alerts

