
Briefly: In our opinion, speculative short positions are favored (with stop-loss at 2,050 and profit target at 1,920, S&P 500 index)
Our intraday outlook remains bearish, and our short-term outlook is bearish:
Intraday outlook (next 24 hours): bearish
Short-term outlook (next 1-2 weeks): bearish
Medium-term outlook (next 1-3 months): bearish
Long-term outlook (next year): bullish
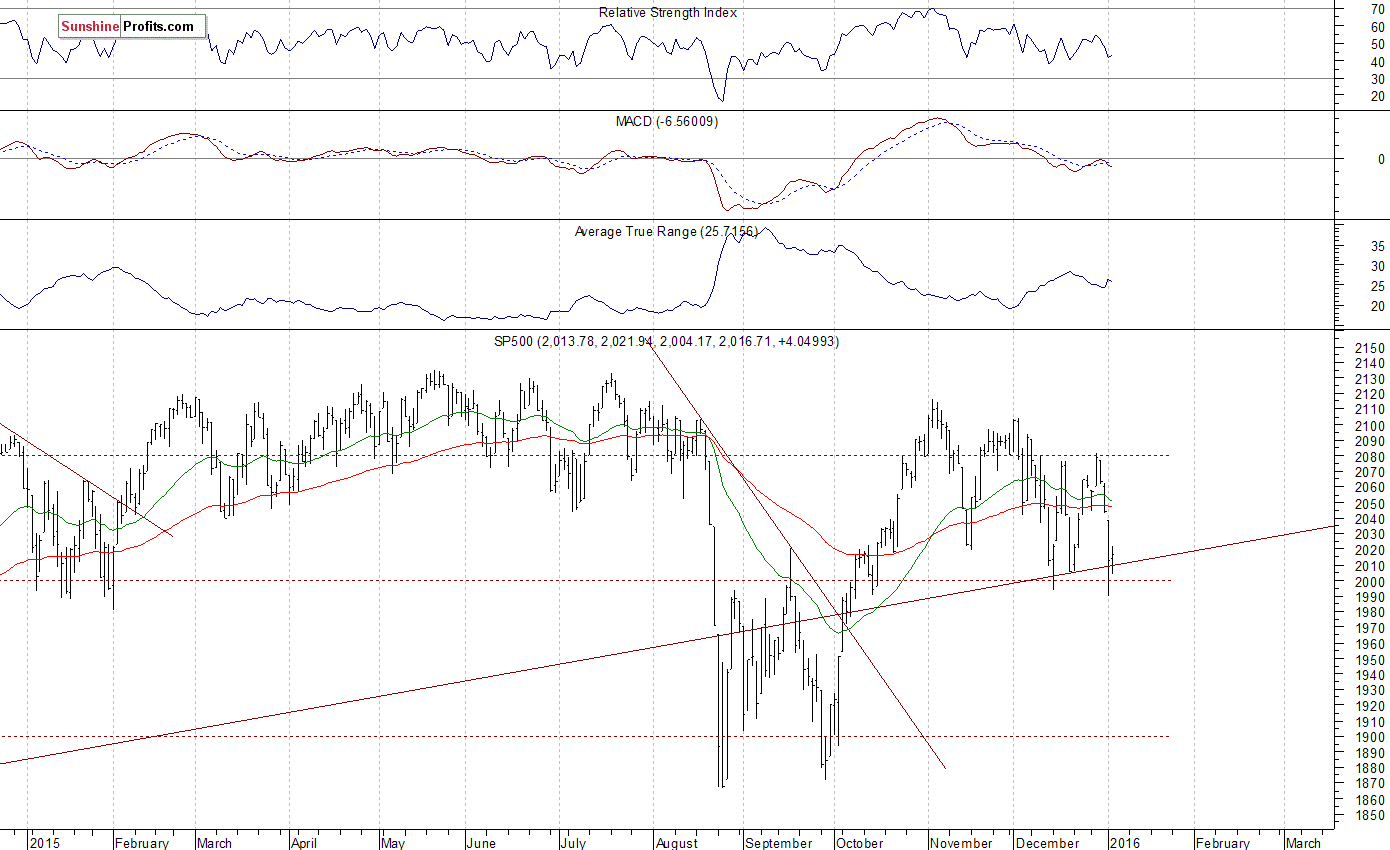
The U.S. stock market indexes were mixed between -0.3% and +0.2% on Tuesday, as investors hesitated following recent move down. The S&P 500 index remains close to support level of 1,990-2,000. The next support level is at around 1,950, marked by September's local high, among others. On the other hand, the nearest important level of resistance is at around 2,040, marked by Monday's daily gap down of 2,038.20-2,043.62. There is no clear medium-term direction, as the market continues to trade within two-month long consolidation following October rally. Will it break down below support level of 2,000 and re-visit last year's August - September lows? It seems like a growing possibility right now:
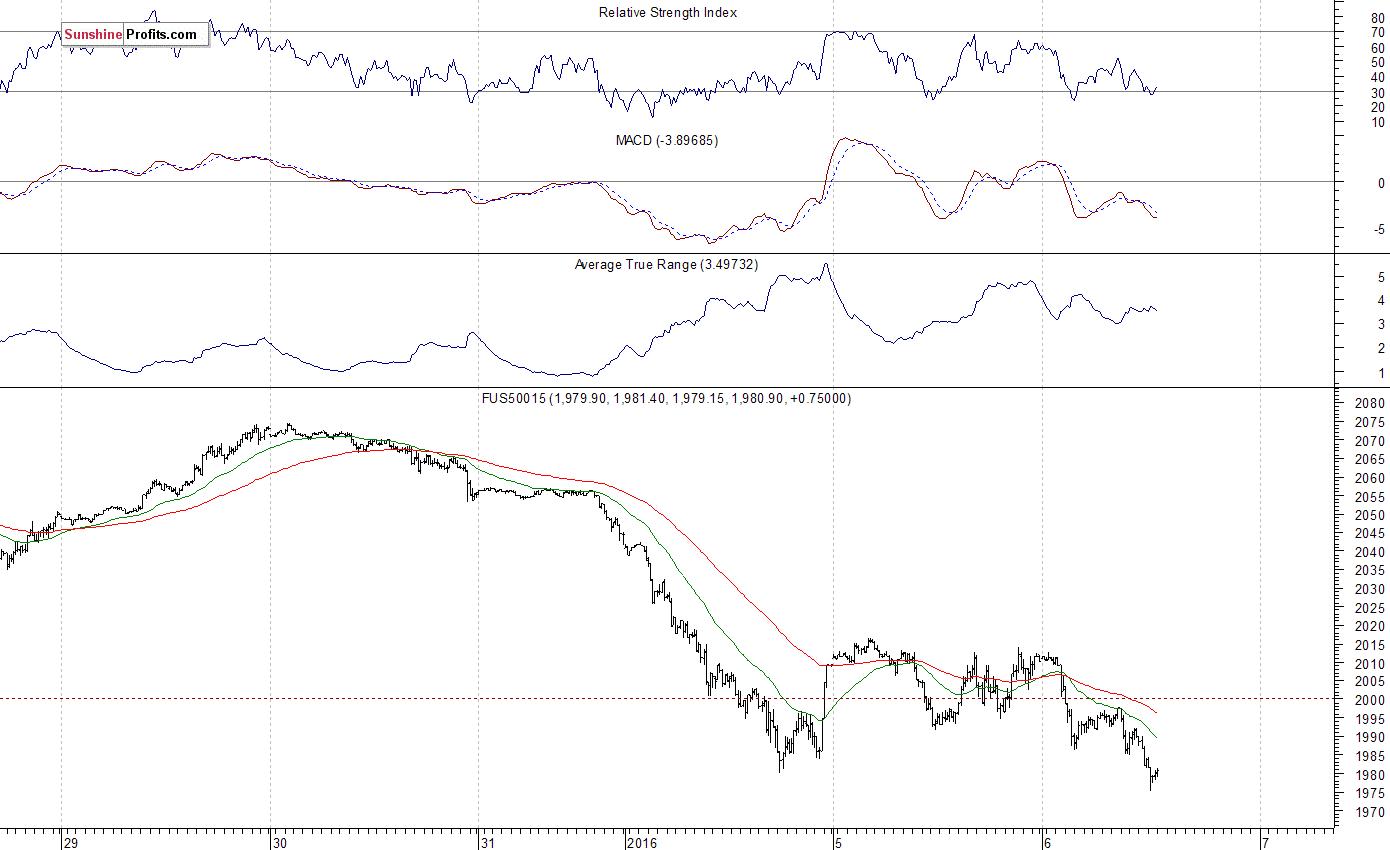
Expectations before the opening of today's trading session are negative, with index futures currently down 1.5-1.7%. The European stock market indexes have lost 1.5-1.6% so far. The S&P 500 futures contract broke below its Monday's local low this morning, as it currently trades below support level of 1,990-2,000. The nearest important level of resistance is at around 2,000-2,010. There have been no confirmed short-term positive signals so far. However, we can see some oversold conditions:
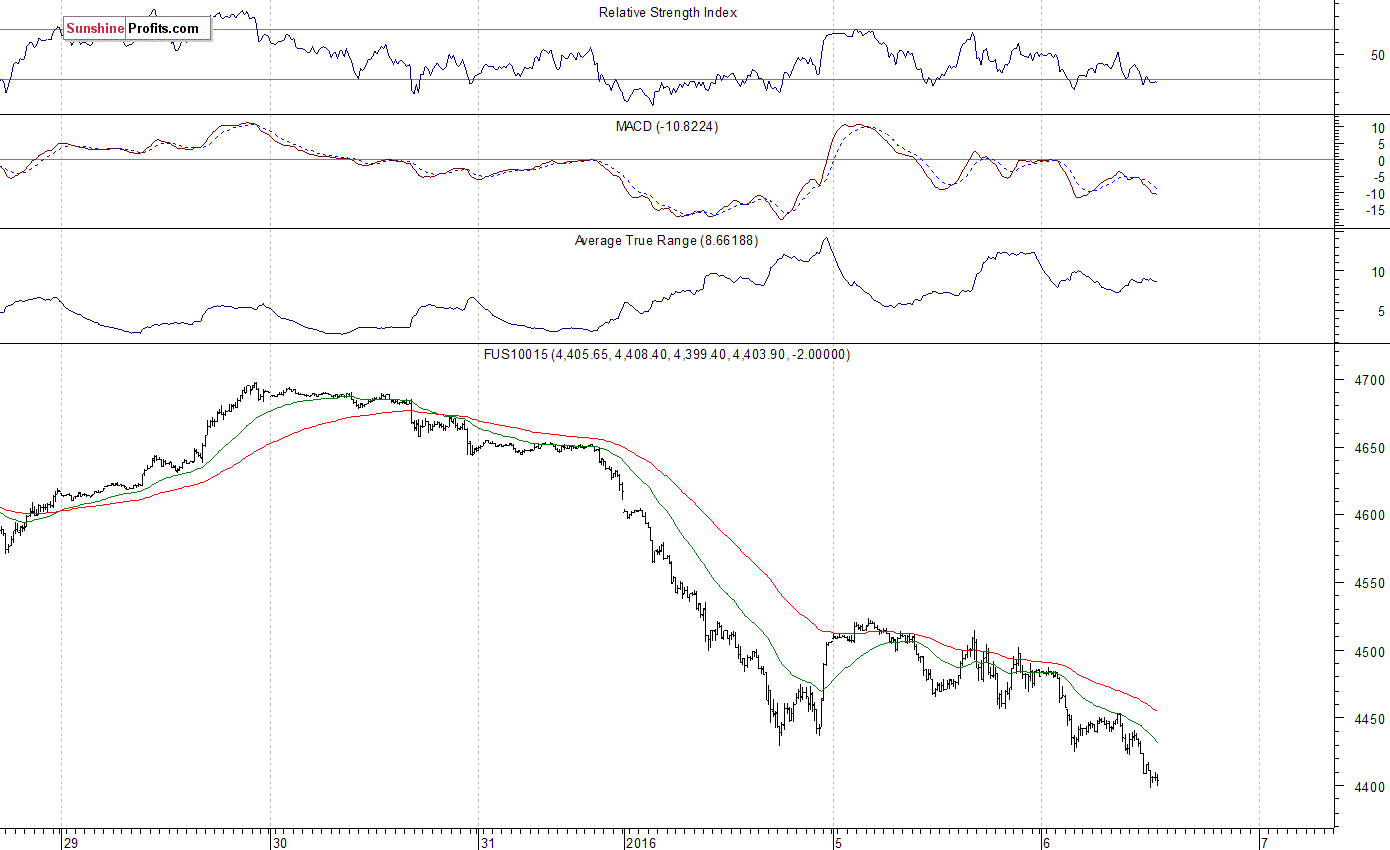
The technology Nasdaq 100 futures contract extends its short-term downtrend, as it currently trades close to support level of 4,400. The nearest important level of resistance is at around 4,430-4,450, marked by previous consolidation, among others. There have been no confirmed short-term positive signals so far. However, there are some technical oversold conditions, as we can see on the 15-minute chart:
Concluding, the broad stock market is likely to continue its short-term downtrend today, as the S&P 500 index may break below support level of 2,000. It is hard to say whether this is a new downtrend leading to last year's August - September lows' re-test or just a downward correction following October rally, but we continue to maintain our already profitable speculative short position (2,077.34, S&P 500 index). However, we decided to move our stop-loss level down to 2,050, and our profit target level down to at 1,920. You can trade S&P 500 index using futures contracts (S&P 500 futures contract - SP, E-mini S&P 500 futures contract - ES) or an ETF like the SPDR S&P 500 ETF - SPY. It is always important to set some exit price level in case some events cause the price to move in the unlikely direction. Having safety measures in place helps limit potential losses while letting the gains grow.
Thank you.
Paul Rejczak
Stock Trading Strategist
Stock Trading Alerts

