

Briefly:
Intraday trade: The S&P 500 index gained 1.6% on Monday, after opening 0.6% higher. The broad stock market will probably open lower today. We may see some more short-term fluctuations.
Trading position (short-term; our opinion): no positions are justified from the risk/reward perspective.
Our short-term outlook is neutral, and our medium-term outlook is neutral:
Short-term outlook (next 1-2 weeks): neutral
Medium-term outlook (next 1-3 months): neutral
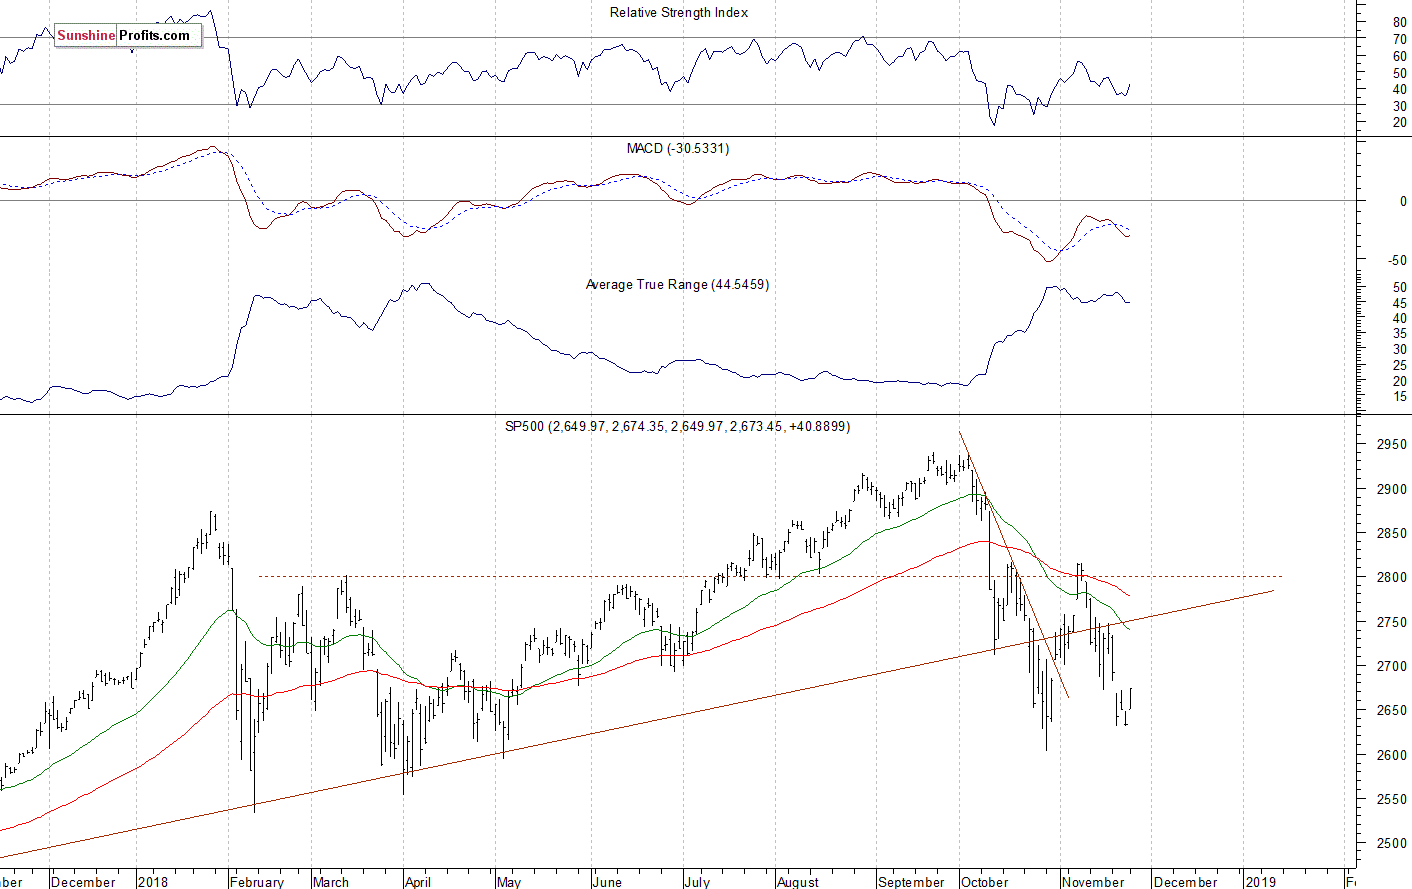
The U.S. stock market indexes gained 1.5-2.1% on Monday, retracing their recent decline, as investors' sentiment improved. The S&P 500 index broke slightly above its recent local highs, however, it remained well below the level of 2,700. It currently trades 9.1% below September the 21st record high of 2,940.91. The Dow Jones Industrial Average gained 1.5% and the Nasdaq Composite gained 2.1% on Monday.
The nearest important level of resistance of the S&P 500 index is at 2,670-2,680, marked by last week's Tuesday's daily gap down of 2,669.44-2,681.09. The resistance level is also at 2,690-2,700, marked by the previous level of support. On the other hand, the level of support is now at 2,645-2,650, marked by yesterday's daily gap up of 2,647.55-2,649.97. The support level is also at 2,630, marked by the recent local lows.
The broad stock market got closer to its late October low recently. The S&P 500 index traded more than 10% below the record high. So will the downtrend continue? Or is this a bottoming pattern before an upward reversal? There have been no confirmed positive signals so far. The market continues to trade below its long-term upward trend line, as we can see on the daily chart:
Negative Expectations, Just Correction?
Expectations before the opening of today's trading session are negative, because the index futures contracts trade 0.2-0.5% lower vs. their Monday's closing prices. The European stock market indexes have lost 0.2-0.3% so far. Investors will wait for the Consumer Confidence number release at 10:00 a.m. The broad stock market will likely extend its short-term consolidation. The index may continue to trade below the mentioned resistance level marked by last week's daily gap up.
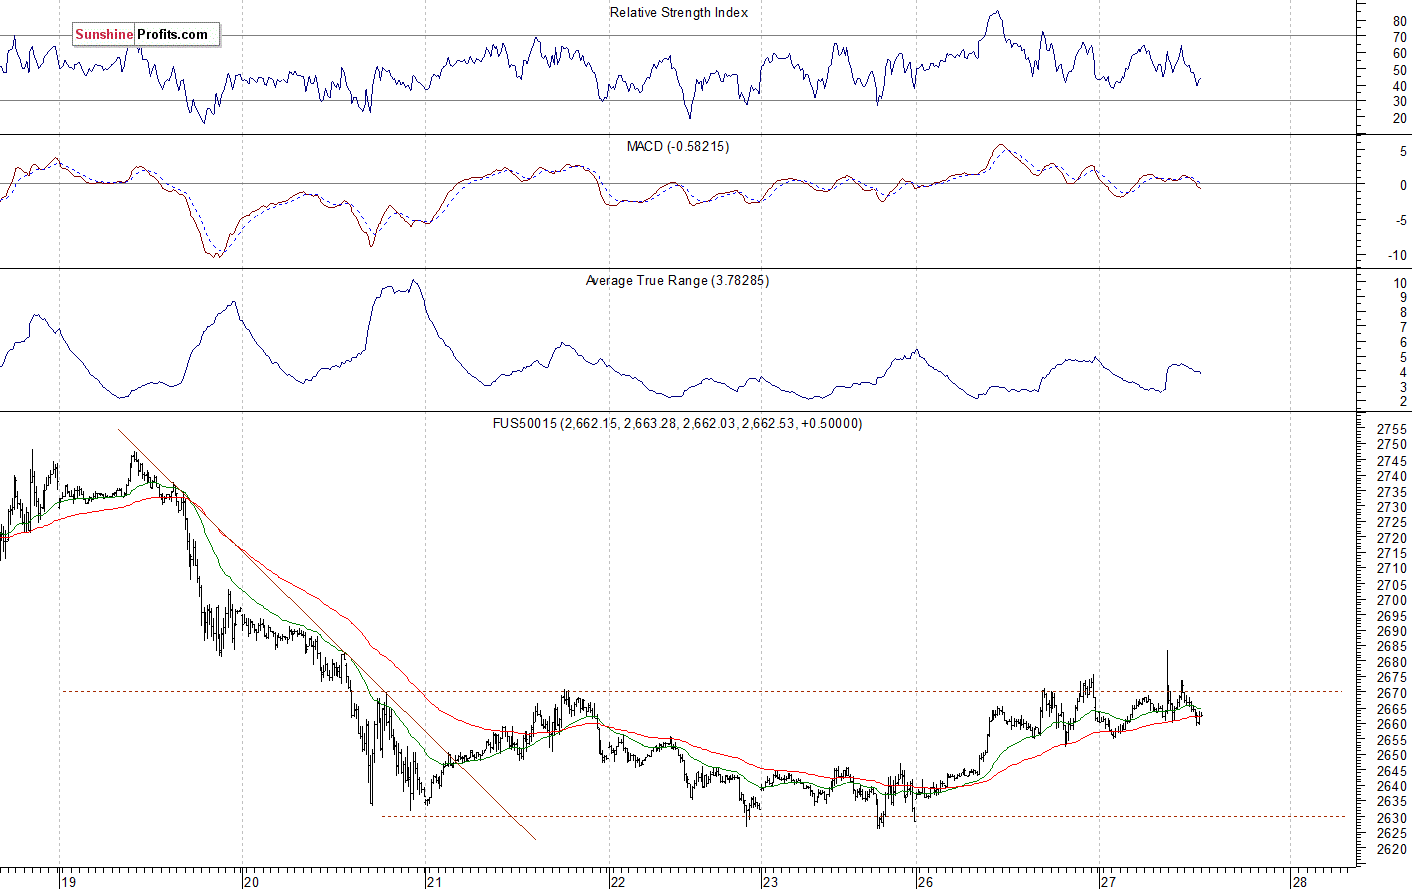
The S&P 500 futures contract trades within an intraday consolidation. The nearest important level of resistance is at around 2,675-2,680, marked by some short-term local highs. The next resistance level is at 2,700. On the other hand, the support level is now at 2,650-2,655, among others. The futures contract is at its recent local highs, as the 15-minute chart shows:
Nasdaq Bounces Off 6,700
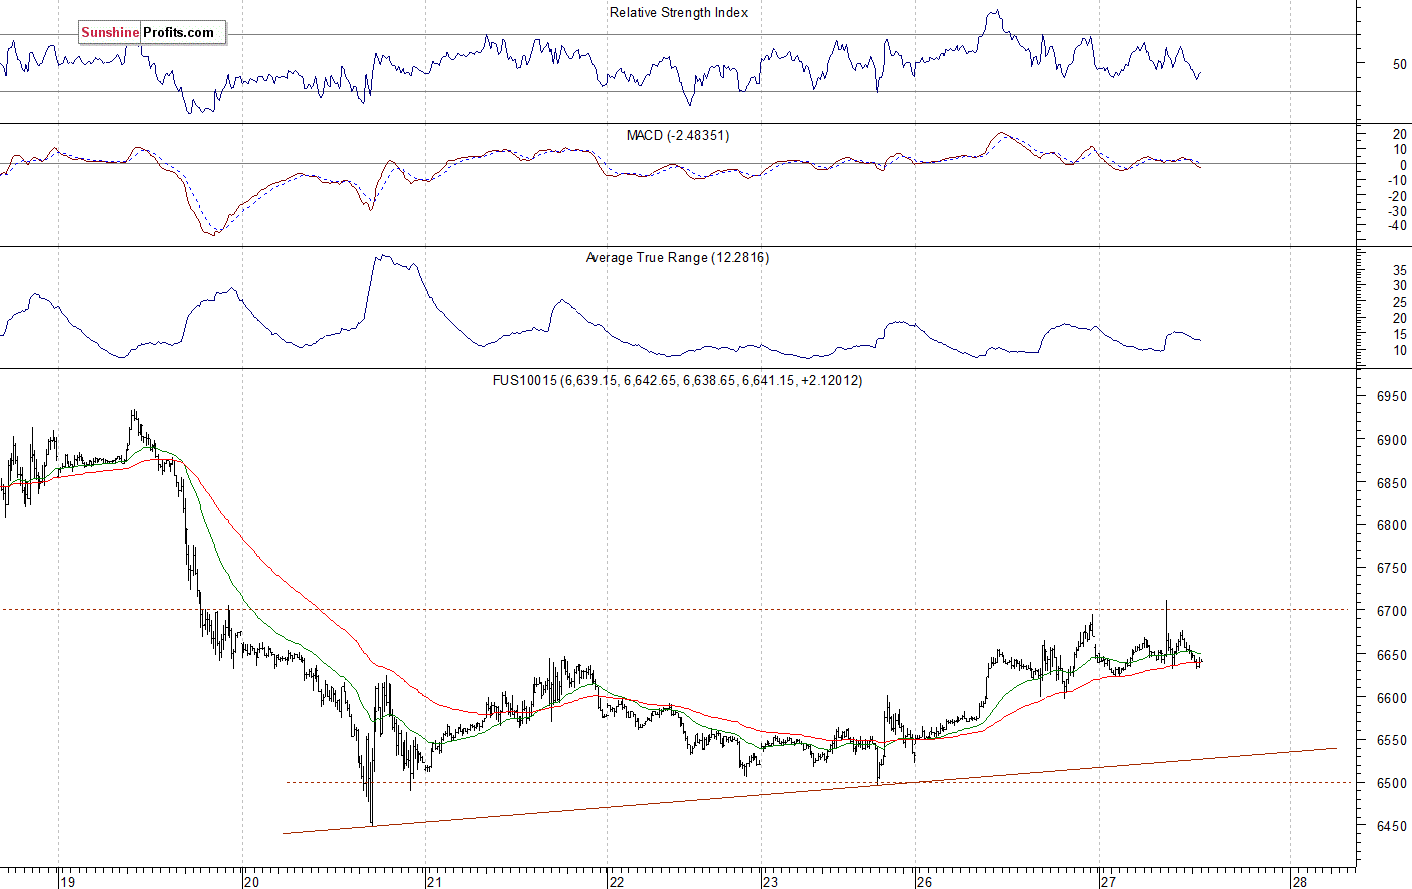
The technology Nasdaq 100 futures contract follows a similar path, as it trades within an intraday consolidation. The tech stocks' gauge accelerated its downtrend on Tuesday a week ago and it reached the new low of around 6,450. It was the lowest since the late April. Then the market fluctuated along the level of 6,500-6,550. This morning it reached the resistance level 6,700. The Nasdaq futures contract trades along the level of 6,650, as we can see on the 15-minute chart:
Apple Sets New Low, Amazon Relatively Stronger
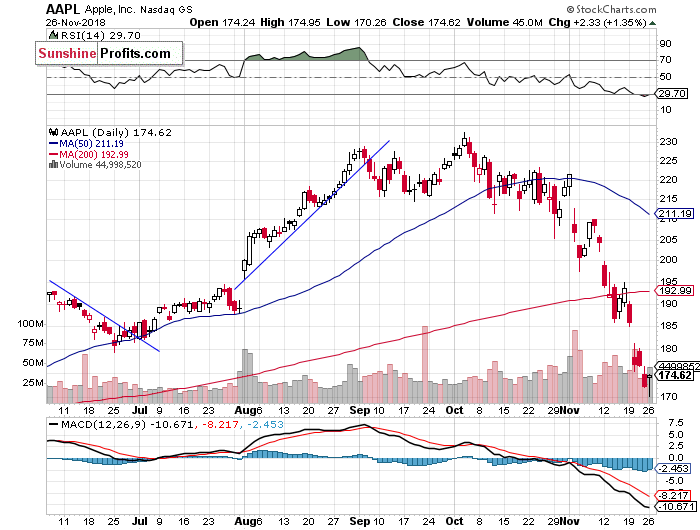
Let's take a look at Apple, Inc. stock (AAPL) daily chart (chart courtesy of http://stockcharts.com). The stock accelerated its sell-off on Friday following Tuesday's breakdown below the support level of $185-190. It fell closer to $170 yesterday. The market may have reached a temporary bottom of around $170-175. However, there have been no confirmed positive signals so far:
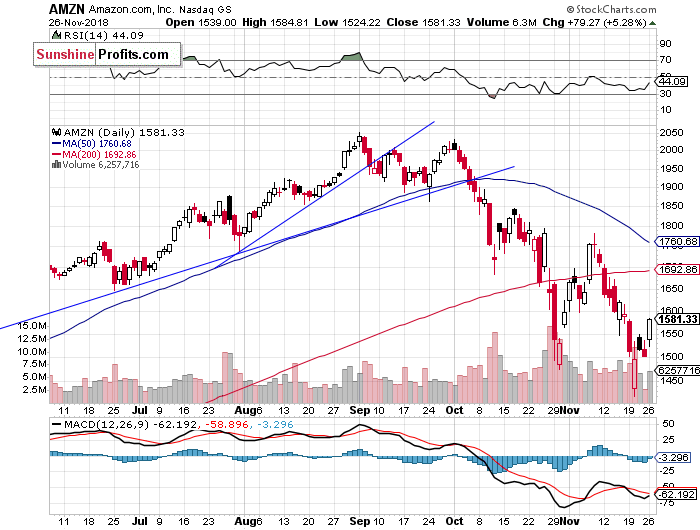
Now let's take a look at Amazon.com, Inc. stock (AMZN) daily chart. It remains relatively stronger, as it retraces the recent sell-off. On Tuesday, the stock fell closer to the price of $1,400, before rebounding off the support level. Was it an upward reversal? The market got back above the resistance level of $1,500:
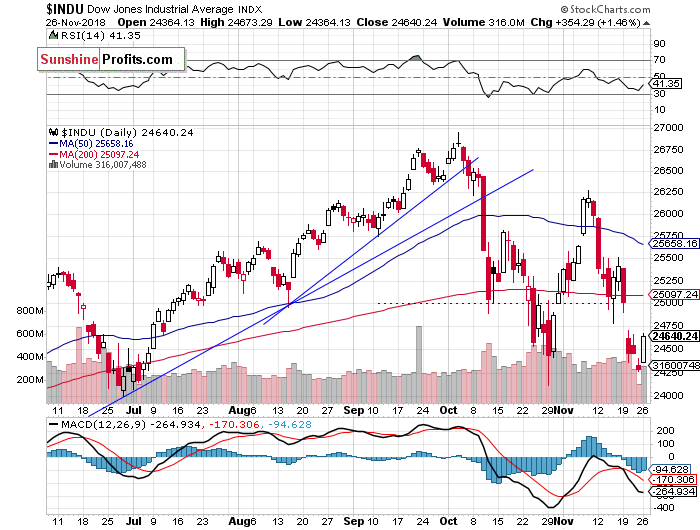
Dow Jones - Short-Term Upward Reversal?
The Dow Jones Industrial Average broke below 25,000 mark on Tuesday a week ago and then it fluctuated along the late October low and the support level of 24,000-24,200. Will it break below that support level? The resistance level is now at 24,750-25,000:
The S&P 500 index retraced most of its recent sell-off yesterday, but it remained within a short-term consolidation. We still can see some short-term oversold conditions that may lead to an upward correction. However, there have been no confirmed positive signals so far.
Concluding, the S&P 500 index will likely open lower today. For now, it looks like a short-term consolidation following the recent downtrend. But if the market breaks above the resistance level of around 2,680, we could see more buying pressure.
Trading position (short-term; our opinion): no positions are justified from the risk/reward perspective.
Thank you.
Paul Rejczak
Stock Trading Strategist
Stock Trading Alerts

