

Briefly:
Intraday trade: The S&P 500 index lost 1.8% on Tuesday, after opening 1.3% lower. The broad stock market will probably open higher today. We may see a short-term rebound. The market will likely fluctuate ahead of the long holiday weekend.
Trading position (short-term; our opinion): no positions are justified from the risk/reward perspective.
Our short-term outlook is neutral, and our medium-term outlook is neutral:
Short-term outlook (next 1-2 weeks): neutral
Medium-term outlook (next 1-3 months): neutral
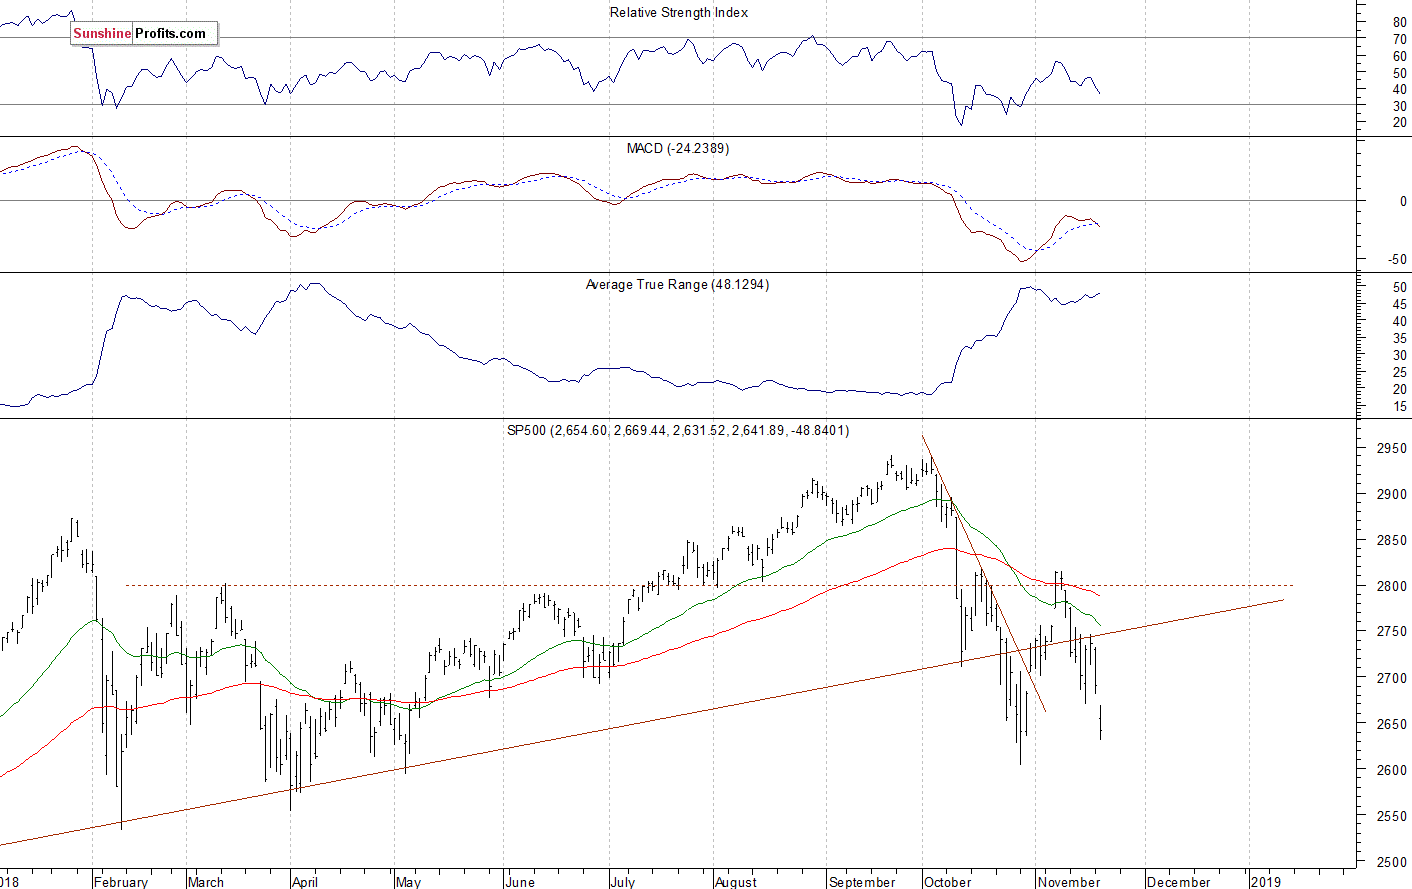
The U.S. stock market indexes lost 1.7-2.2% on Tuesday, as investors' sentiment worsened once again following the recent big cap tech stocks' breakdown. The S&P 500 index got closer to its late October low of 2,603.54. It currently trades 10.2% below September the 21st record high of 2,940.91. The Dow Jones Industrial Average lost 2.3% and the Nasdaq Composite lost 1.7% on Tuesday.
The nearest important level of resistance of the S&P 500 index is now at 2,670-2,680, marked by yesterday's daily gap down of 2,669.44-2,681.09. The next resistance level is at 2,690-2,700, marked by the previous level of support. On the other hand, the level of support is at 2,600-2,630, marked by the late October lows.
The broad stock market got closer to its late October low once again. The S&P 500 index is now trading around 10% below the record high. So will the downtrend continue? Or is this a bottoming pattern before an upward reversal? There have been no confirmed positive signals so far. The market continues to trade below its long-term upward trend line, as we can see on the daily chart:
Positive Expectations, Just Rebound?
Expectations before the opening of today's trading session are positive, because the index futures contracts trade 0.5-0.8% above their yesterday's closing prices. The European stock market indexes have gained 0.4-0.7% so far. Investors will wait for some economic data announcements this morning: Initial Claims, Durable Goods Orders at 8:30 a.m., Michigan Sentiment, Existing Home Sales at 10:00 a.m., Crude Oil Inventories at 10:30 a.m. We can see short-term oversold conditions and the broad stock market will likely retrace some of its yesterday's sell-off. However, there have been no confirmed positive signals so far.
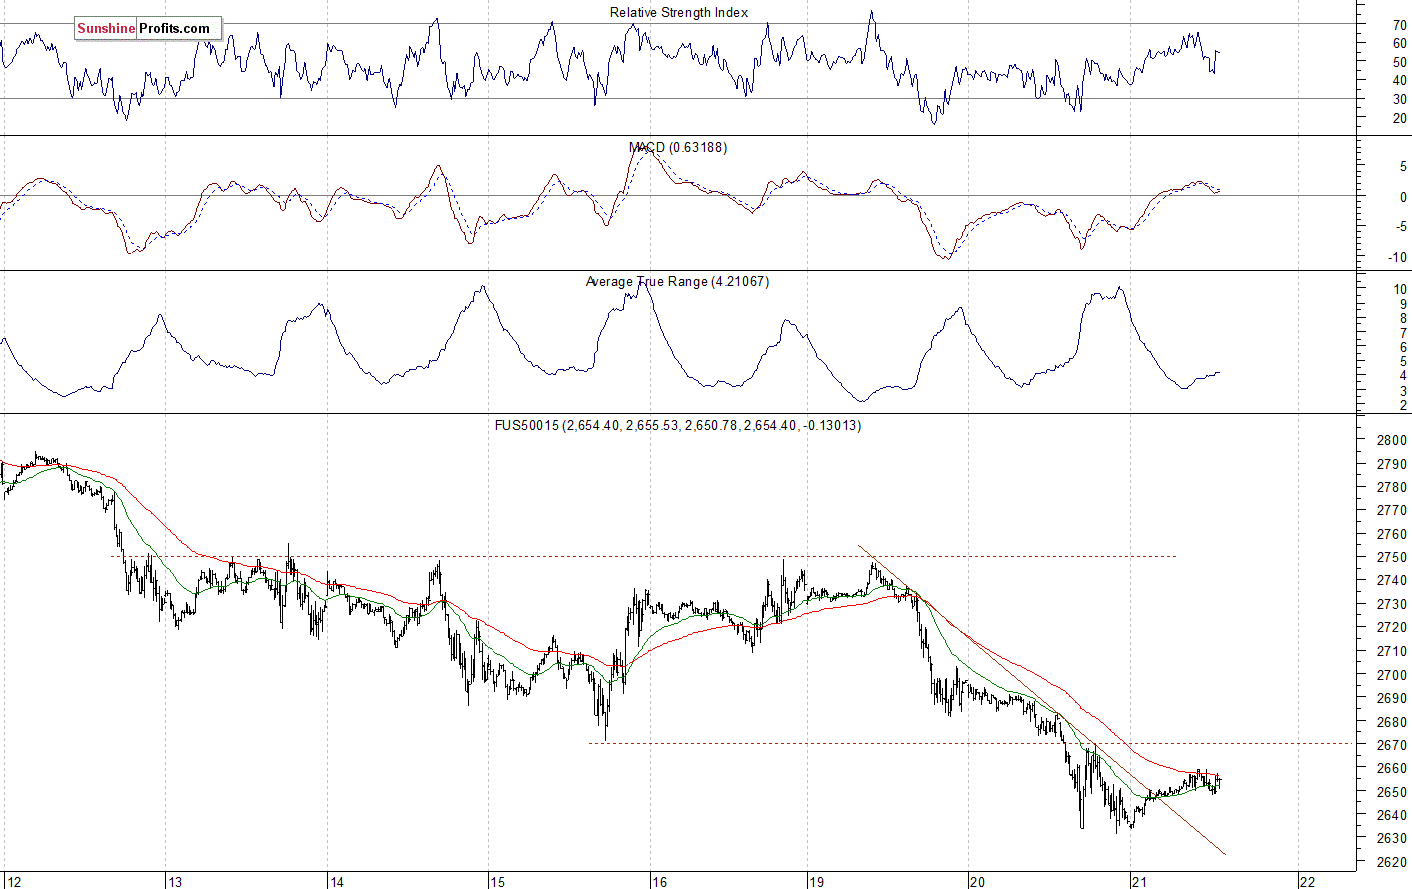
The S&P 500 futures contract trades within an intraday consolidation following yesterday's sell-off and a rebound off the support level. The market is within a relatively flat correction of the recent decline. The nearest important support level is at 2,600-2,630, marked by the late October local lows. On the other hand, the resistance level is at 2,660-2,670, marked by the short-term local highs. The next level of resistance remains at 2,680-2,700. The futures contract trades above its short-term downward trend line, as we can see on the 15-minute chart:
Nasdaq - New Low
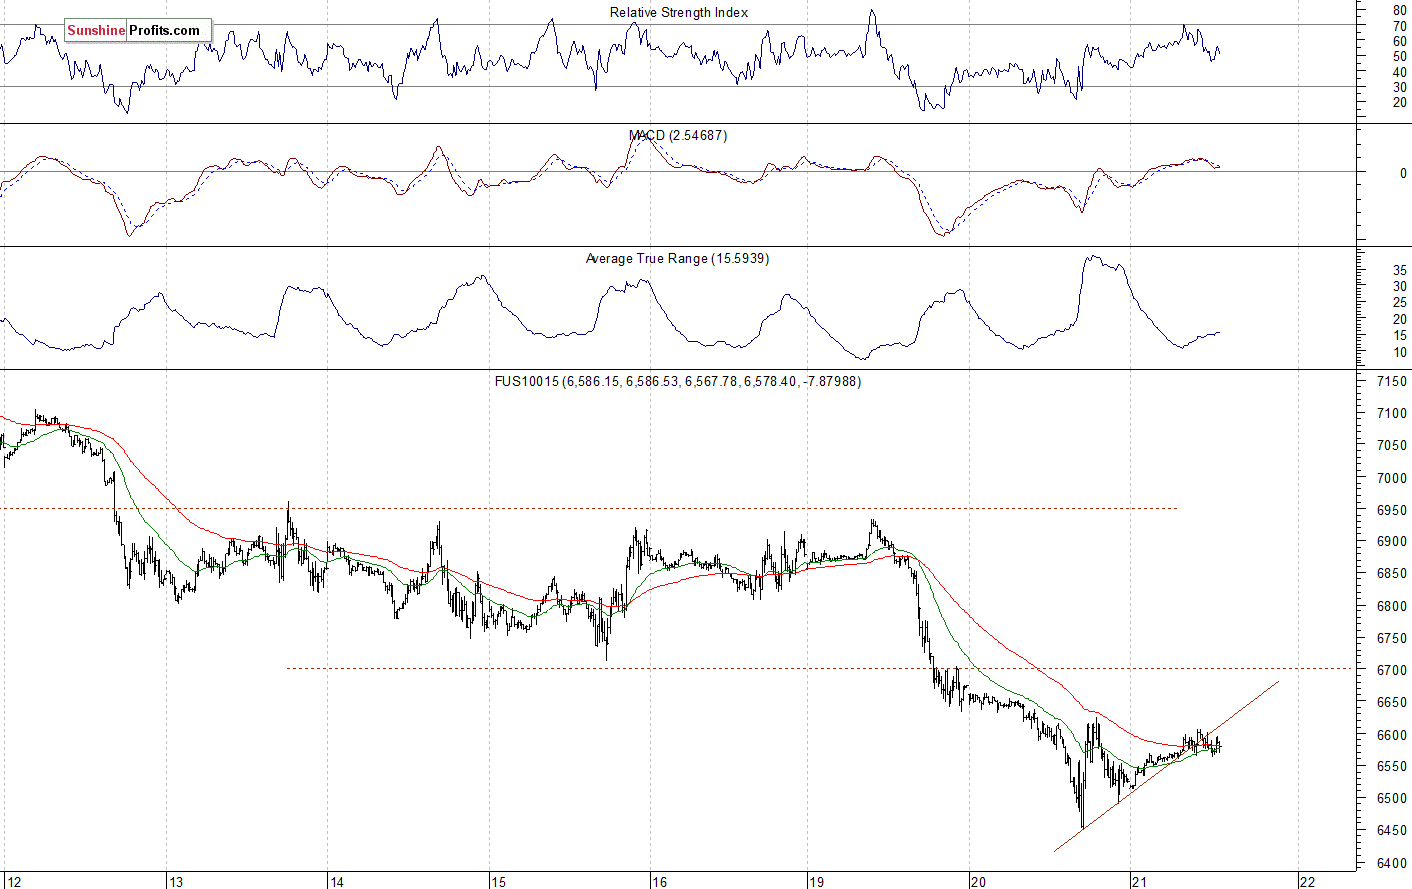
The technology Nasdaq 100 futures contract follows a similar path, as it trades within an intraday consolidation. The tech stocks' gauge accelerated the downtrend yesterday and it reached the new low of around 6,450. It was the lowest since the late April. The nearest important level of resistance is now at 6,600-6,650. On the other hand, the support level remains at 6,450-6,500. The Nasdaq futures contract trades slightly below 6,600 mark this morning, as the 15-minute chart shows:
Big Cap Tech Stocks Deepen Their Losses
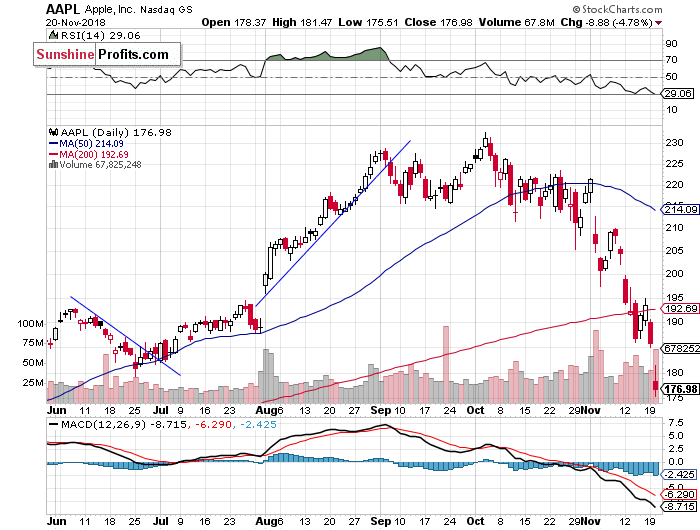
Let's take a look at Apple, Inc. stock (AAPL) daily chart (chart courtesy of http://stockcharts.com). Yesterday the stock accelerated its sell-off following a breakdown below the support level of $185-190. The market may have reached a temporary bottom of around $175. However, there have been no confirmed positive signals so far:
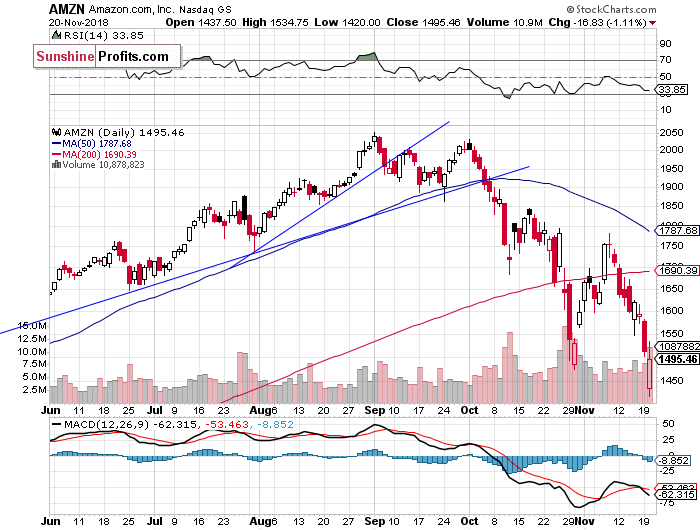
Now let's take a look at Amazon.com, Inc. stock (AMZN) daily chart. It has also accelerated the sell-off yesterday. The stock fell closer to the price of $1,400, before rebounding and closing just 1.1% lower. Was it an upward reversal? The market remains below the nearest important resistance level of $1,500:
Dow Jones Also Lower
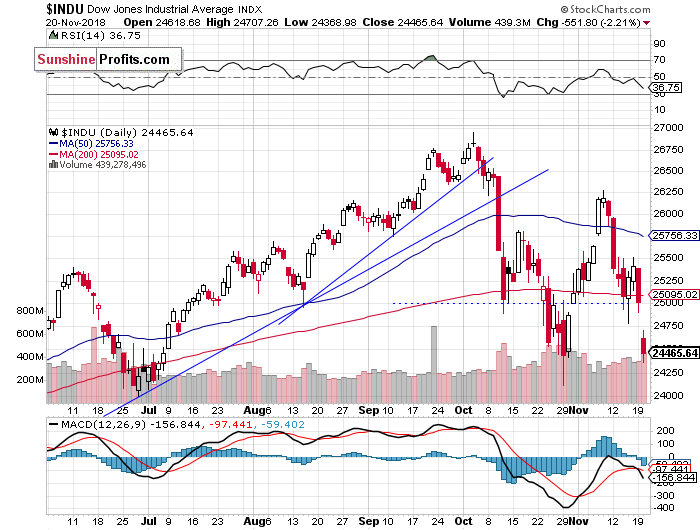
The Dow Jones Industrial Average broke below 25,000 mark yesterday and then it continued towards the late October low and the support level of 24,000-24,200. Will it break below that support level? We can see some short-term oversold conditions, but it doesn't look like a potential upward reversal. The resistance level is now at 25,000:
Japanese Nikkei - Upward Reversal?
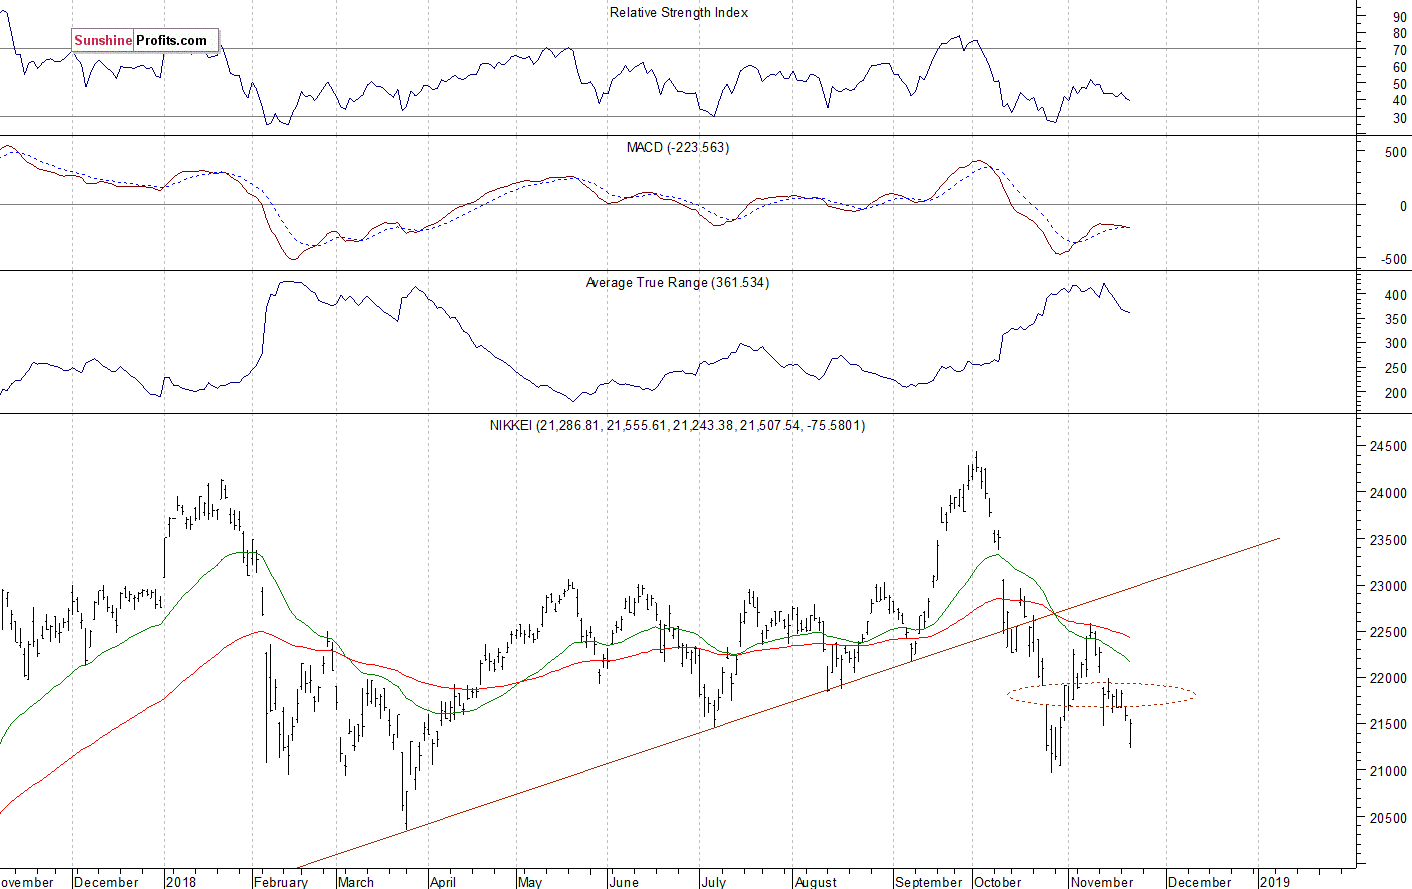
Let's take a look at the Japanese Nikkei 225 index now. It retraced more of its October sell-off recently, but then it failed to continue higher following bouncing off the resistance level at 22,500. Then we saw more downward action. The Nikkei continues to trade below its broken long-term upward trend line. The index retraced most of its intraday sell-off today, so we can see a short-term upward reversal:
The S&P 500 index broke below its last week's local low yesterday, as it accelerated the short-term downtrend. It traded closer to a potential support level of 2,600-2,630, marked by the late October local lows. We can see some short-term oversold conditions that may lead to an upward correction. However, there have been no confirmed positive signals so far.
Concluding, the S&P 500 index will likely open higher today. The market may retrace some more of its yesterday's sell-off. For now, it looks like a consolidation within a downtrend. We may see lower volatility ahead of the long holiday weekend.
Trading position (short-term; our opinion): no positions are justified from the risk/reward perspective.
Thank you.
Paul Rejczak
Stock Trading Strategist
Stock Trading Alerts

