

Greetings everyone!
We have been waiting for pullbacks in several names, and I do like the pullback price action in RZV - Invesco S&P SmallCap 600 Pure Value ETF right now.
This one has been on our list since the June 8th Publication, and we have been looking for meaningful pullbacks. We initially got one on June 18th; to the 50-day simple moving average. However, our focus was primarily on the $SPX at that time, given the interest rate news.
Today, we have once again tested the 50-day SMA (currently $93.88), and intraday it is holding well so far.
The best part is that we have a pullback here in the small-cap value space when other sectors are trading at or near highs.
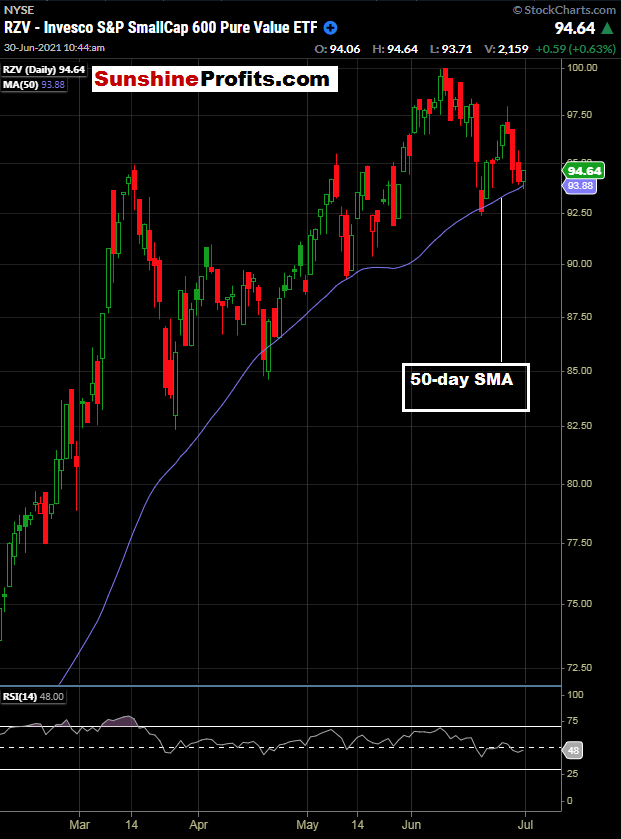
Figure 1 - RZV Invesco S&P SmallCap 600 Pure Value ETF February 4, 2021 - June 30, 2021, Daily Candles Source stockcharts.com
So, in RZV, we have a 6% pullback from its highs coupled with the fact that it is up 41.92% YTD.
This ETF doesn’t do a ton of volume (25K-40K per day), but unless you are trying to add thousands of units, it shouldn’t be a problem.
We do have the NFP data coming up on Friday. A name such as RZV is not hugely volatile, (5-year Beta of 1.73) but it is not the quietest name out there either. It is the type of instrument that I would not mind putting on ahead of the NFP data on Friday. If the market sells off on Friday, I would be looking to add more. If the market goes higher off of Friday’s data, this could be a great entry point in a solid and underappreciated market sector for all of 2021 so far.
For entry suggestions, consider the 50-day SMA near $93.88 to a high level of $94.68 intraday.
The bid-offer spread is a bit wide on this one (approximately 15 cents), so using limit orders is suggested (perhaps at the midpoint of the bid-ask).
I really like this name and have sights set on a breakout over the previous $100 high. I feel that a sector rotation back into small-cap value names will fuel the rise.
I wanted to keep you apprised of the current level in RZV for your consideration in today’s session.
To sum up the current viewpoint and opinion:
I have BUY opinions for:
- Defiance Quantum ETF (QTUM) between $44.00 - $49.50. Update 06/25: This one is still in the upper area of our buy idea zone. Look for pullbacks for entries near the 50-day SMA (currently $47.77). Update 06/26: Last trade $49.85. Do not chase and consider buying pullbacks. Always use a stop loss level that caters to your individual risk tolerance. Update 06/27: This one wants to break $50.00. Always use a stop loss level that caters to your individual risk tolerance.
- Amplify Transformational Data Sharing ETF (BLOK) between the 200-day moving average and $40.00 200-Day Moving Average is currently $40.43 Update 06/25: I have the same outlook here: Bitcoin and crypto have gotten slammed, but I am in no rush. There could be another shoe to drop. Patience. Update 06/26: We never got quite the pullback that we wanted here. Still monitoring for pullbacks to the 200-day SMA .Always use a stop loss level that caters to your individual risk tolerance. Update 06/27:Waiting for pullbacks, still. Always use a stop loss level that caters to your individual risk tolerance.
- Invesco MSCI Sustainable Future ETF (ERTH) between $65 and $66. Update 06/22: Important note on ERTH: This one had me scratching my head on the open yesterday and then I quickly discovered that there had been a $9.95 dividend issued. You can read about the dividend on Invesco’s website here. Call your broker if you have any questions about how the dividend was applied to your account. This dividend was abnormally high for ERTH based on the past. Since $9.95 came out of the stock price in the form of a dividend, we must adjust our pricing outlook by $9.95. I like this name for the longer-term around $65-$65.80 (dividend adjust price) at this time. Update 06/25: I like the theme of this ETF. Look to enter on pullbacks between $65 and $66.00. Update 06/26: Another steady grinder that keeps moving higher. Hold longs and consider buying pullbacks. Update 06/27: If not on board yet, wait for pullbacks. Always use a stop loss level that caters to your individual risk tolerance.
- Invesco Exchange-Traded Fund Trust - S&P SmallCap 600 Pure Value ETF (RZV) on pullbacks. Update 06/22: This one touched the 50-day MA on Friday (we were waiting for that!) and tacked on 2.51% in yesterday’s session. If you didn’t catch the big pullback, look to enter on any pullback from $93 - $94.90. Update 06/25: I still think this has legs. If not on board yet, look for intraday pullbacks in the low to mid $95’s. Update 06/26: In our zone with the last trade at $94.96. Like small caps? Consider long entries if not already long. Update 06/27: See Above! Always use a stop loss level that caters to your individual risk tolerance.
- iShares Global Timber & Forestry ETF (WOOD) Initial buy idea zone between $79.07 and the 200-day moving average ($79.82 as of 06/16 close). Update 06/16: Given the price action in the lumber futures described in today’s alert, consider an entry into ½ of a normal position size between $86.50 - $87.50. Should it pull back further, we can look to add another ½ position size. Update 06/17: WOOD provided the entry opportunity levels that we were looking for on Wednesday and even finished higher on the day. What a great sign. Look to be long on this underappreciated ETF. Update 06/21: WOOD traded through our first tranche level between $86.50 and $87.50. It closed Friday @ $84.15. I am looking at the above-mentioned price levels between $79.16 and $79.82 - $80.00 for the second tranche. See Above. Update 06/22: Wood tacked on 2.33% yesterday. Hold longs and look to add between $79.16 - $80.00. Update 06/25: Hold existing longs and look to add between $79.16 - $80.00. Update 06/26: Hold existing longs and look to add between $79.16 - $80.00. Always use a stop loss level that caters to your individual risk tolerance. Update 06/27: No change in outlook here and this one has held up very nicely. Look to add the 2nd tranche between $80.83 (200-day SMA) and $80.00.
- Invesco Solar ETF (TAN) between the 50-day moving average ($80.32 as of June 14th) and $81.50. Look for an intraday pullback for entry. Update 06/16: We wanted a pullback, and we got a big one on Tuesday, with the range being $78.00 - $80.69. Ideally, this was taken advantage of on this pre-Fed meeting day. There could have been some “sell the news” price action with the SEIA report being released yesterday. Although we are below the 50-day MA, I like the previous consolidation and would look to be long at these levels. Update 06/17: TAN tacked on 1.51% in Wednesday’s overall down session. Great sign. I like this one and I think there is still time to get on board. Always use a stop loss level that caters to your individual risk tolerance. Update 06/21: We really nailed this entry and I am looking for continued upside. I think there is still time to get on board - look for pullbacks near the $81.00 level. I like this for a longer-term holding with price appreciation potential north of $100.00. Update 06/22: I think there is still time to get on board: look for pullbacks approaching the 50-day SMA of $79.75 - $81.00 for long entries. I like this one for a longer-term move above $100.00. Update 06/25: I continue to love TAN. This one has been up and up. If you are still not on board, look for pullbacks and do not chase. The current 50-day SMA is $79.72. $80 - $82 would be a nice level to initiate or add. Shorter-term traders note the 200-day moving average that acted as resistance on Friday near $86.19. Since I like this one for the longer-term, I would prefer to hold through any pullbacks.
- 06/26: SEE ABOVE FOR DETAILS TODAY Update 06/27: As mentioned yesterday, this one got a bit short-term overbought and we suggested short-term traders to exit near $91.42. We are getting a pullback today to $89.47 the last time I checked. Eye the 200-day moving average (currently $86.75) as a spot to consider getting long or adding.
- Always use a stop loss level that caters to your individual risk tolerance.
- First Trust NASDAQ Clean Edge Smart Grid Infrastructure Index Fund (GRID). GRID has traded through our idea range of between $86.91 and $88.17. Update 06/17: GRID closed at $91.50 yesterday, moving lower on the overall down day. I see no major technical damage and like this one over the longer run. Opinion: hold existing longs and/or look for entries on pullbacks. Update 06/22: Another one that briefly touched the 50-day SMA. Did you get it? If not I like it anywhere below $91 - look to enter on pullbacks. I am looking for $100 level or maybe higher in the longer term. Update 06/25: I still love GRID too. It has been a steady Eddie. Do not chase though, perhaps we get a pullback to the $90 level if you are not long yet. Update 06/26: Consider buying on a pullback to $90, if not long yet. Update 06/27: No change and look to $90 level for potential entries if not already long. Always use a stop loss level that caters to your individual risk tolerance.
I have SELL opinions for:
NONE
I have a HOLD opinion for:
NONE
Your readership is valued and appreciated. Let’s keep identifying meaningful pullbacks and focus on execution. Have a great day!
Thank you,
Rafael Zorabedian
Stock Trading Strategist

