

The US Federal Reserve has raised its interest rate guidance for 2023; and potentially late 2022. Oddly enough, interest rates have moved lower since the last Fed meeting.
I see an opportunity today.
You would think that the higher interest rate guidance would have created a bump higher in the $TNX (Ten-Year Note Yield). However, wouldn’t that make too much sense? The more trading experience I have gotten over the last two decades, the clearer it is, that logic doesn’t always work - unless you are early enough.
If you have been following along, you know that yesterday, I discussed the S&P Banking sector, namely KBE, as we wait for a pullback to some key technical levels.
It got me thinking: the Ten-Year Note yield should be very similar to that trade.
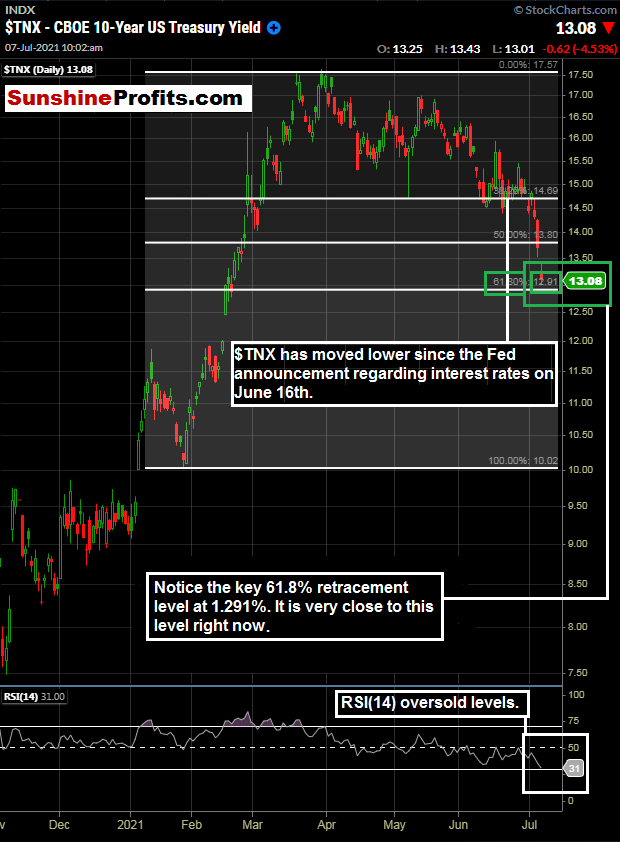
Figure 1 - Ten-Year Treasury Note Yield November 3, 2020 - July 7, 2021, 10:10 AM, Daily Candles Source stockcharts.com
We can see that the 10-year note yield has declined since June 16th’s Fed meeting. We are approaching daily oversold levels via the RSI(14). I think it is safe to say that many traders that took this trade (especially with leverage) have reached or are reaching their point of maximum pain. Notice how this chart looks very similar to the chart regarding KBE in yesterday’s publication.
Higher interest rates can create net interest margin expansion for banks and can boost the bottom line. Lower rates may have contributed to the fall in KBE over the last few weeks.
But Wait, There’s More
There were simply too many technical indicators to fit on one chart on this one. So, let’s take another look at interest rates, but this time in the form of TLT iShares 20+ Year Bond ETF. Let’s further out in time with daily candles here.
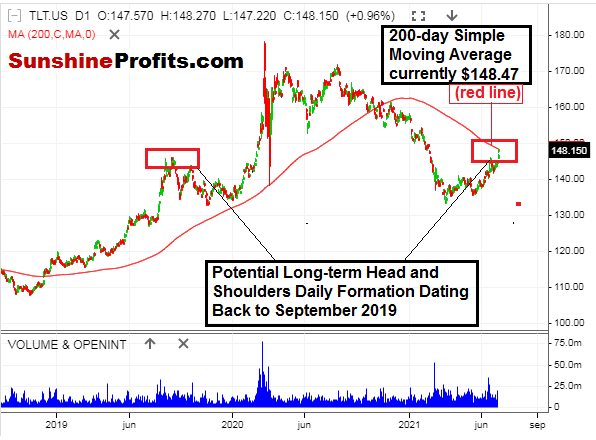
Figure 2- TLT iShares 20+ Year Bond ETF September 10, 2018 - July 7, 2021, DailyCandles Source stooq.com
I like the fact that numerous indicators are showing that interest rates may be due to head back in the “correct” direction. We have a long-term potential head and shoulders pattern, the 200-day moving average in TLT. We also have the key 61.8% Fibonacci retracement level in $TNX. Putting all of this together makes sense for a trade opportunity.
Perhaps since most traders that took the “logical” trade on the Fed announcement back on June 16th have had enough and reached a point of maximum pain, it can be our turn for a trade.
There are indeed numerous ways that a trader can trade interest rates. There are different products, durations, and instruments. Many traders are not familiar with interest rate futures; they are quoted differently and have margin requirements that may not be suitable for many traders.
I happen to like the TLT as the preferred instrument here. It is the longer end of the curve (20+ years) and is extremely liquid. The longer end of the yield curve can provide more price volatility versus the shorter end, and I strongly like the longer-term head and shoulders pattern that could be forming in the TLT.
Putting all of this together makes me consider Selling TLT when the $TNX trades between 1.291% - 1.310% or at the 200-day near moving average of TLT ($148.47). Let's call it $148.47 - $148.00.
It looks like this TLT trade could be triggered at any time today.
To sum up the current viewpoint and opinion:
I have BUY opinions for:
- SPDR S&P Bank ETF (KBE) between $48.11 - $49.39. Update 07/07: I have updated this range a bit higher today. I feel like today could be the day to get long KBE and short TLT. Let’s see how the rest of the day plays out. See the detailed analysis above. Wait for the pullback, I think we will see one. Always use a stop loss level that caters to your individual risk tolerance.
- Defiance Quantum ETF (QTUM) between $44.00 - $49.50. Update 07/07: We have a pullback to approximately $48.80 today here. Consider using a pullback to get long, if you are not already. This one wants to break $50.00 - it is close. This is a play in automation, robotics, and AI. Try to get it on a pullback instead of buying the very top of the range. Always use a stop loss level that caters to your individual risk tolerance.
- Amplify Transformational Data Sharing ETF (BLOK) between the 200-day moving average and $40.00 200-Day Moving Average is currently $41.12 Update 07/07:Waiting for pullbacks, still. Always use a stop loss level that caters to your individual risk tolerance.
- Invesco MSCI Sustainable Future ETF (ERTH) between $65 and $66. Update 07/07: If not on board yet, wait for pullbacks between the $65 and $66 level. Always use a stop loss level that caters to your individual risk tolerance.
- Invesco Exchange-Traded Fund Trust - S&P SmallCap 600 Pure Value ETF (RZV) on pullbacks. Update 07/07: This one is moving lower today, as small-caps seem to have fallen temporarily out of favor. Consider using today’s pullback to get long, if you are not already. Always use a stop loss level that caters to your individual risk tolerance.
- iShares Global Timber & Forestry ETF (WOOD) Initial buy idea zone between $79.07 and the 200-day moving average ($80.94 as of 07/01). Update 7/06: No change in outlook here and this one has held up very nicely. Look to add the 2nd tranche between $81.24 (200-day SMA) and $80.00. Always use a stop loss level that caters to your individual risk tolerance.
- Invesco Solar ETF (TAN) Update 07/07: Catching a bump today. I still love TAN for the longer haul and am looking for pullbacks. Same Suggestion: If not long already, or looking to add to a position, consider the 200-day moving average (currently $87.24) as a spot to consider getting long or adding. Always use a stop loss level that caters to your individual risk tolerance.
- First Trust NASDAQ Clean Edge Smart Grid Infrastructure Index Fund (GRID). Update 07/07: No change to outlook and consider a pullback to $90 level for potential entries if not already long. Always use a stop loss level that caters to your individual risk tolerance.
I have SELL opinions for:
- iShares 20 Plus Year Treasury Bond ETF (TLT) $TNX trades between 1.291% - 1.310% or at the 200-day near moving average of TLT ($148.47). Let's call it $148.47 - $148.00.
I have a HOLD opinion for:
NONE
Thanks for reading today’s Stock Trading Alert. Your readership is valued and appreciated. Be patient, disciplined, and wait for the market to come to you.
Thank you,
Rafael Zorabedian
Stock Trading Strategist

