

Briefly:
Intraday trade: The S&P 500 index gained 0.4% on Tuesday, after opening 0.3% lower. The broad stock market will likely open virtually flat today. We may see some short-term uncertainty, but the market should remain above the support level of around 2,800. We prefer to be out of the market, avoiding low risk/reward ratio trades.
Medium-term trade: In our opinion, no medium-term positions are justified.
Our intraday outlook is neutral. Our short-term outlook is neutral, and our medium-term outlook is neutral:
Intraday outlook (next 24 hours): neutral
Short-term outlook (next 1-2 weeks): neutral
Medium-term outlook (next 1-3 months): neutral
The U.S. stock market indexes gained between 0.2% and 0.6% on Tuesday, as investors' sentiment improved despite negative pre-session expectations following Monday's Netflix's quarterly earnings release. The S&P 500 index reached the highest since the early February, as it broke above the level of 2,800. It currently trades just 2.2% below the January's 26th record high of 2,872.87. The Dow Jones Industrial Average gained 0.2% and the technology Nasdaq Composite gained 0.6% on Tuesday. The technology stocks' gauge has reached new record high yesterday.
The nearest important level of support of the S&P 500 index is now at around 2,790-2,800, marked by the previous resistance level. The next level of support is at 2,780-2,785, marked by the recent local lows. The support level is also at 2,765-2,770, marked by last week's Wednesday's local low along with last week's Monday's daily gap up of 2,764.41-2,768.51. On the other hand, the resistance level is at around 2,810-2,815, marked by February the 2nd daily gap down of 2,808.92-2,812.70. The next important level of resistance is at 2,840, marked by January the 30th daily gap down of 2,837.75-2,851.48.
The broad stock market extended its short-term uptrend yesterday, as the S&P 500 index broke above the level of 2,800. It gets closer to the January topping pattern of around 2,840-2,870. Will it continue towards new record highs? There are still two possible medium-term scenarios - bearish that will lead us below the February low following trend line breakdown, and the bullish one in a form of medium-term double top pattern or a breakout towards 3,000 mark. The latter one is getting more and more real. The S&P 500 index seems to be "climbing a wall of worries" here:
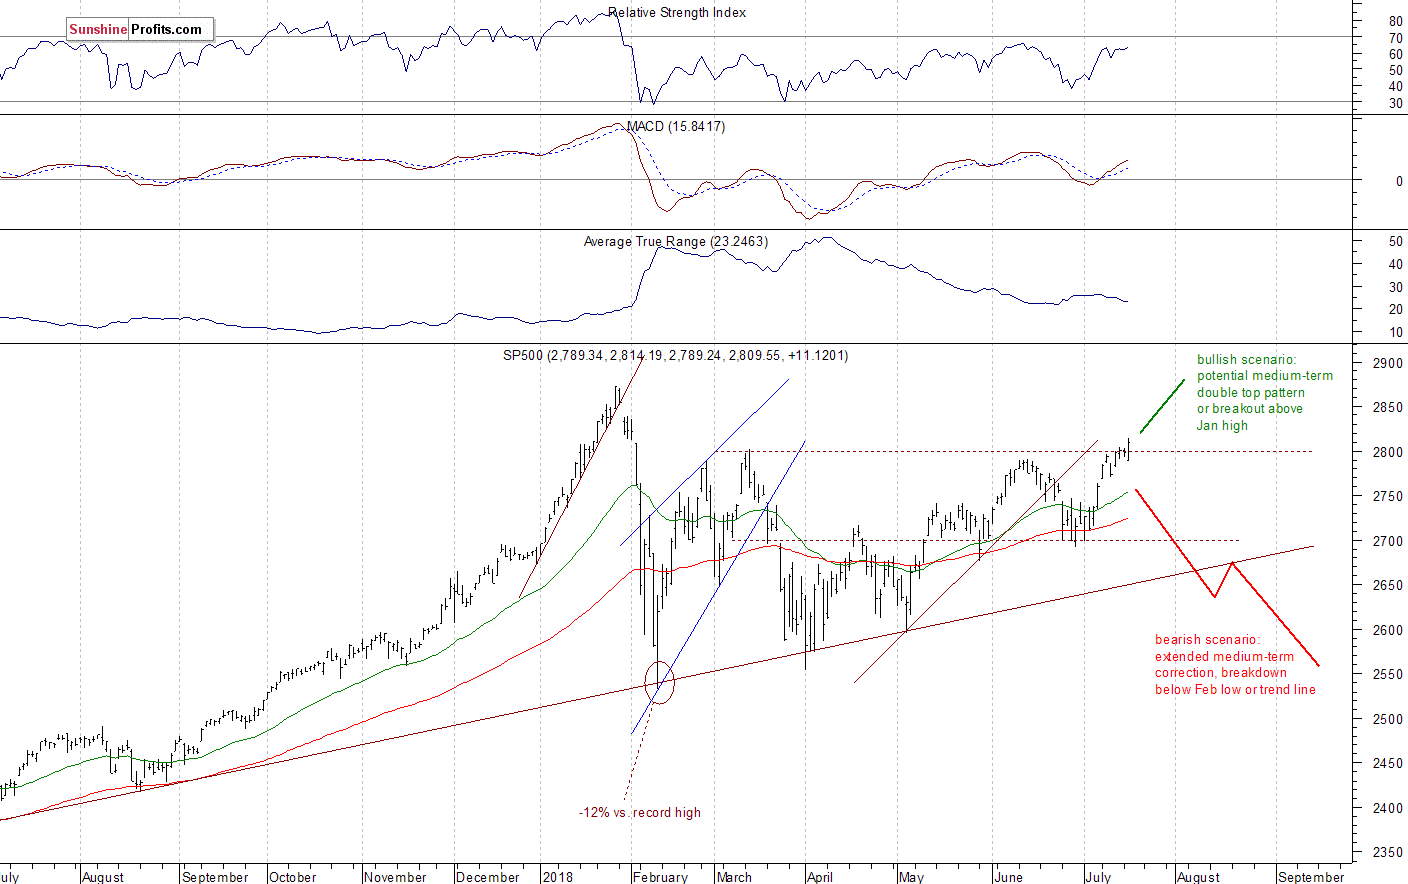
Above 2,800 Mark
Expectations before the opening of today's trading session are virtually flat, because the index futures contracts trade between -0.1% and +0.1% vs. their yesterday's closing prices. The European stock market indexes have gained 0.5-0.7% so far. Investors will wait for some economic data announcements today: Building Permits, Housing Starts at 8:30 a.m., Crude Oil Inventories number at 10:30 a.m., the Fed's Beige Book release at 2:00 p.m. Investors will also wait for more quarterly earnings releases. The S&P 500 index will probably fluctuate following yesterday's breakout above 2,800 mark. There have been no confirmed negative signals. So the broad stock market may continue higher and towards the mentioned January's topping pattern resistance levels.
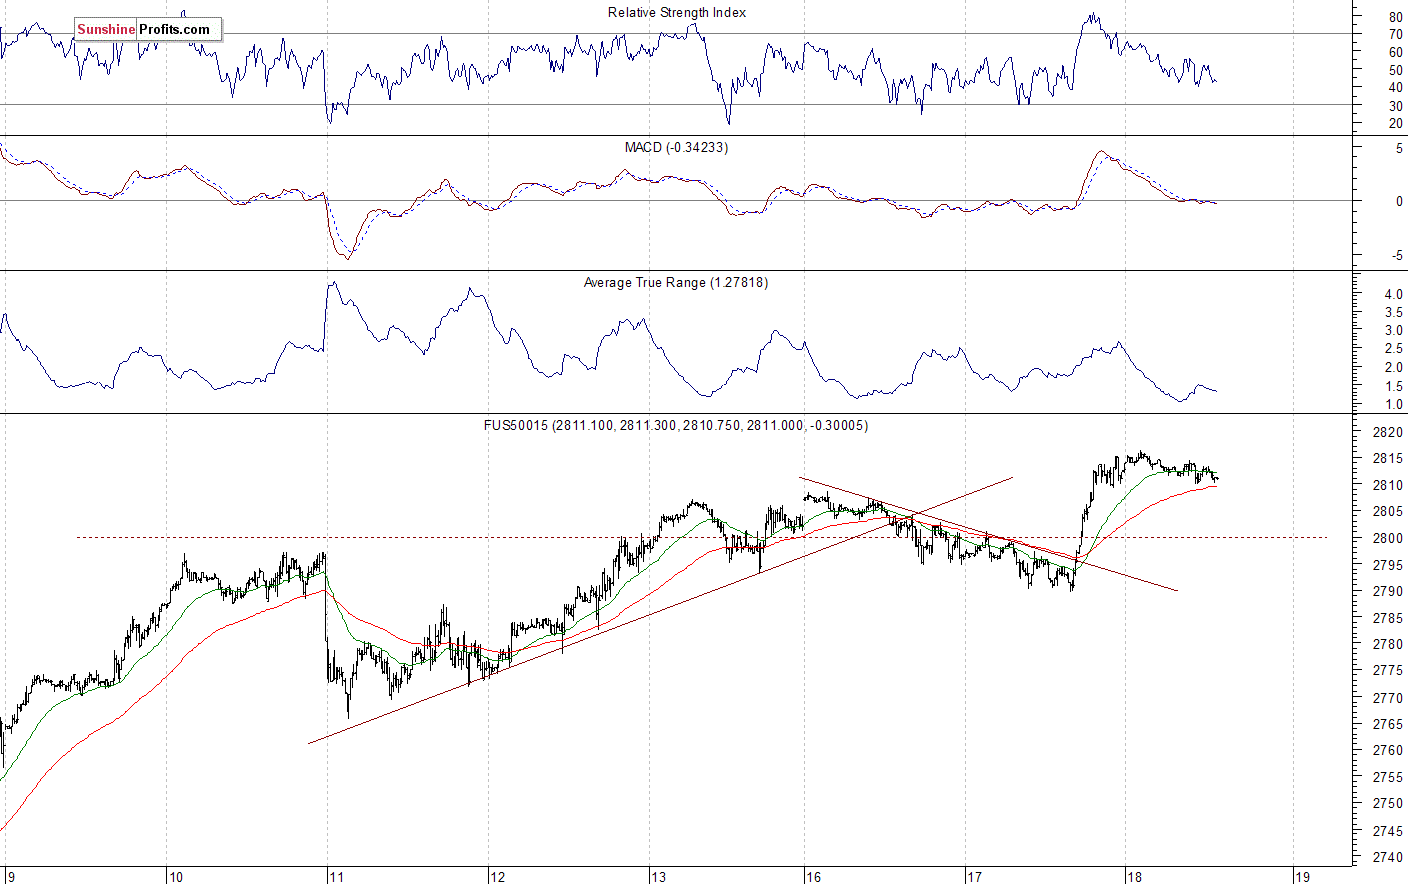
The S&P 500 futures contract trades within an intraday consolidation following its yesterday's advance. The market bounced off support level of around 2,785-2,790, and then it continued higher above the level of 2,800. The nearest important level of resistance is now at around 2,815, marked by the local high. On the other hand, the support level is at 2,800. The futures contract is within a relatively narrow trading range this morning, as we can see on the 15-minute chart:
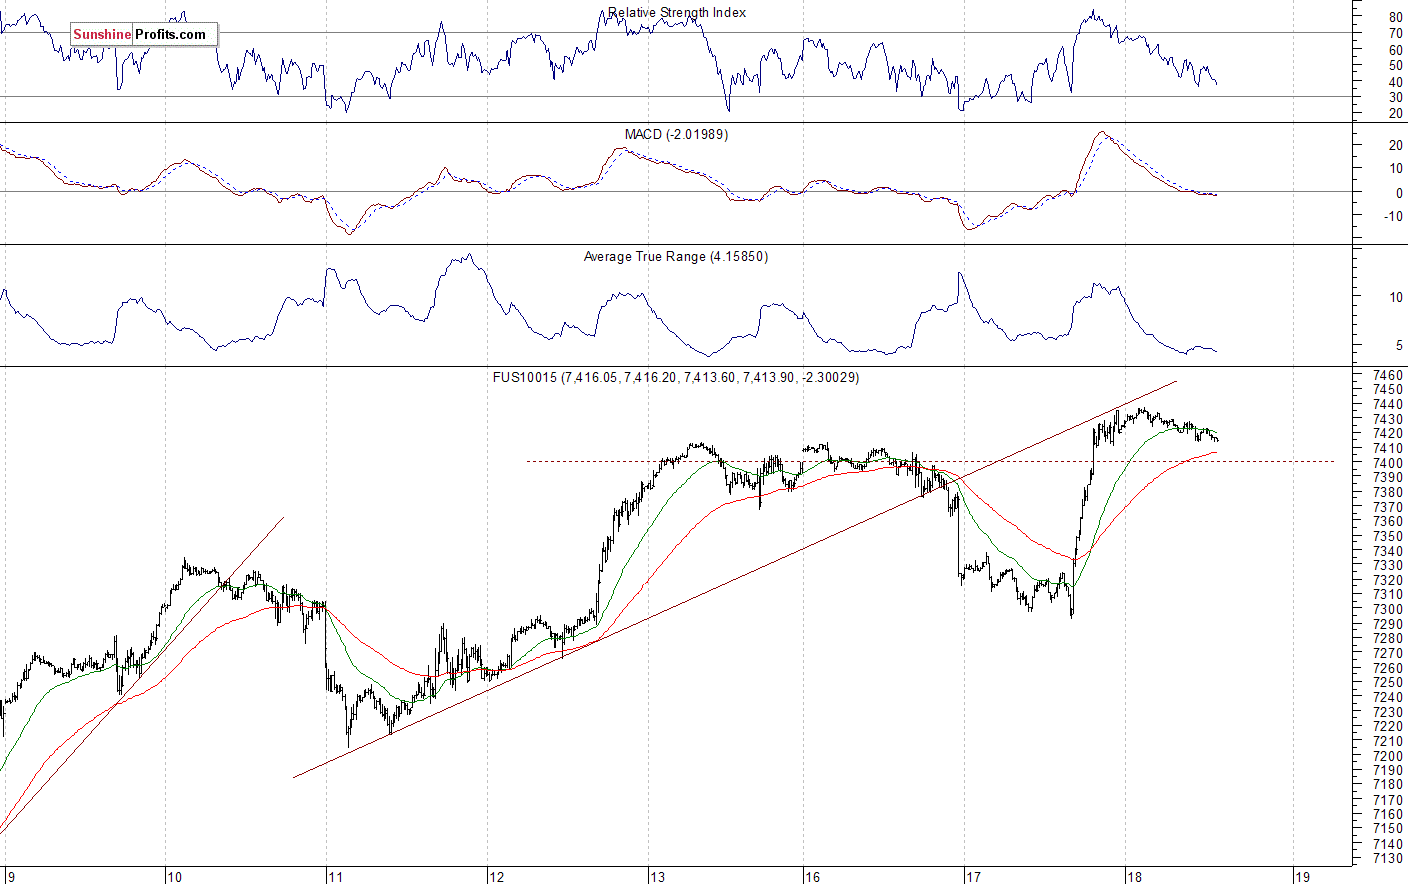
Nasdaq Reaches New Record High
The technology Nasdaq 100 futures contract follows a similar path, as it extends its short-term uptrend. The market reached new record high of around 7,437 yesterday. Potential level of resistance is now at around 7,450-7,500. On the other hand, support level is at 7,370-7,400, marked by the recent fluctuations. The Nasdaq futures contract trades along its new record high, as the 15-minute chart shows:
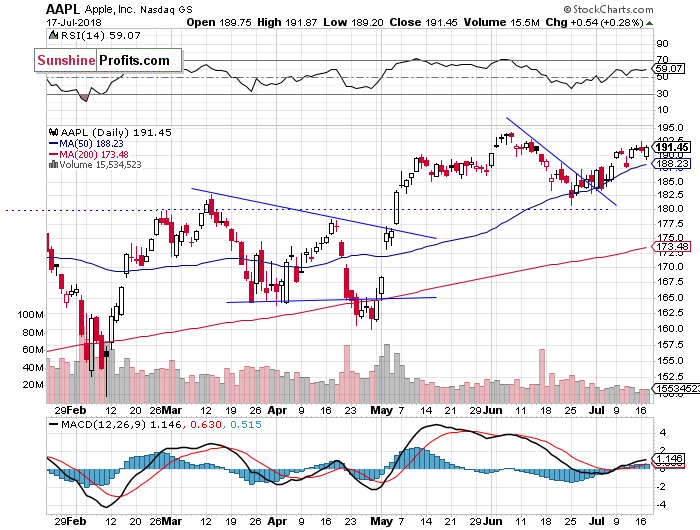
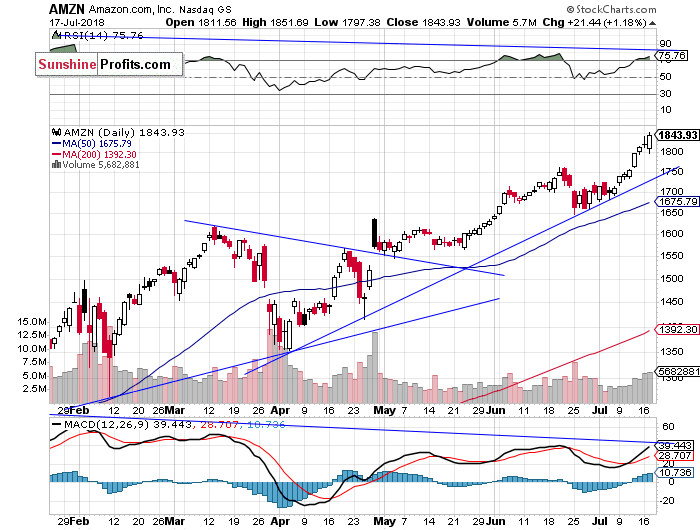
Amazon Extends the Bull Market While Apple Goes Sideways, Awaiting Earnings Releases
Let's take a look at Apple, Inc. stock (AAPL) daily chart (chart courtesy of http://stockcharts.com). The stock slightly extended its advance last week, but it still trades at the resistance level of around $190-195. On the other hand, support level remains at around $185, marked by the previous level of resistance:
Now let's take a look at Amazon.com, Inc. stock (AMZN) daily chart. It reached another new record high yesterday at the price of $1,851.69. The bull market seems unstoppable here, but there are still negative medium-term technical divergences. However, there have been no confirmed negative signals so far:
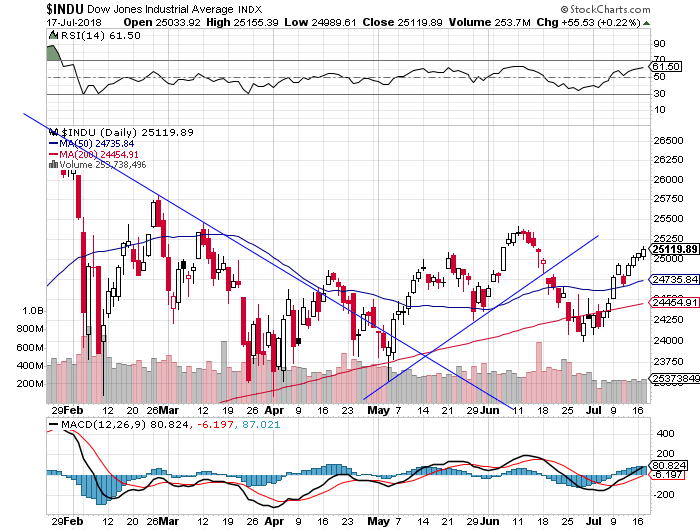
Dow Jones Creeping Higher
The Dow Jones Industrial Average extended its short-term uptrend yesterday, following the recent breakout above the level of 25,000. The market gets closer to the early June topping pattern. We may see some uncertainty there:
The S&P 500 index broke above the level of 2,800 yesterday. The bulls regained their strength following lower opening of the trading session. So the broad stock market continued retracing its January's-February's sell-off. But will it reach new record highs? There have been no confirmed negative signals so far. However, we may see some short-term uncertainty today.
Concluding, the broad stock market will likely open virtually flat today. The S&P 500 index may fluctuate along the level of 2,800 for a while. Investors will wait for some economic data announcements along with quarterly earnings releases.
Currently, we prefer to be out of the market, avoiding low risk/reward ratio medium-term trades. We will let you know when we think it is safe to get back in the market.
To summarize: no medium-term positions are justified from the risk/reward perspective at this moment.
Intraday trade:
No intraday position is justified from the risk/reward perspective today.
No medium-term position is justified from the risk/reward perspective at this moment.
Thank you.
Paul Rejczak
Stock Trading Strategist
Stock Trading Alerts

