

Briefly:
Intraday trade: The S&P 500 index lost 1.7% on Friday, after opening 1.4% lower. The broad stock market will probably open higher today. We may see a bounce towards the previous support level of 2,700 or more short-term fluctuations. There have been no confirmed positive signals so far.
Trading position (short-term; our opinion): no positions are justified from the risk/reward perspective.
Our short-term outlook is neutral, and our medium-term outlook is neutral:
Short-term outlook (next 1-2 weeks): neutral
Medium-term outlook (next 1-3 months): neutral
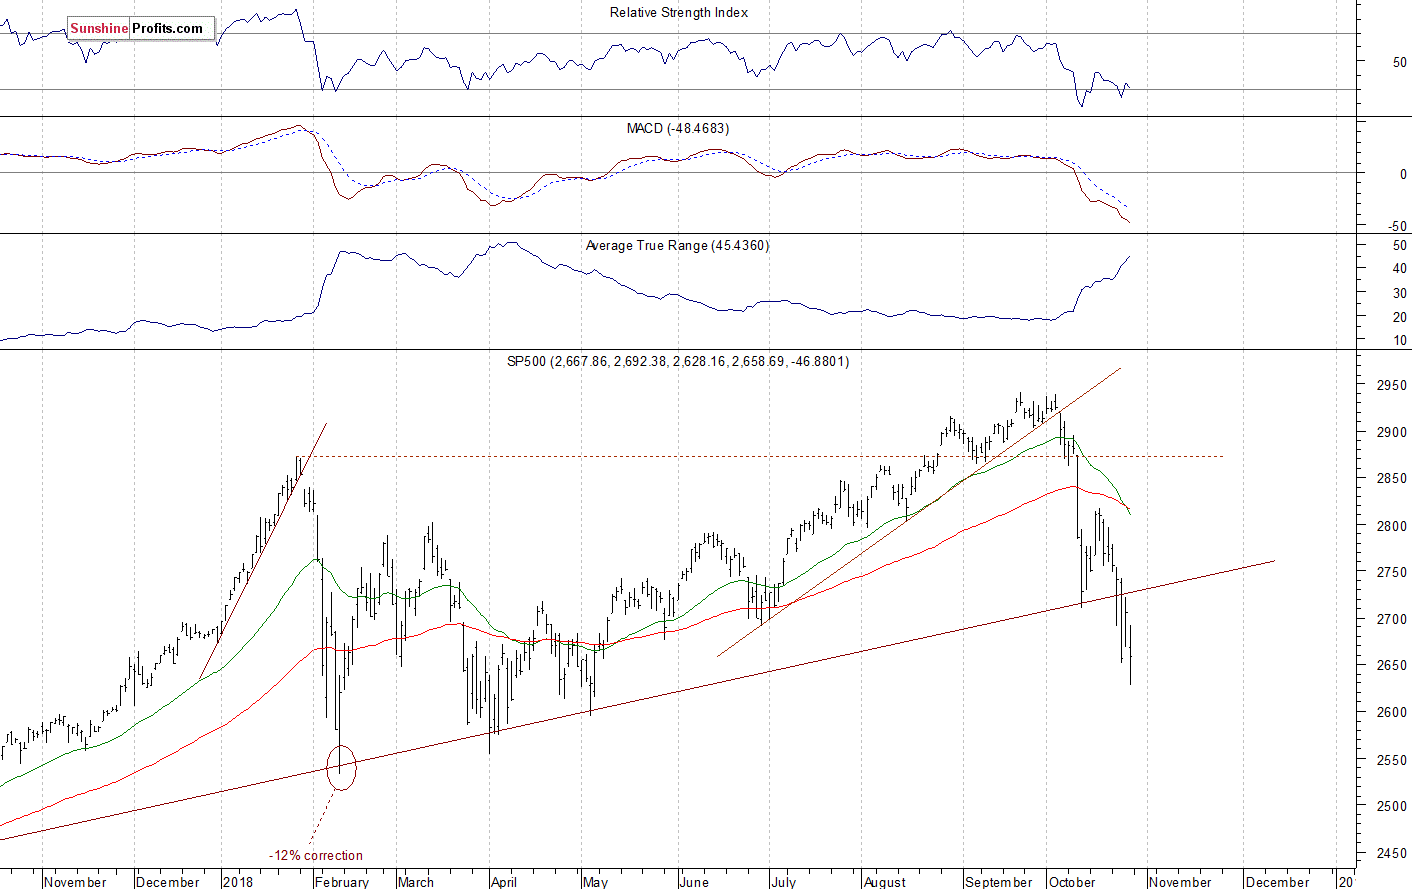
The U.S. stock market indexes lost between 1.2% and 2.1% on Friday, following Thursday's quarterly earnings releases from Amazon and Alphabet. The S&P 500 index has reached the new medium-term low at the level of 2,628.16. It was 10.6% below September the 21st record high of 2,940.91. It currently trades 9.6% below the all-time high. The Dow Jones Industrial Average lost 1.2% and the Nasdaq Composite lost 2.1% on Friday.
The nearest important level of resistance of the S&P 500 index is now at around 2,690-2,700, marked by the previous support level. The next resistance level is at 2,730, marked by the long-term upward trend line. The resistance level is also at 2,750-2,760. On the other hand, the support level is at 2,630-2,650. The level of support is also at around 2,600, marked by the early May local low of 2,594.62.
The broad stock market continued the downtrend on Friday, as the S&P 500 index fell below its Wednesday's local low. There have been no confirmed positive signals so far. However, we could see an attempt at reversing higher here. The S&P 500 index fell almost 11% off its late September record high, so the downward correction is still slightly smaller than January's-February's sell-off of 12%:
Positive Expectations, Reversal or Just Bounce?
Expectations before the opening of today's trading session are positive, because the index futures contracts trade 0.4-1.0% above their Friday's closing prices. The European stock market indexes have gained 0.3-1.8% so far. Investors will wait for some economic data announcements this morning: Personal Income, Personal Spending, Core PCE Price Index at 8:30 a.m. Investors will also wait for more quarterly earnings releases. The broad stock market will likely retrace some of its Friday's decline today. We may see an attempt at getting closer to 2,700 mark again (S&P 500 index). We can still see short-term technical oversold conditions.
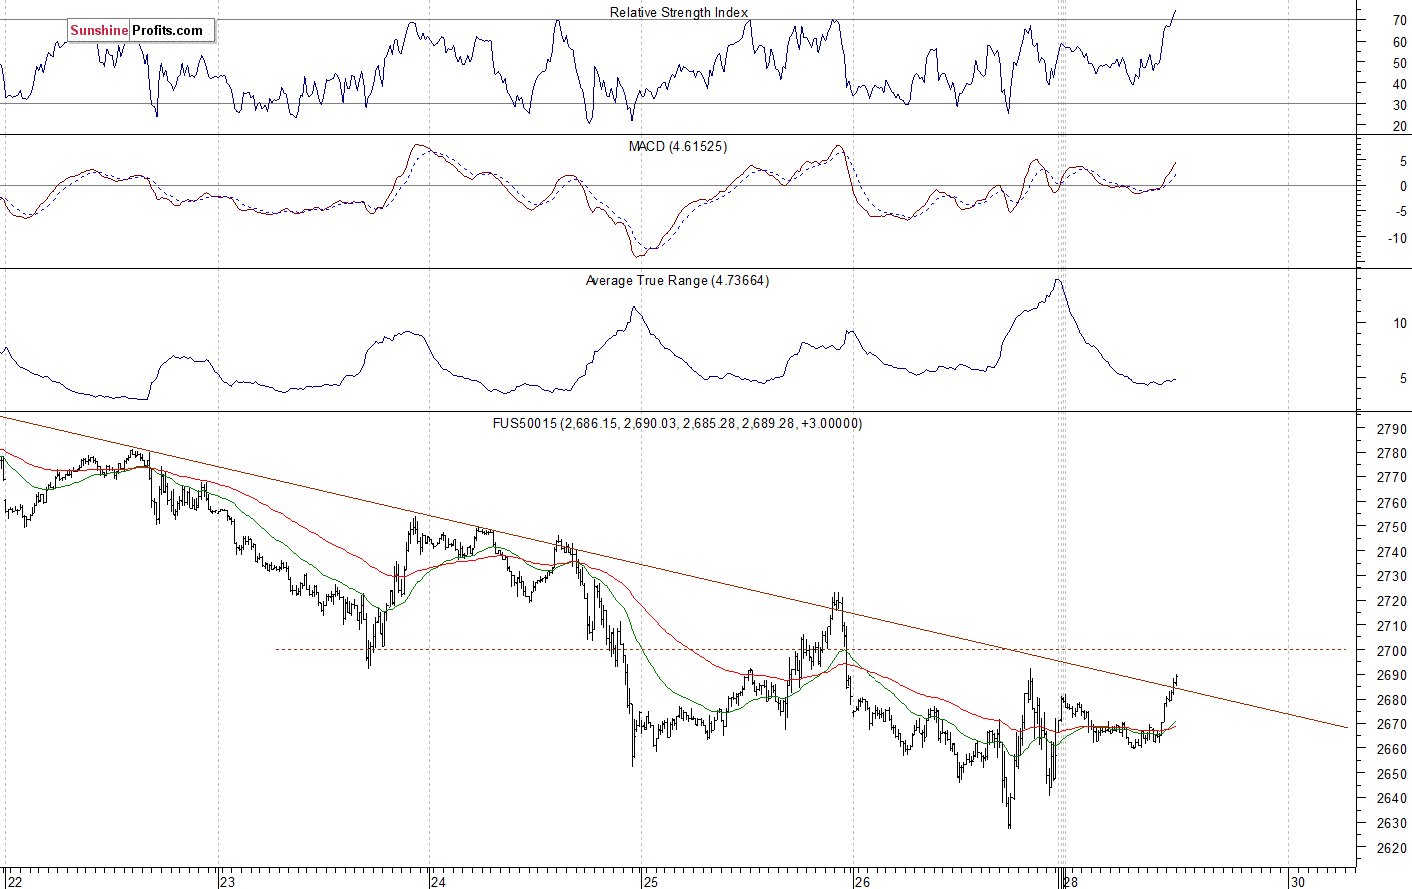
The S&P 500 futures contract trades within an intraday uptrend, as it extends its overnight advance. The nearest important level of support remains at 2,625-2,650. On the other hand, the resistance level is at 2,680-2,700, among others. The futures contract is now slightly above its short-term downward trend line, as the 15-minute chart shows:
Nasdaq Also Higher
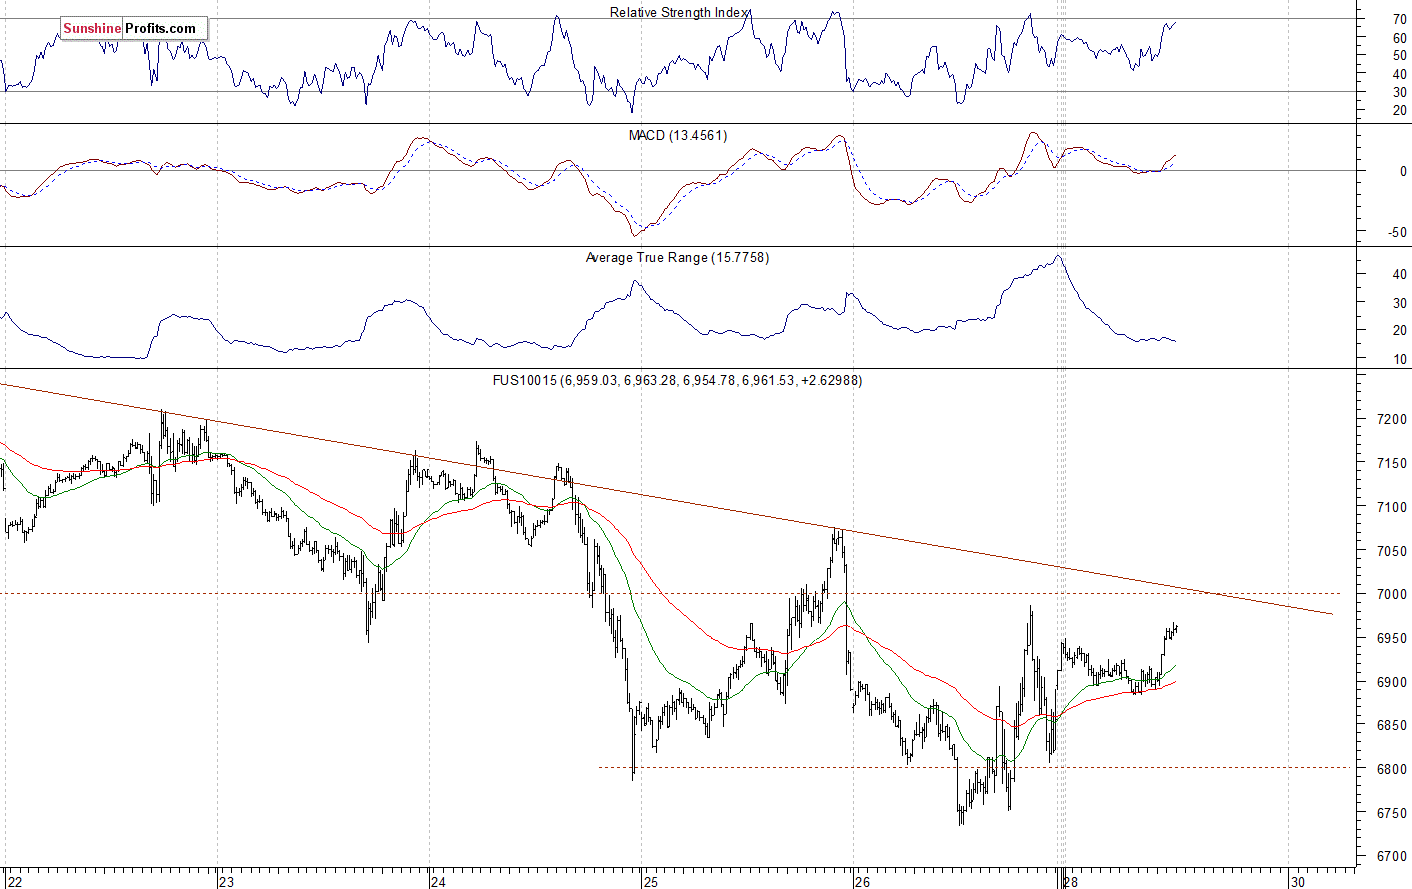
The technology Nasdaq 100 futures contract follows a similar path, as it trades within an intraday uptrend. The market reached the new low at around 2,627 on Friday. So it fell almost 1,100 points off its October the 1st record high above the level of 7,700. We could see more short-term volatility. The nearest important level of resistance is now at around 6,950-7,000. On the other hand, the support level is at 6,800-6,850, among others. The Nasdaq futures contract extends its fluctuations along the level of 6,800-7,000, as we can see on the 15-minute chart:
Apple Without a Scratch While Amazon Crashes
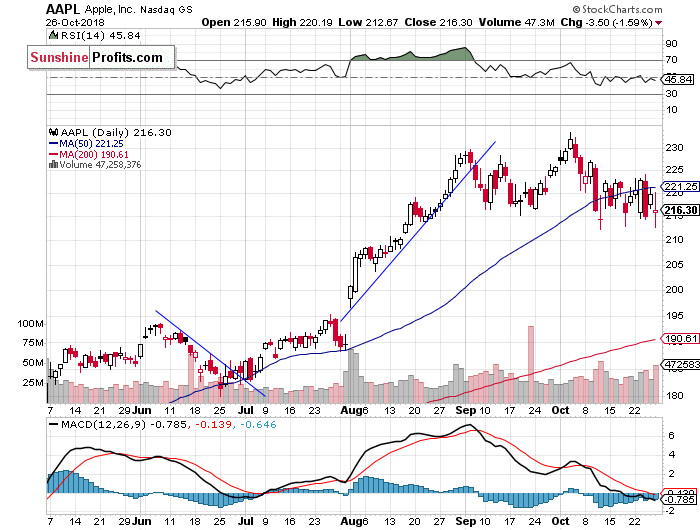
Let's take a look at Apple, Inc. stock (AAPL) daily chart (chart courtesy of http://stockcharts.com). It reached the new record high at the level of $233.47 in the early October, as it continued to act relatively strong. Then the stock retraced the short-term rally. The support level remains at around $215, and the price keeps bouncing off that level despite the overall stock market weakness. Investors will wait for the quarterly earnings release on November the 1st. For now, it looks like a consolidation:
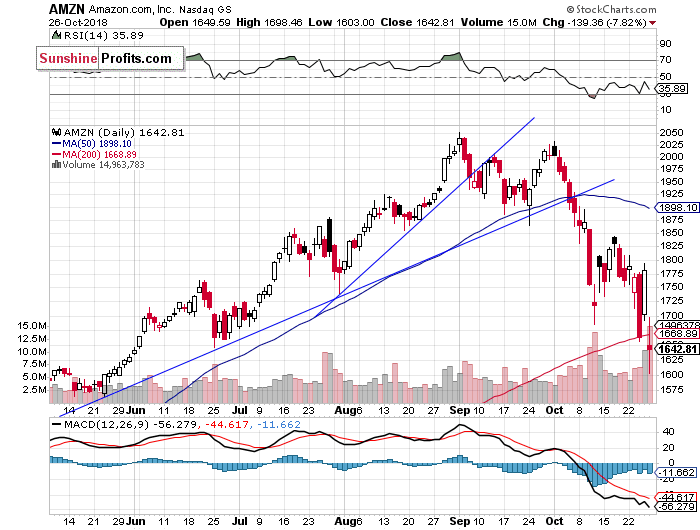
Now let's take a look at Amazon.com, Inc. stock (AMZN) daily chart. It accelerated its sell-off on Friday, following Thursday's quarterly earnings release. The stock fell almost $450 off its early September record high of $2,050.50. Is this a downward correction or some major long-term downturn? For now, it looks like a correction. However, it's hard to bullish about Friday's breakdown below the 200-day moving average:
Blue Chip Stocks Relatively Stronger
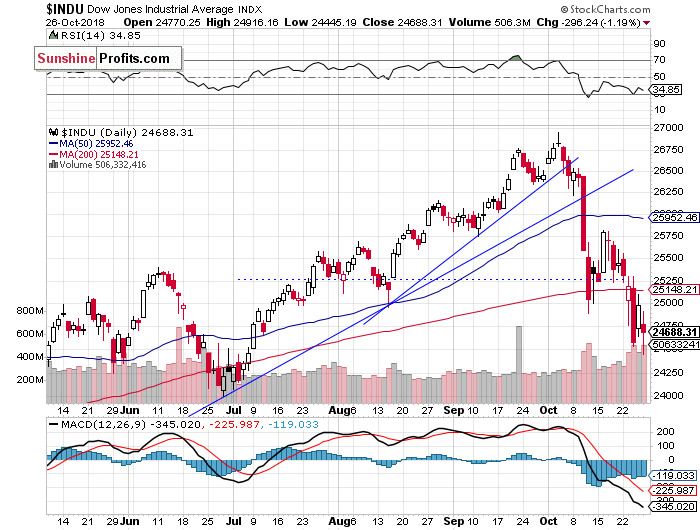
The Dow Jones Industrial Average reached its new all-time high at the level of 26,951.81 on October the 3rd. Then the blue-chip stocks' gauge broke below its medium-term upward trend lines and the support level of around 26,000. It quickly continued towards the 25,000 mark. There we saw a consolidation, but the index broke lower again. The nearest important level of support is at around 24,000-24,250, marked by the medium-term local low. The blue-chip index reached the new medium-term low on Friday, but it managed to remain within a short-term consolidation:
German DAX - Weaker than US Stocks
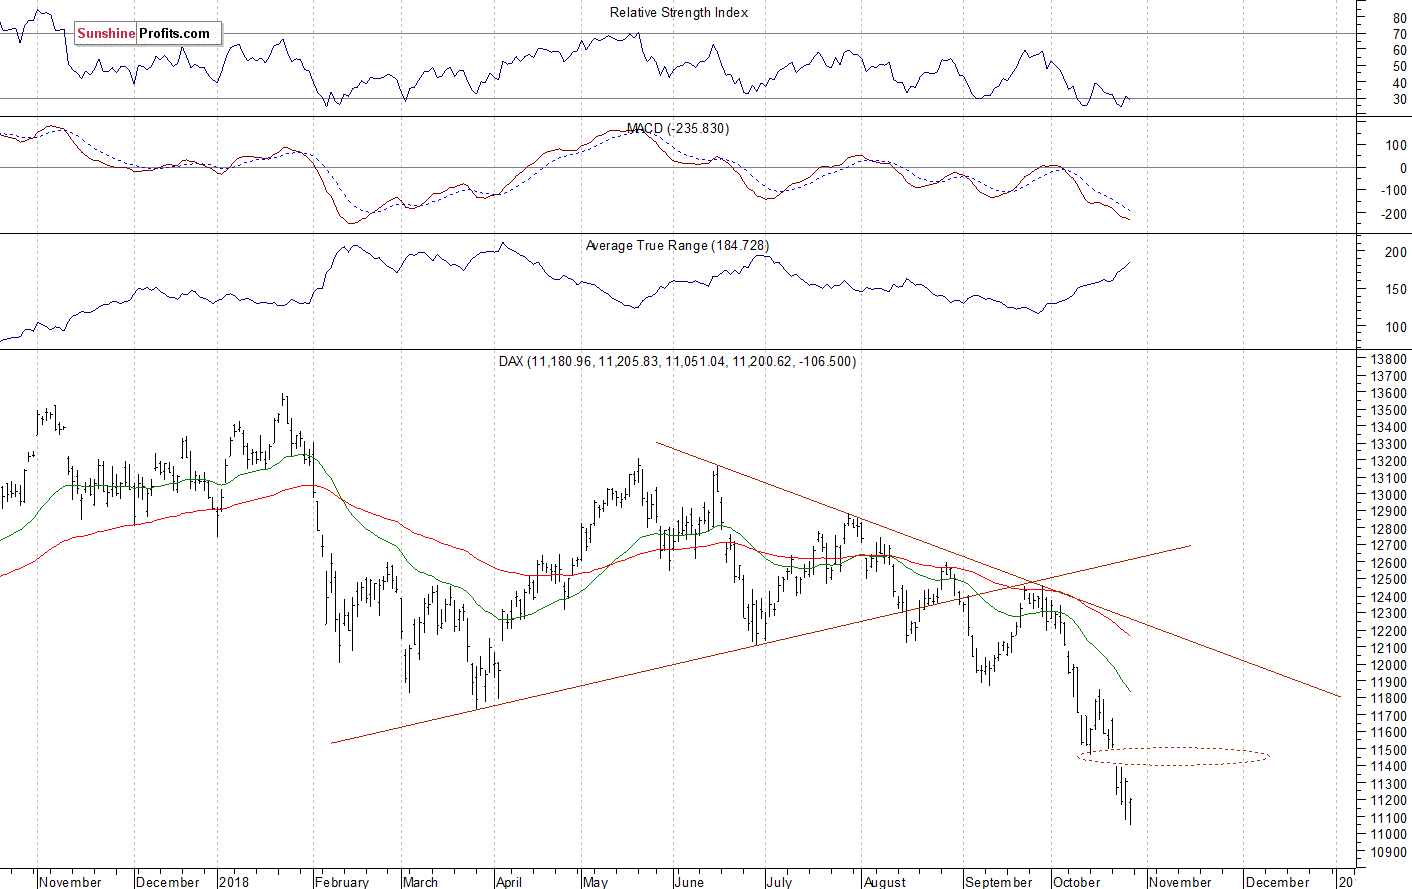
Let's take a look at the German DAX index now. It is relatively weaker than the U.S. broad stock market recently, as it trades below its late March local low of 11,727. Last week it accelerated the downtrend following gapping down on Tuesday. The nearest important resistance level is at 11,400-11,500, marked by that daily gap down. Was it a so-called "exhaustion gap" before reversing higher? It is worth looking at in the near future:
The S&P 500 index continued its downtrend on Friday, as got further away from 2,700 mark. The market fell below its Wednesday's local low, but we saw a rebound at the end of the day. Stocks are expected to open higher today. Will the downtrend reverse here? There have been no confirmed positive signals so far.
Concluding, the S&P 500 index will probably open higher today. However, we may see more volatile fluctuations. For now, it looks like a short-term upward correction or a consolidation.
Trading position (short-term; our opinion): no positions are justified from the risk/reward perspective.
Thank you.
Paul Rejczak
Stock Trading Strategist
Stock Trading Alerts

