

Is the Fed moving too quickly? Can the equity markets handle a Fed taper without the tantrum? What about inflation? Yesterday’s FOMC statement creates more questions than answers.
So, we now know that the Fed expects to hike interest rates in 2023.
That could be ok. However, there was some contradictory language yesterday surrounding inflation. Is it transitory in the eyes of the Fed, or is it something more? Yesterday’s press conference seemed to play both sides of this coin, and stocks sold off on the uncertainty.
That’s ok too.
In reality, the selloff wasn’t too bad, with the $SPX losing 0.54%; and the $VIX rising by 6.64% on Wednesday. The benchmark 10-year yield $TNX tacked on 4.67% and finished yesterday’s session at a 1.568% yield. There was a pocket of strength in financial names and a few select market sectors. However, it makes me wonder, will asset managers be taking a different view on equities going forward? 2023 is a long time from now, but the idea of the punch bowl being taken away combined with an uncertain inflationary environment could paint a different picture going forward. We just don’t know yet.
Fortunately, some of the ETFs that we have been following fared well on Wednesday. Strength surfaced in solar and green names, which shows that we are on the right path, as capital had to make its way into something other than cash, financials, and volatility yesterday.
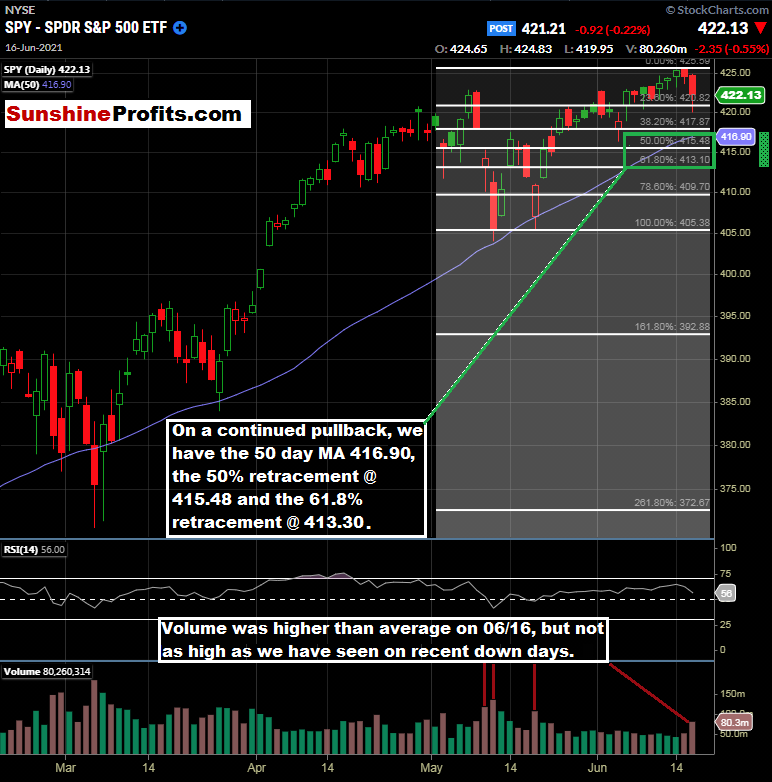
Figure 1 - SPDR S&P 500 ETF February 17, 2021 - June 16, 2021, Daily Source stockcharts.com
So, even though it seemed like the sky was falling if you were watching business news coverage after the Fed statement, it was just a pedestrian down day on decent down volume. For SPY traders that have been waiting for a pullback, there could be an opportunity in the cards soon; if we get some follow-through selling. However, I personally favor the IWM at this time, as discussed thoroughly in the May 27th publication.
Turning bearish of an event like today usually turns out to be the wrong move, in my experience. So what, rates will go up in 2023. They have to go up at some point; there is plenty of warning and plenty of time between now and then. Buying the pullback would still be the prudent move based on probabilities (it is still a bull market).
Speaking of the IWM, it fared better than the SPY in Tuesday’s session, giving up only 0.21%. It could be due to the reconstitution theme that we have been discussing.
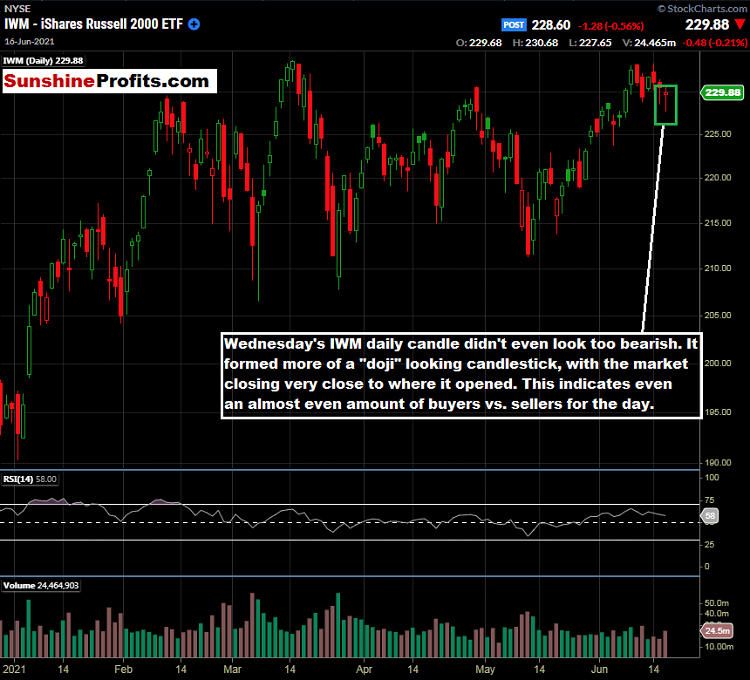
Figure 2 - iShares Russell 2000 ETF December 29, 2020 - June 16, 2021, Daily Candles Source stockcharts.com
That is a pretty healthy daily candle for the type of session that the major indices experienced on Wednesday.
So, keeping the above in mind, is it really prudent to suddenly get bearish on the indices based on the Fed guidance towards rate hikes in 2023? Probably not. At least not today, anyway. Bull markets like this don’t just go out with a whimper on most occasions. Let’s see how things transpire across the major indices once the new Fed guidance is digested by market participants.
Now, for more bearish folks, I’d like to turn our attention to the IWM/SPY ratio that we discussed in our May 27th publication surrounding the Russell 2000 reconstitution trade.
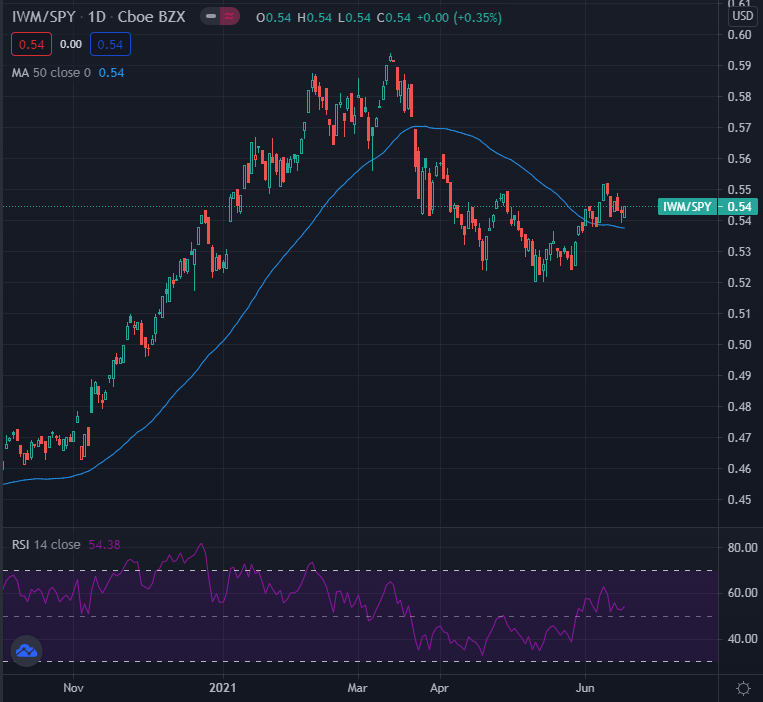
Figure 3 - IWM iShares Russell 2000 ETF / SPY S&P 500 ETF Ratio August 27, 2020 - May 26, 2021. Source tradingview.com
While the spread hasn’t moved too much to the upside since May 26th, it has tacked on a penny, moving from 0.53 to 0.54. Percentage-wise, there is nothing wrong with that, and this is a theme that could continue to work through June 28th. This trade is long the IWM and short the SPY.
While it may be too early to tell how the broader markets will react to the Fed’s change in stance, it is also not necessarily a time to make rash decisions. Looking for pullbacks when more emotional traders decide to short the market could be a good idea. For now, we will see how Asia and Europe digest the message of the Fed in the overnight session followed by another US trading session. Time will give us more clues regarding the market’s interpretation of the Fed.
To sum up the current viewpoint and opinion:
I have BUY opinions for:
- iShares Trust Russell 2000 ETF (IWM) for an index reconstitution trade. At this time, I would be looking to be long and then exiting upon the actual reconstituted index going into place on June 28, 2021. Buy the rumor, sell the fact type of trade. Buy Pullbacks. For equity-bearish folks, see the IWM/SPY spread idea in the May 27th publication. Always use a stop loss level that caters to your individual risk tolerance.
- Update: 06/17: The IWM shed 0.21% in Wednesday’s session to close at $229.87 It is still well above the $223.36 level when initiating coverage. Opinion: stay long. I think there is still time to get on board here, with the plan being to sell on June 28, 2021. See the May 27th publication.
- Defiance Quantum ETF (QTUM) between $44.00 - $49.50. Update 06/17: QTUM closed at $49.08 on Wednesday. In case you missed this one, I think there is still time to get on board and will raise the buy idea zone to $44.00 - $49.50. It looks like it wants to break out of its range soon, but could find some sellers at the psychologically important $50 level. Always use a stop loss level that caters to your individual risk tolerance.
- Amplify Transformational Data Sharing ETF (BLOK) between the 200-day moving average and $40.00 200-Day Moving Average is currently $39.70 (06/17). BLOK has a history of high volatility, so proceed with caution. Always use a stop loss level that caters to your individual risk tolerance. Update 06/17: Patience still. I want to jump on board, but prefer to see how Bitcoin negotiates the $40,000 level. Wait for $40.00 to the 200-Day moving average. It could happen soon. Monitoring.
- Invesco MSCI Sustainable Future ETF (ERTH) between $67.76 - $70.82. Always use a stop loss level that caters to your individual risk tolerance. Update 06/17: ERTH closed in the green @ $75.74 on Wednesday bucking the overall market trend on FOMC day. This is a great sign. Hold longs. Chugging along. If you missed this one, let’s see if we can get a pullback to the 50-day moving average, which currently sits at $74.00. (This happened on Wednesday briefly, I hope you caught it if you are not on board yet!) I am liking this one more and more for a long-term holding and will be willing to hold through short-term pullbacks at this time.
- Invesco Exchange-Traded Fund Trust - S&P SmallCap 600 Pure Value ETF (RZV) at the 50-day moving average. Patience and wait for the pullback. Always use a stop loss level that caters to your individual risk tolerance. Update 06/17: RZV 50-day MA is 92.67 as of the close Wednesday. Monitoring. This one bucked the downtrend on Wednesday too, and finished higher.
- iShares Global Timber & Forestry ETF (WOOD) Initial buy idea zone between $79.07 and the 200-day moving average ($79.82as of 06/16 close). Update 06/16: Given the price action in the lumber futures described in today’s alert, consider an entry into ½ of a normal position size between $86.50 - $87.50. Should it pull back further, we can look to add another ½ position size. Update 06/17: WOOD provided the entry opportunity levels that we were looking for on Wednesday and even finished higher on the day. What a great sign. Look to be long on this underappreciated ETF.
- SPDR S&P 500 ETF (SPY) between $412.26-$413.10 (61.8% Fibonacci retracement level) and the 50-day moving average ($416.90 as of the close on June 15th). Always use a stop loss level that caters to your individual risk tolerance. Update 06/17: Be alert SPY traders, you may get your chance this week.
- Invesco Solar ETF (TAN) between the 50-day moving average ($80.32 as of June 14th) and $81.50. Look for an intraday pullback for entry. Update 06/16: We wanted a pullback and we got a big one on Tuesday, with the range being $78.00 - $80.69. Ideally, this was taken advantage of on this pre-Fed meeting day. There could have been some “sell the news” price action with the SEIA report being released yesterday. Although we are below the 50-day MA, I like the previous consolidation and would look to be long at these levels. Update 06/17: TAN tacked on 1.51% in Wednesday’s overall down session. Great sign. I like this one and I think there is still time to get on board. Always use a stop loss level that caters to your individual risk tolerance.
I have SELL opinions for:
NONE
I have a HOLD opinion for:
- First Trust NASDAQ Clean Edge Smart Grid Infrastructure Index Fund (GRID). GRID has traded through our idea range of between $86.91 and $88.17. Update 06/17: GRID closed at $91.50 yesterday, moving lower on the overall down day. I see no major technical damage and like this one over the longer run. Opinion: hold longs.
- Always use a stop loss level that caters to your individual risk tolerance.
Have a great day out there. Your readership is valued and appreciated.
Thank you,
Rafael Zorabedian
Stock Trading Strategist

