

Briefly:
Intraday trade: The S&P 500 index gained 0.9% on Monday, after opening 0.3% higher. The broad stock market will probably fluctuate along its June's highs today. We prefer to be out of the market, avoiding low risk/reward ratio trades.
Medium-term trade: In our opinion, no medium-term positions are justified.
Our intraday outlook is neutral. Our short-term outlook is neutral, and our medium-term outlook is neutral:
Intraday outlook (next 24 hours): neutral
Short-term outlook (next 1-2 weeks): neutral
Medium-term outlook (next 1-3 months): neutral
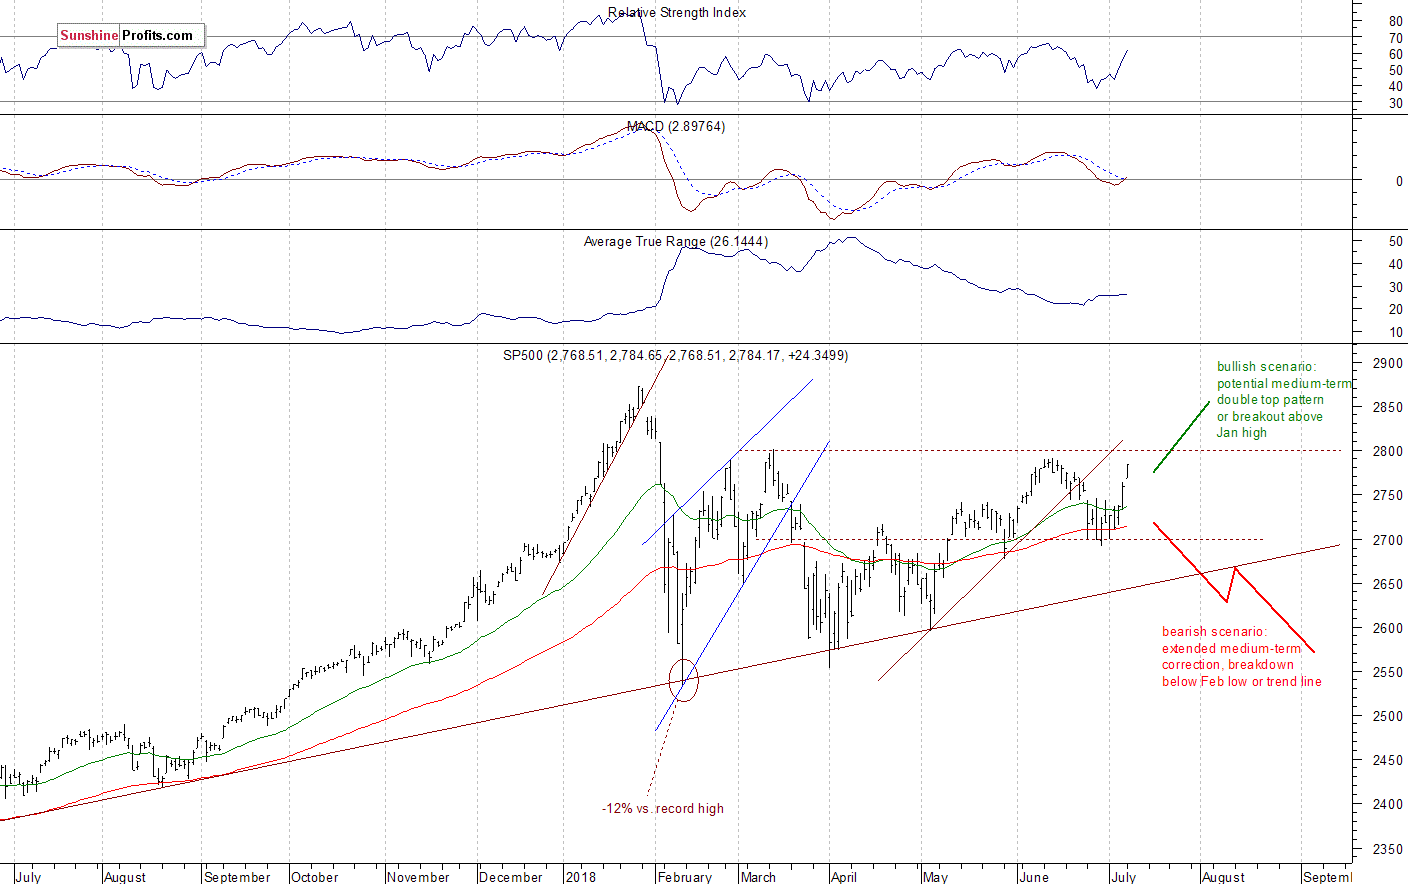
The U.S. stock market indexes gained between 0.9% and 1.3% on Monday, extending their short-term uptrend, as investors' sentiment remained bullish ahead of coming quarterly earnings releases season. The S&P 500 index got closer to its June's local high. It currently trades 3.0% below the January's 26th record high of 2,872.87. The Dow Jones Industrial Average gained 1.3% and the technology Nasdaq Composite gained 0.9% on Monday.
The nearest important level of support of the S&P 500 index is now at around 2,765-2,770, marked by yesterday's daily gap up of 2,764.41-2,768.51. The next level of support remains at 2,740-2,750, marked by the previous resistance level. On the other hand, the resistance level is at 2,780-2,800, marked by the local highs from February, March and June. The level of resistance is also at 2,840, marked by January the 30th daily gap down.
The broad stock market broke above its recent trading range on Friday. Is this a new uptrend or just more medium-term fluctuations following January-February sell-off? If the S&P 500 index breaks above 2,800 mark, we could see more buying pressure. Perhaps we could see a move to new record high. However, there are still two possible medium-term scenarios - bearish that will lead us below the February low following trend line breakdown, and the bullish one in a form of medium-term double top pattern or a breakout towards 3,000 mark. There is also a chance that the market will just go sideways for some time, and that would be positive for bulls in the long run (some kind of an extended flat correction). The S&P 500 index broke below its two-month-long upward trend line recently, but it continued to trade above the level of 2,700:
Positive Expectations Again
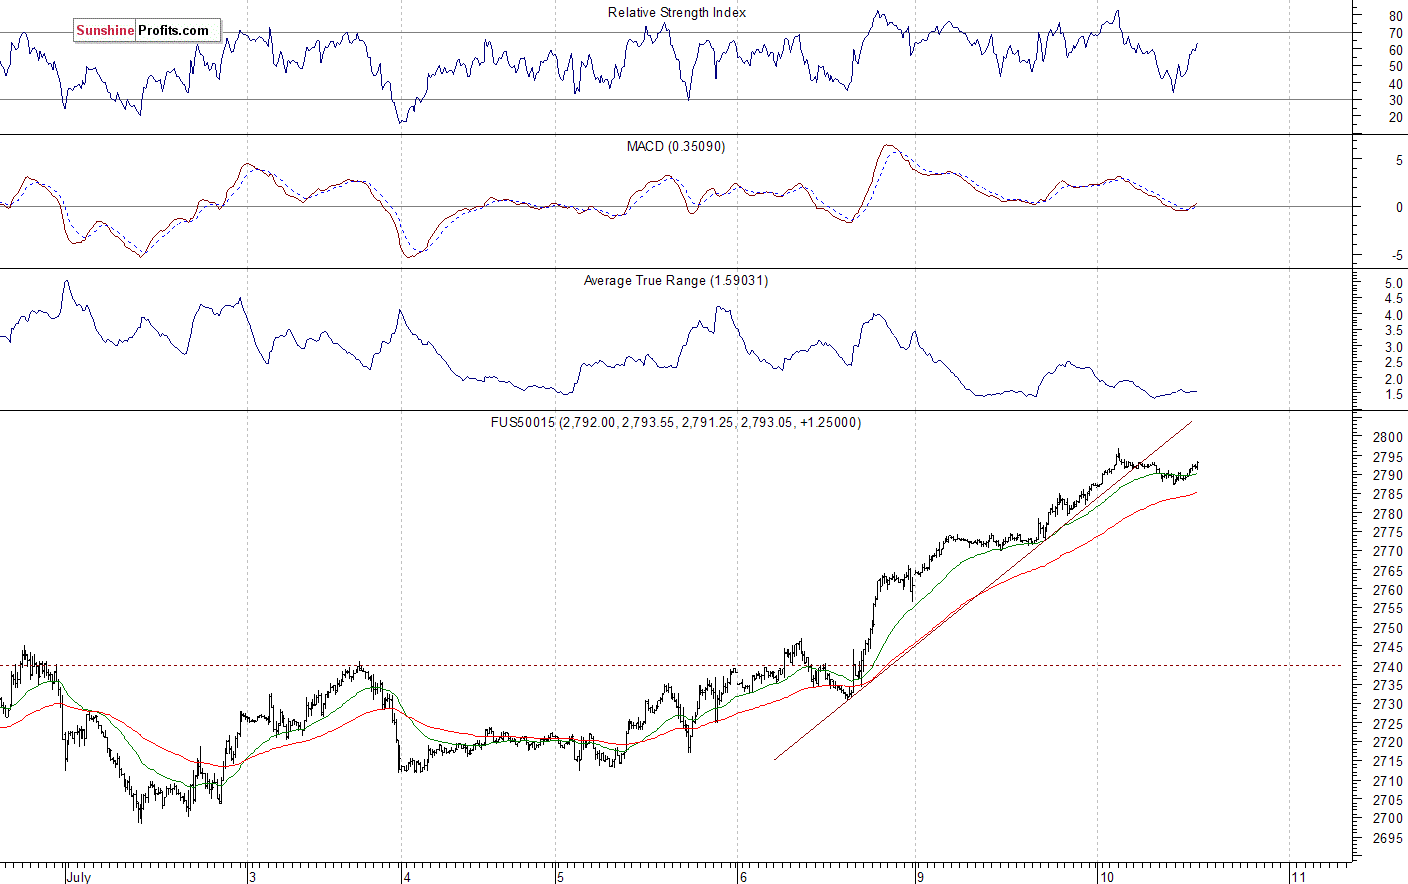
The index futures contracts trade are trading 0.2-0.3% higher vs. their Monday's closing prices right now, so the expectations before the opening of today's trading session are slightly positive. The European stock market indexes have gained 0.2-0.5% so far. Investors will wait for the JOLTS Job Openings number release at 10:00 a.m. The broad stock market will probably extend its short-term uptrend slightly again, as the S&P 500 gets close to the above-mentioned resistance level of around 2,800. We may see some uncertainty there.
The S&P 500 futures contract trades within an intraday consolidation following yesterday's rally. The nearest important level of resistance is at around 2,800. On the other hand, support level is now at 2,770-2,780, marked by the previous resistance level. The futures contract trades below its two-session-long upward trend line, as we can see on the 15-minute chart:
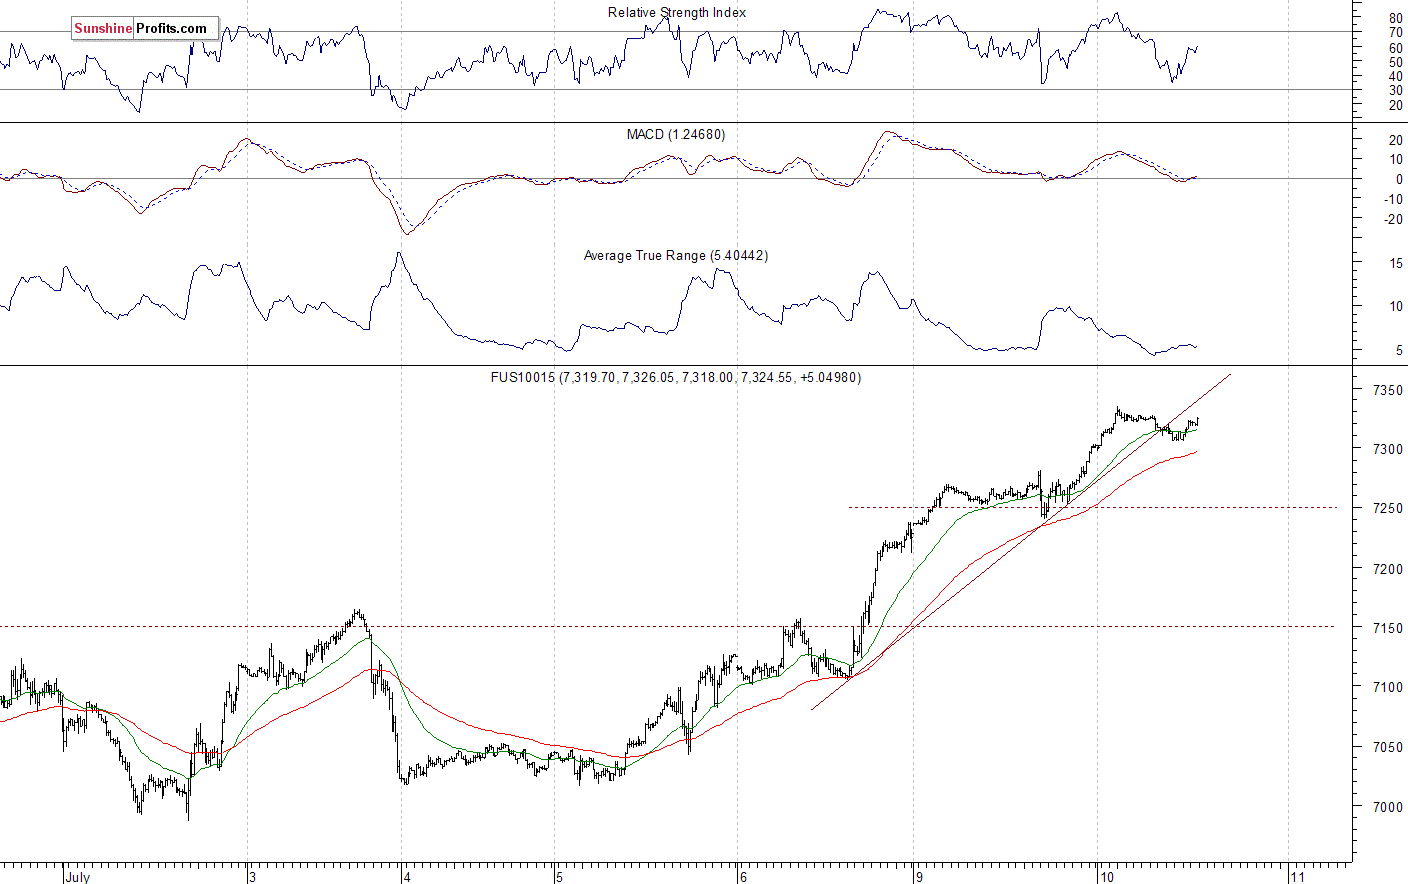
Nasdaq Closer to Record High
The technology Nasdaq 100 futures contract follows a similar path, as it trades closer to June the 21st record high of around 7,360. The nearest important resistance level is at around 7,350-7,360. On the other hand, support level is at 7,250-7,300, among others. The Nasdaq futures contract remains close to its short-term local high, as the 15-minute chart shows:
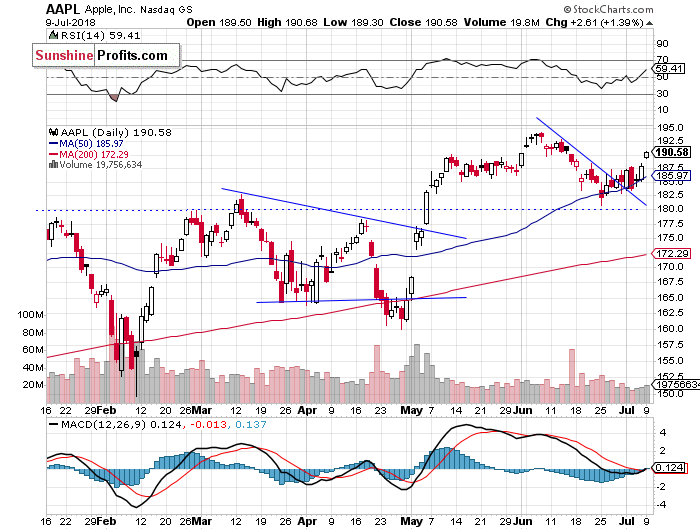
Apple, Amazon - Ready to Jump Higher?
Let's take a look at Apple, Inc. stock (AAPL) daily chart (chart courtesy of http://stockcharts.com). It traded within a short-term downtrend since the beginning of June. The decline accelerated, as the price got closer to a potential support level of $180. Then it rebounded and broke slightly above its downward trend line. Since then, it fluctuated. Yesterday we wrote that "there have been no confirmed positive signals so far, but this may be a bottoming pattern". Well, it looks like a bottoming pattern before another leg up:
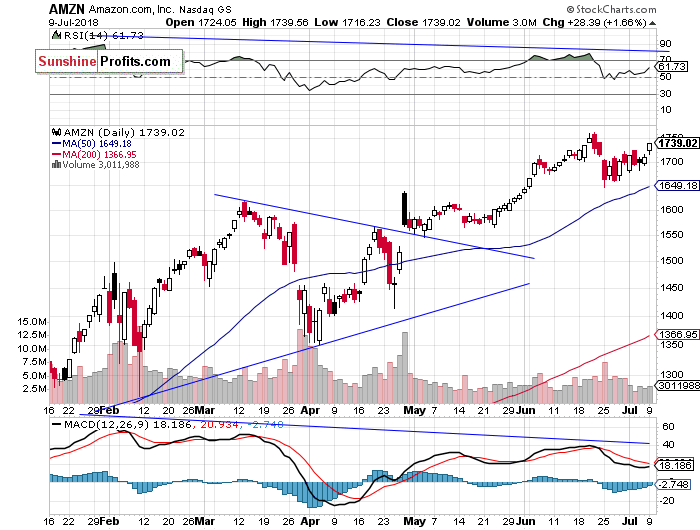
Now let's take a look at Amazon.com, Inc. stock (AMZN) daily chart. It reached the new record high on June the 21st, as it was relatively much stronger than the broad stock market. Then it reversed its short-term uptrend and got closer to the support level of $1,650 again. Since then it fluctuated along the level of $1,700. We can see an attempt at breaking to new record high here:
Dow Jones - Relatively Stronger
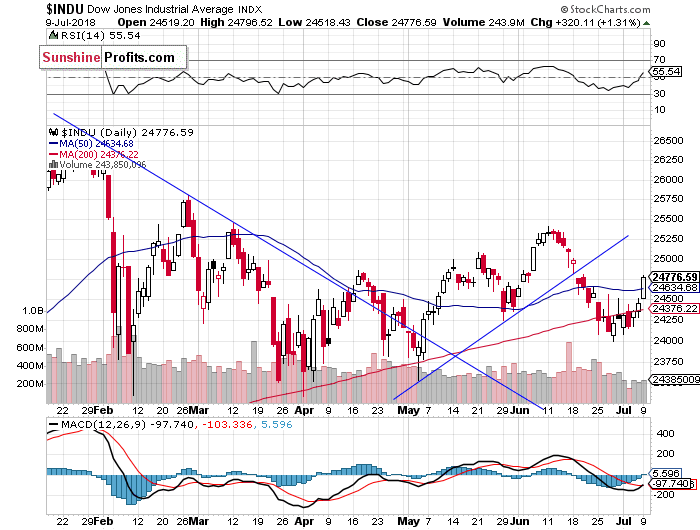
The Dow Jones Industrial Average broke below its two-month-long upward trend line in the late June. Then it continued lower, as it fell below the level of 24,500. The blue-chip index kept bouncing off a potential support level of around 24,000-24,250 recently. It continued to trade along its 200-day moving average which eventually acted as a support level. Yesterday, the index broke above the resistance level of around 24,500 and we saw more buying pressure:
The S&P 500 index extended its short-term uptrend yesterday, as it got closer to the recent months' local highs along the level of 2,800. But is this an uptrend leading to new medium-term highs? If the S&P 500 index breaks above 2,800, we could see a move towards the January highs. Overall, the market is closer to breaking above its medium-term consolidation.
Concluding, the broad stock market will probably open slightly higher today. Then we may see some more uncertainty closer to 2,800 mark. On Friday morning we wrote that "the sentiment is slightly bullish and the broad stock market may take another attempt at breaking higher" And it did break higher. But there is a resistance level of 2,800 ahead.
Currently, we prefer to be out of the market, avoiding low risk/reward ratio medium-term trades. We will let you know when we think it is safe to get back in the market.
To summarize: no medium-term positions are justified from the risk/reward perspective at this moment.
Intraday trade:
No intraday position is justified from the risk/reward perspective today.
No medium-term position is justified from the risk/reward perspective at this moment.
Thank you.
Paul Rejczak
Stock Trading Strategist
Stock Trading Alerts

