

Briefly:
Intraday trade: The S&P 500 index gained 0.5% on Tuesday, after opening 0.1% higher. The broad stock market will probably open virtually flat today. We may see more short-term fluctuations following the late August rally. We prefer to be out of the market, avoiding low risk/reward ratio trades.
Trading position (short-term; our opinion): no short-term positions are justified from the risk/reward perspective.
Our intraday outlook is neutral. Our short-term outlook is neutral, and our medium-term outlook is neutral:
Intraday outlook (next 24 hours): neutral
Short-term outlook (next 1-2 weeks): neutral
Medium-term outlook (next 1-3 months): neutral
The main U.S. stock market indexes gained 0.5-0.8% on Tuesday, extending their short-term fluctuations, as investors' sentiment improved once again. The S&P 500 index has reached the record high of 2,916.50 on August the 29th. It currently trades just 0.4% below that high. The Dow Jones Industrial Average gained 0.7% and the technology Nasdaq Composite gained 0.8% yesterday.
The nearest important level of support of the S&P 500 index is now at 2,900 again. The next support level remains at around 2,880, marked by the last Wednesday's daily low. The support level is also at around 2,860-2,865, marked by the recent fluctuations. On the other hand, the nearest important level of resistance is now at 2,910-2,915, marked by the mentioned record high.
The broad stock market reached the new record high in the late August, as it extended its short-term uptrend above the level of 2,900. Since then it trades within a consolidation. Yesterday, it got back above 2,900 mark again. Will it advance towards new all-time highs? Or is this some medium-term topping pattern? The index trades above its three-month-long upward trend line, as we can see on the daily chart:
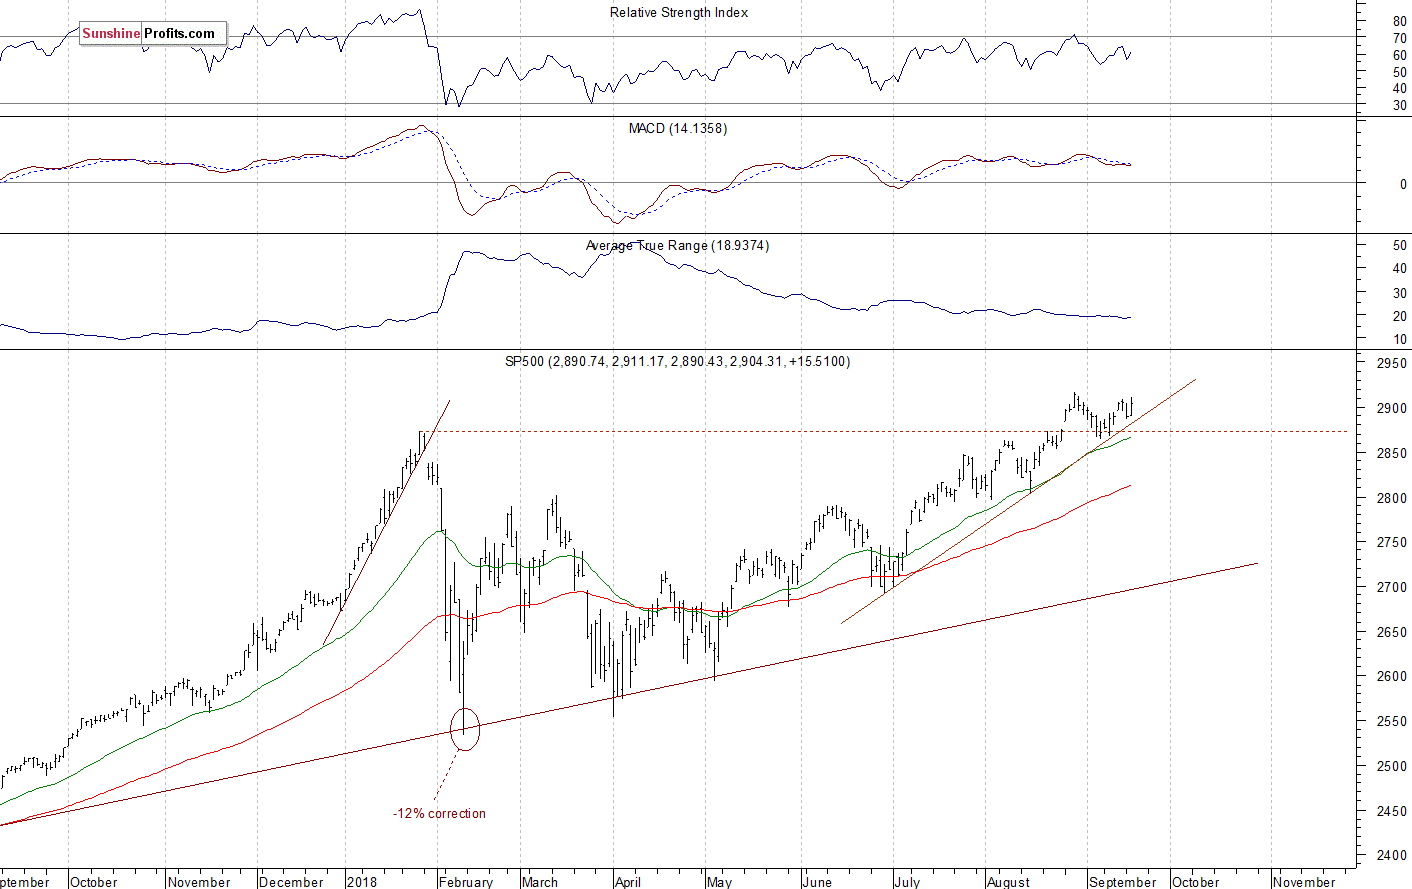
Just Below New Record High
The index futures contracts trade between -0.05% and 0.0% vs. their yesterday's closing prices. So expectations before the opening of today's trading session are virtually flat. The main European stock market indexes have been mixed so far. Investors will now wait for some economic data announcements: Building Permits, Housing Starts at 8:30 a.m., Crude Oil Inventories number at 10:30 a.m. The broad stock market will likely extend its short-term consolidation. The S&P 500 index may continue to fluctuate along the level of 2,900. For now, it looks like a relatively flat correction within a medium-term uptrend. There have been no confirmed negative medium-term signals so far.
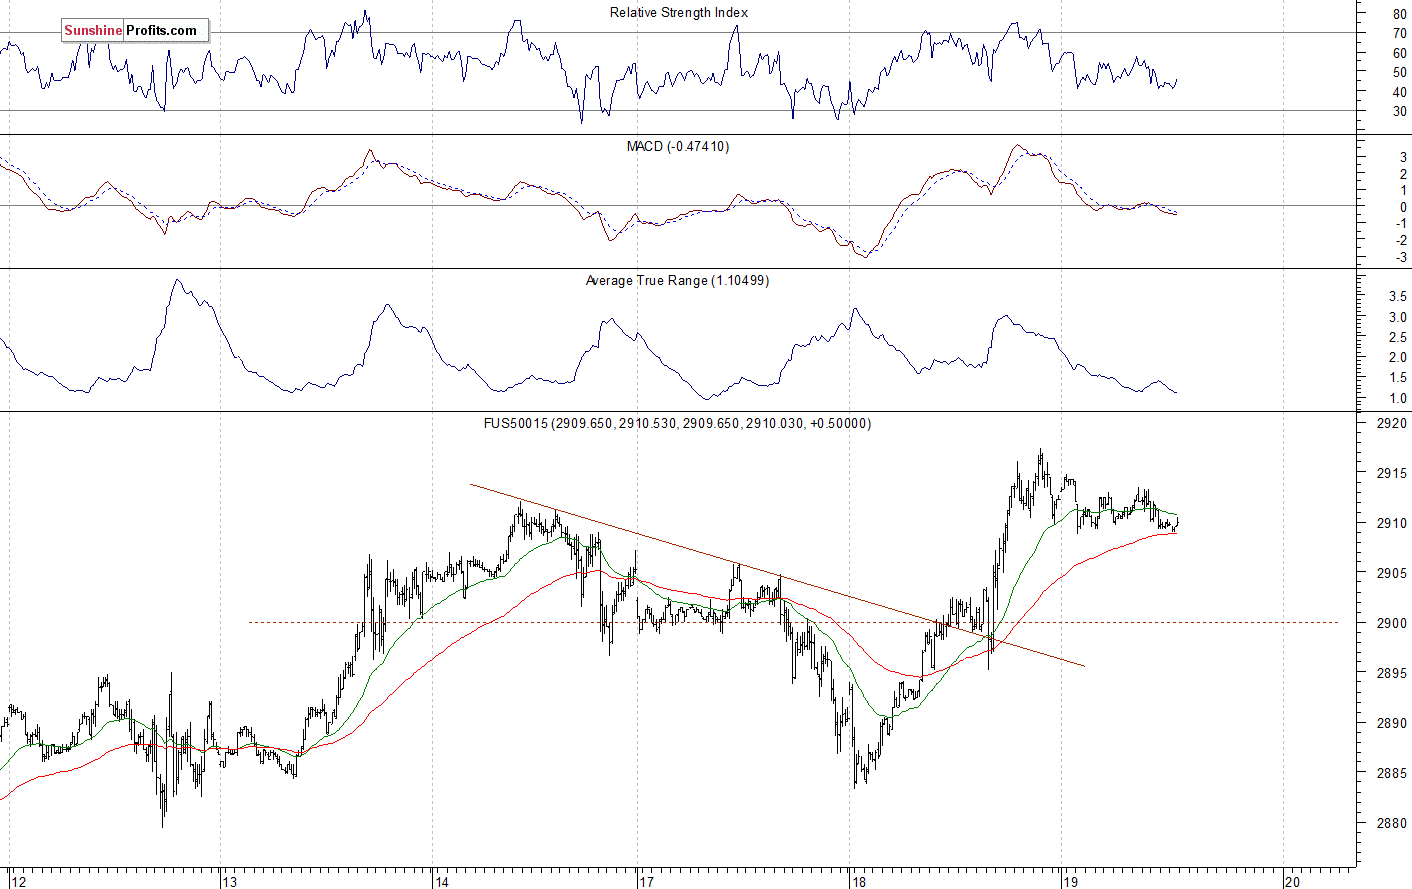
The S&P 500 futures contract trades within an intraday consolidation, as it fluctuates after yesterday's advance. The market reached the new record high above the level of 2,917 yesterday, slightly exceeding its late August high. The nearest important level of resistance is at around 2,910-2,915, marked by the record high. On the other hand, support level is at 2,900. The next level of support is at 2,880-2,885, marked by the short-term local low. The futures contract trades just below its new record high, as the 15-minute chart shows:
Nasdaq Also Higher, but Way Below Record High
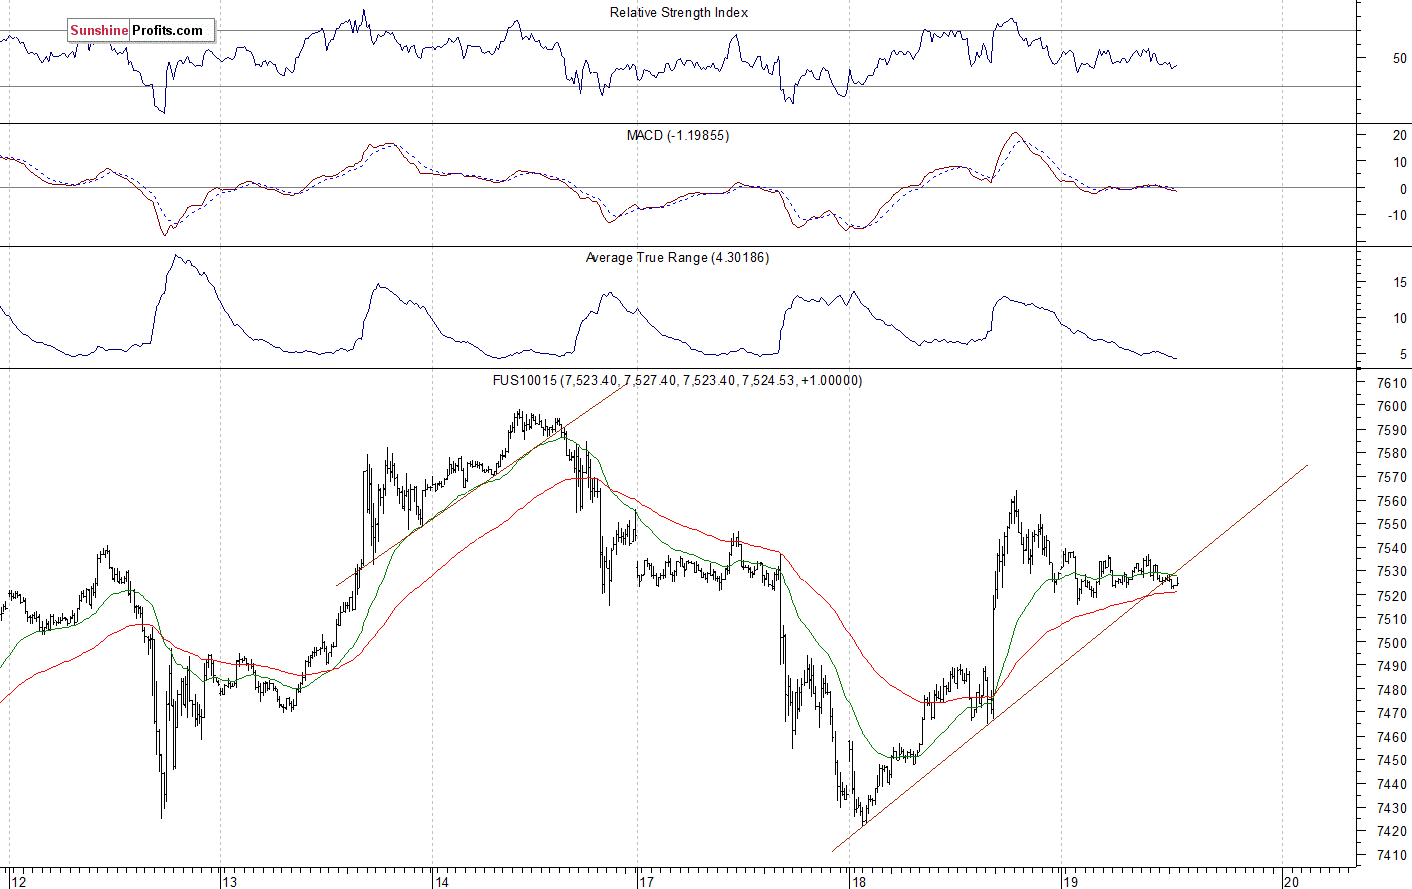
The technology Nasdaq 100 futures contract follows a similar path, as it fluctuates after its yesterday's rally off the support level of around 7,400. It trades above 7,500 mark again. The nearest important level of resistance is now at 7,550-7,600, marked by the recent short-term topping pattern. On the other hand, the support level is at 7,480-7,500, among others. The tech stocks' gauge remains relatively weaker than the broad stock market following almost 4% downward correction off the August 30th record high of around 7,700. The Nasdaq futures contract is at its two-day-long upward trend line, as we can see on the 15-minute chart:
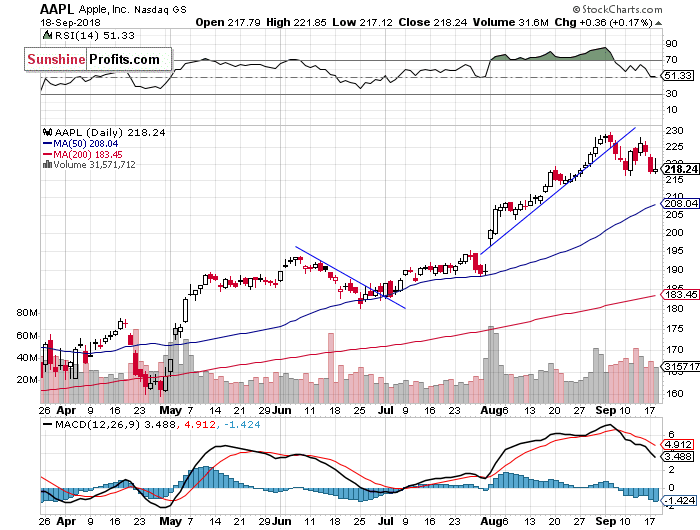
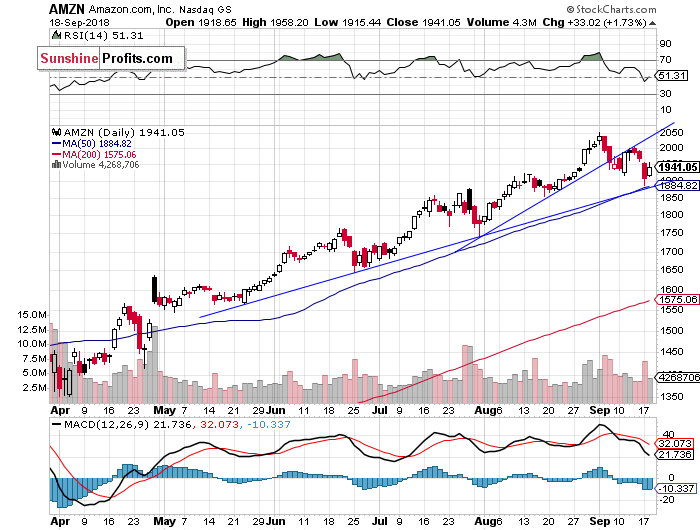
Apple, Amazon - New Downtrend or Just Downward Correction?
Let's take a look at Apple, Inc. stock (AAPL) daily chart (chart courtesy of http://stockcharts.com). It reached the new record high at the level of $229.67 on September the 5th, before reversing lower. Then it broke below its month-long upward trend line. The resistance level remains at $225-230. On the other hand, support level is at $215. If the price breaks lower, we could see more selling pressure:
Now let's take a look at Amazon.com, Inc. stock (AMZN) daily chart. It has reached the new record high at the price of $2,050.50 recently. Since then it was retracing this record-breaking rally. The stock broke below the month-long upward trend line in the early September. We still can see negative technical divergences. Last Tuesday's intraday reversal didn't lead the market above the resistance level of $2,000. The price is at its medium-term upward trend line:
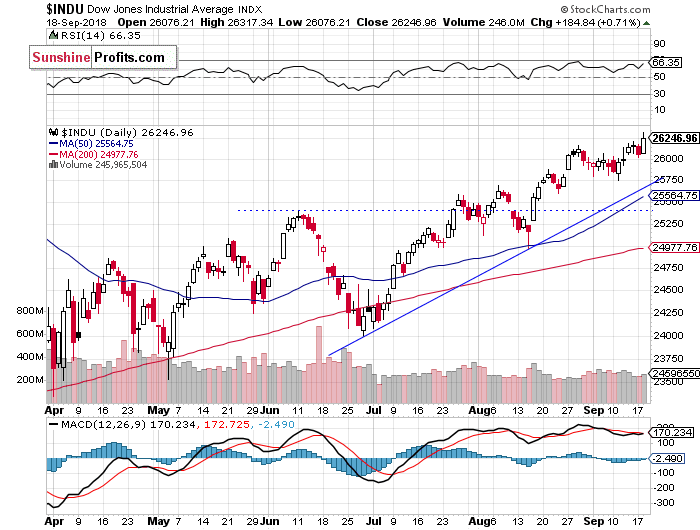
Blue-chip Stocks Remain Relatively Strong
The Dow Jones Industrial Average broke above its late August local high last week, as it got back above 26,000 mark. Yesterday, it continued higher. The nearest important level of resistance remains at 26,340-26,440, marked by the late January daily gap down. The index trades above its two-month long upward trend line, as the daily chart shows:
The S&P 500 index reached the new record high at the level of 2,916.50 last month. Since then the broad stock market's gauge is fluctuating along the level of 2,900. There have been no confirmed negative signals so far. However, we still can see some short-term technical overbought conditions along with negative technical divergences.
Concluding, the S&P 500 index will likely open virtually flat today. The market remains very close to its late August record high, so we may see an attempt at extending the bull market.
Intraday trade:
No intraday position is justified from the risk/reward perspective today.
Trading position (short-term; our opinion): no short-term positions are justified from the risk/reward perspective.
Thank you.
Paul Rejczak
Stock Trading Strategist
Stock Trading Alerts

