

Briefly:
Intraday trade: Our Thursday's intraday outlook was neutral. The S&P 500 index lost 0.2% after opening 0.1% lower. The stock market will likely open higher today, but we may see more fluctuations along resistance level. Investors will likely remain uncertain ahead of long holiday weekend. We prefer to be out of the market, avoiding low risk/reward ratio trades.
Medium-term trade: In our opinion, no medium-term positions are justified.
Our intraday outlook is neutral. Our short-term outlook is neutral, and our medium-term outlook is neutral:
Intraday outlook (next 24 hours): neutral
Short-term outlook (next 1-2 weeks): neutral
Medium-term outlook (next 1-3 months): neutral
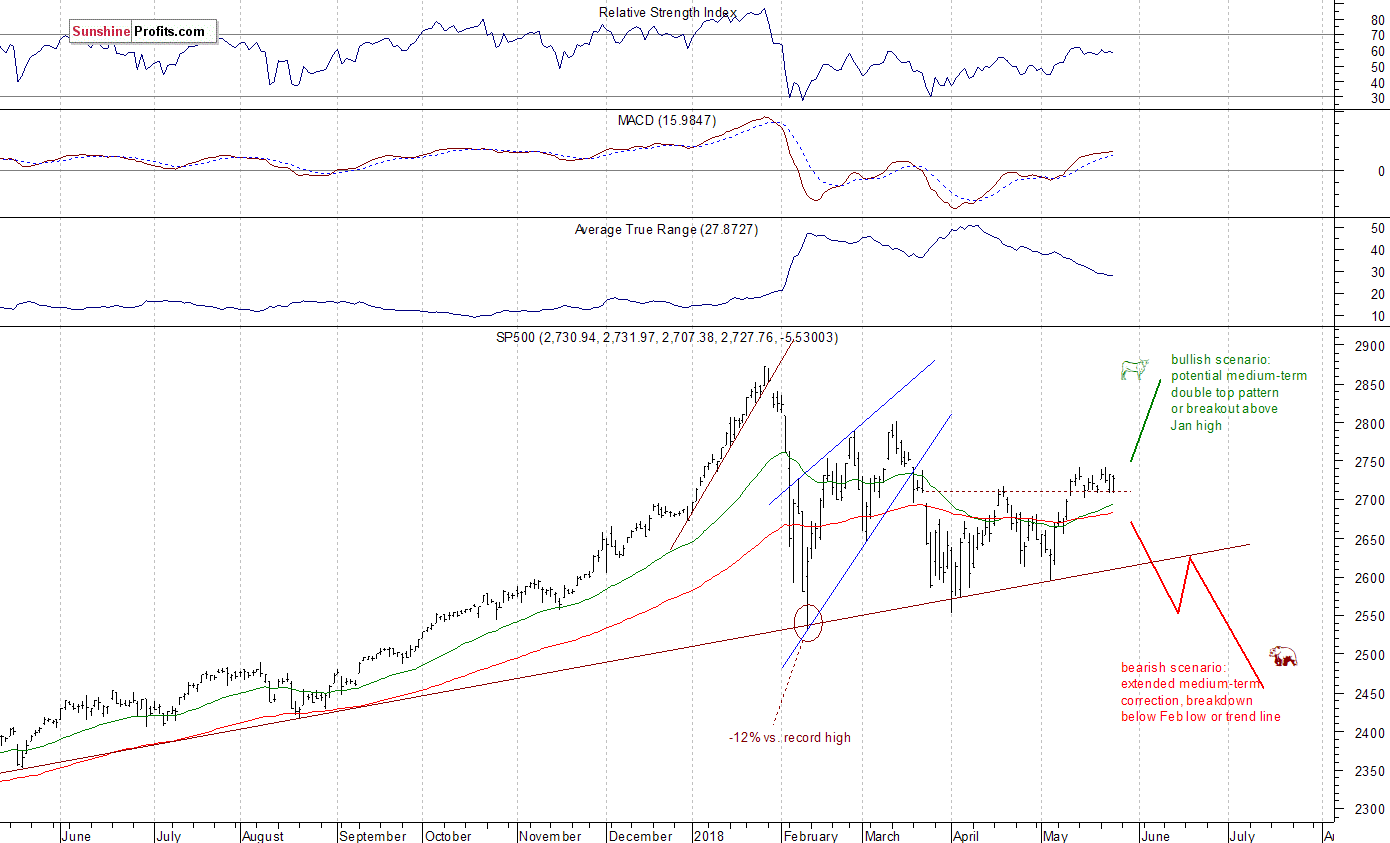
The U.S. stock market indexes were mixed between -0.2% and 0.0% on Thursday, as investors' sentiment remained quite neutral. The S&P 500 index continues to trade above 2,700 mark, and it is currently 5.1% below January's 26th record high of 2,872.87. The Dow Jones Industrial Average lost 0.3%, and the technology Nasdaq Composite was unchanged, as it was relatively stronger than the broad stock market again.
The nearest important level of resistance of the S&P 500 index remains at around 2,740-2,750, marked by recent local highs along with mid-March local high. On the other hand, support level is at around 2,720, marked by Monday's daily gap-up of 2,719.50-2,725.70. The support level is also at 2,700-2,710, marked by previous daily gap-up of 2,701.27-2,704.54 and recent daily lows.
The broad stock market extended its short-term uptrend in the beginning of the month, as the S&P 500 index broke above the level of 2,700. Stocks lost some ground a week ago, but it didn't look like a new downtrend. Since then, the market traded within consolidation. So, will the run-up continue towards 2,800? There are still two possible medium-term scenarios - bearish that will lead us below February low following trend line breakdown, and the bullish one in a form of medium-term double top pattern or breakout towards 3,000 mark. There is also a chance that the market will just go sideways for some time, and that would be positive for bulls in the long run (some kind of an extended flat correction):
Positive Expectations, but Stocks Close to Resistance Level
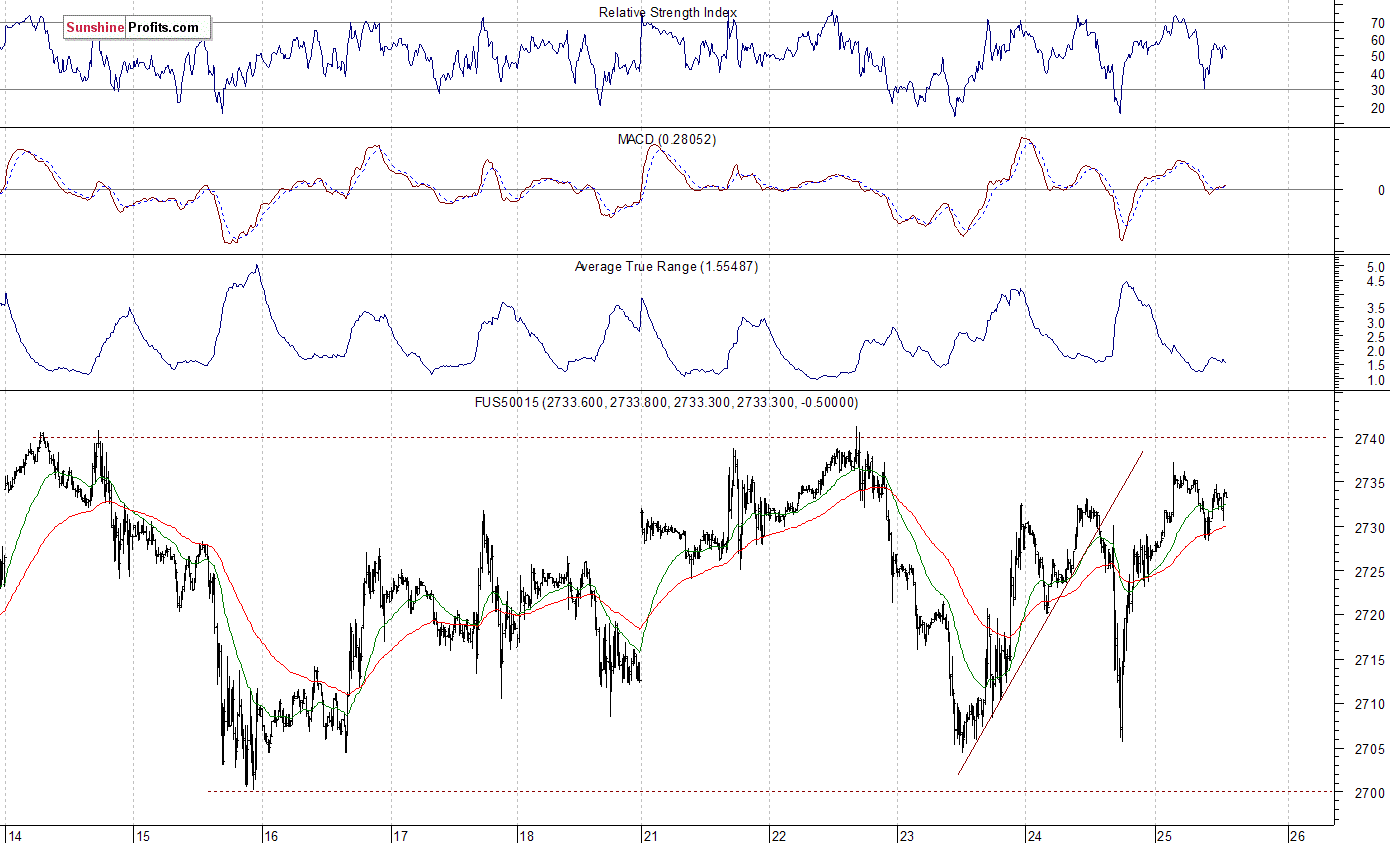
The index futures contracts trade 0.2-0.4% higher vs. their Thursday's closing prices, so expectations before the opening of today's trading session are slightly positive. The main European stock market indexes have gained 0.3-1.0% so far. Investors will now wait for some economic data announcements: Durable Goods Orders at 8:30 a.m., Michigan Sentiment number at 10:00 a.m. There will also be a speech from Fed Chair Jerome Powell after 9 a.m. The broad stock market will likely continue to fluctuate along its short-term resistance level. Will investors buy stocks ahead of long holiday weekend? There is a chance that stocks will break higher today.
The S&P 500 futures contract trades within an intraday consolidation following yesterday's intraday rise. The nearest important level of resistance is at around 2,735-2,740, marked by recent local highs. Potential resistance level is also at 2,750. On the other hand, support level is at 2,715-2,720. The next level of support remains at 2,700-2,705. The futures contract continues to trade within a short-term consolidation, as we can see on the 15-minute chart:
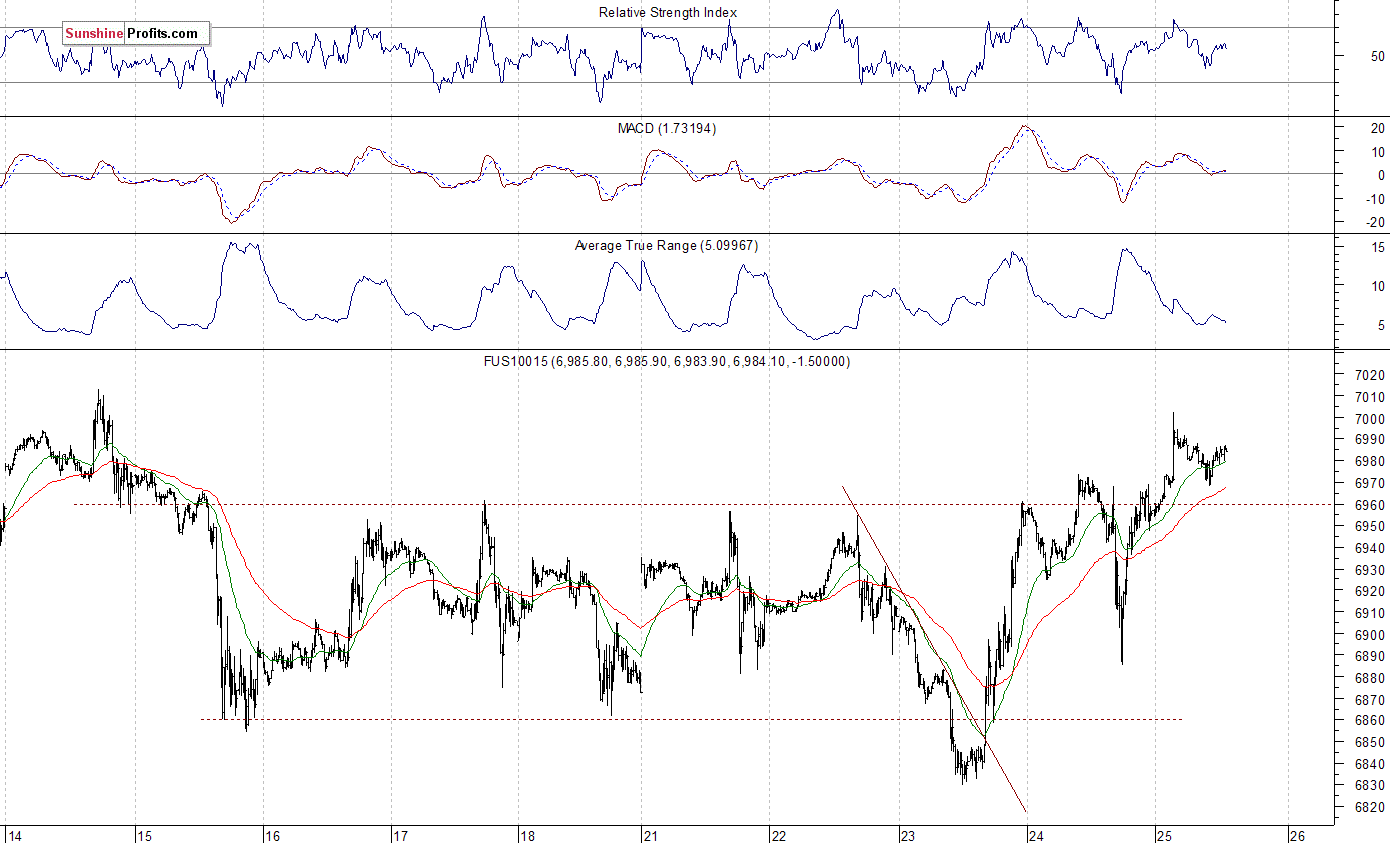
Nasdaq Closer to 7,000
The technology Nasdaq 100 futures contract broke above its recent local highs and it got closer to May's 14th high of around 7,010. The market sold off below the level of 6,900 yesterday, before reversing its intraday downtrend again and closing slightly above the level of 6,950. Is this a new uptrend? It's still hard to say. Tech stocks retraced their short-term decline, but they remain below 7,000 mark. The nearest important level of resistance is at around 7,000-7,010. On the other hand, support level is at 6,900-6,950, among others. The Nasdaq futures contract broke above its recent trading range, as the 15-minute chart shows:
Apple, Amazon - Still Inconclusive, but No Sell Signals
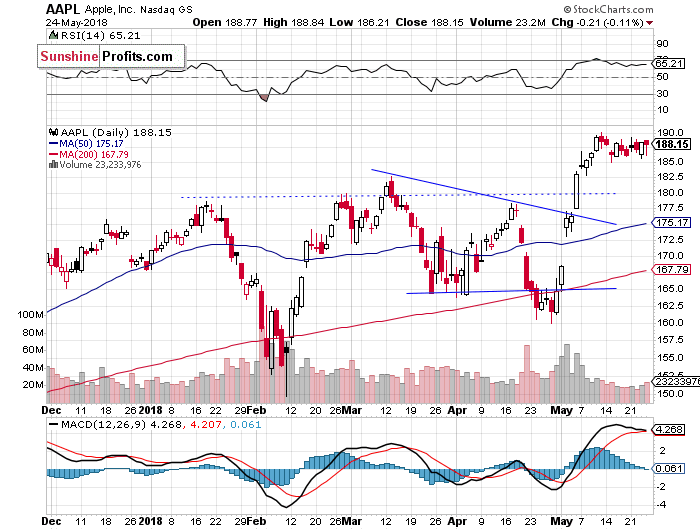
Let's take a look at Apple, Inc. stock (AAPL) daily chart (chart courtesy of http://stockcharts.com). It reached new record high two weeks ago, as it extended its short-term uptrend. The price bounced off resistance level of around $190-200 and since then it trades within a consolidation. Is this a topping pattern? There have been no confirmed negative signals so far:
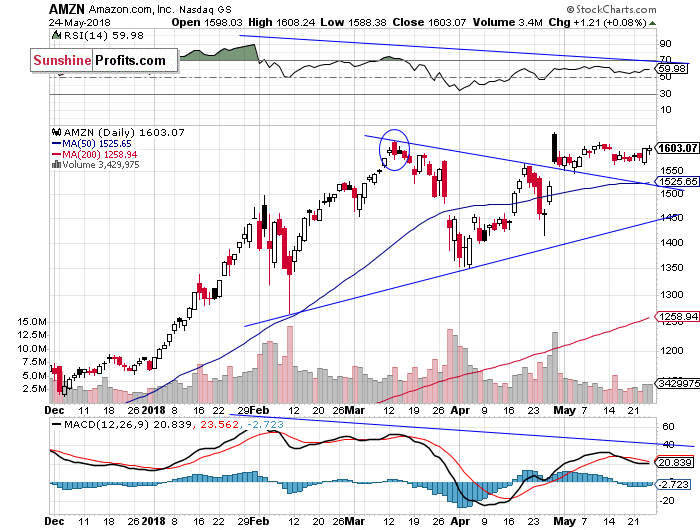
Now let's take a look at Amazon.com, Inc. stock (AMZN) daily chart. The price reached new record high of $1,638.10 in late April and on the same trading day it sold off below $1,600. Was this a downward reversal or just a correction following breakout higher? Since then, the stock traded within a consolidation. Recent price action looks pretty bullish, as price broke above $1,600 again:
Dow Jones Bounces Off Support Level Again
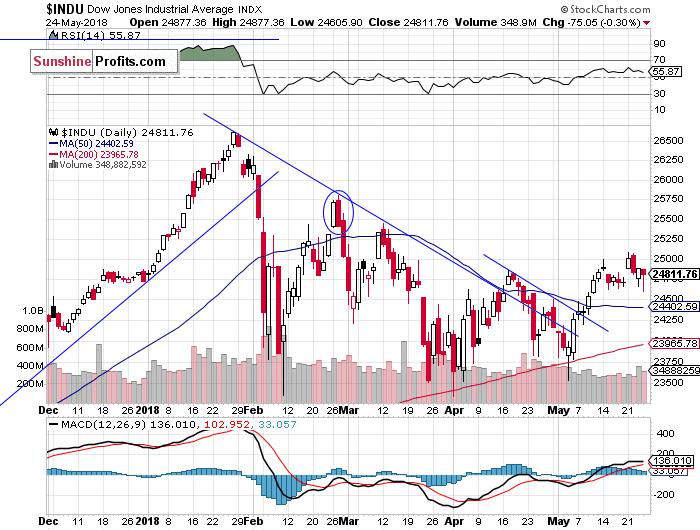
The Dow Jones Industrial Average broke above its medium-term downward trend line recently. Then it continued higher above a few-week-long downward trend line. The blue-chip index bounced off resistance level of 25,000 more than a week ago, and then it retraced its recent advance. Monday's trading session was bullish as Dow Jones broke above its recent local high and closed at 25,000 mark, but it failed to continue higher and went back lower. On Tuesday we saw negative bearish engulfing candlestick pattern, but the market keeps bouncing back:
The broad stock market reversed its intraday decline again on Thursday. Was it an upward reversal or just another move up within two-week-long consolidation? It's hard to say. If the S&P 500 index breaks above the resistance level of 2,740, we could see continuation higher. There have been no confirmed negative signals so far. However, just like we wrote in our several Stocks Trading Alerts, the early February sell-off sets a negative tone for weeks or months to come.
Concluding, the S&P 500 index will probably extend its short-term sideways action today. However, we may see an attempt at breaking higher, as investors would likely buy stocks ahead of long holiday weekend. If the S&P 500 index breaks above 2,740, we could see some buying pressure.
Currently, we prefer to be out of the market, avoiding low risk/reward ratio medium-term trades. We will let you know when we think it is safe to get back in the market.
To summarize: no medium-term positions are justified from the risk/reward perspective at this moment.
Intraday trade:
No intraday position is justified from the risk/reward perspective today.
No medium-term position is justified from the risk/reward perspective at this moment.
Thank you.
Paul Rejczak
Stock Trading Strategist
Stock Trading Alerts

