

Briefly:
Intraday trade: The S&P 500 index lost 0.8% after opening 0.2% lower yesterday. The broad stock market will probably open virtually flat today. We may see some short-term uncertainty following yesterday's decline. We prefer to be out of the market, avoiding low risk/reward ratio trades.
Trading position (short-term; our opinion): no short-term positions are justified from the risk/reward perspective.
Our intraday outlook is neutral. Our short-term outlook is neutral, and our medium-term outlook is neutral:
Intraday outlook (next 24 hours): neutral
Short-term outlook (next 1-2 weeks): neutral
Medium-term outlook (next 1-3 months): neutral
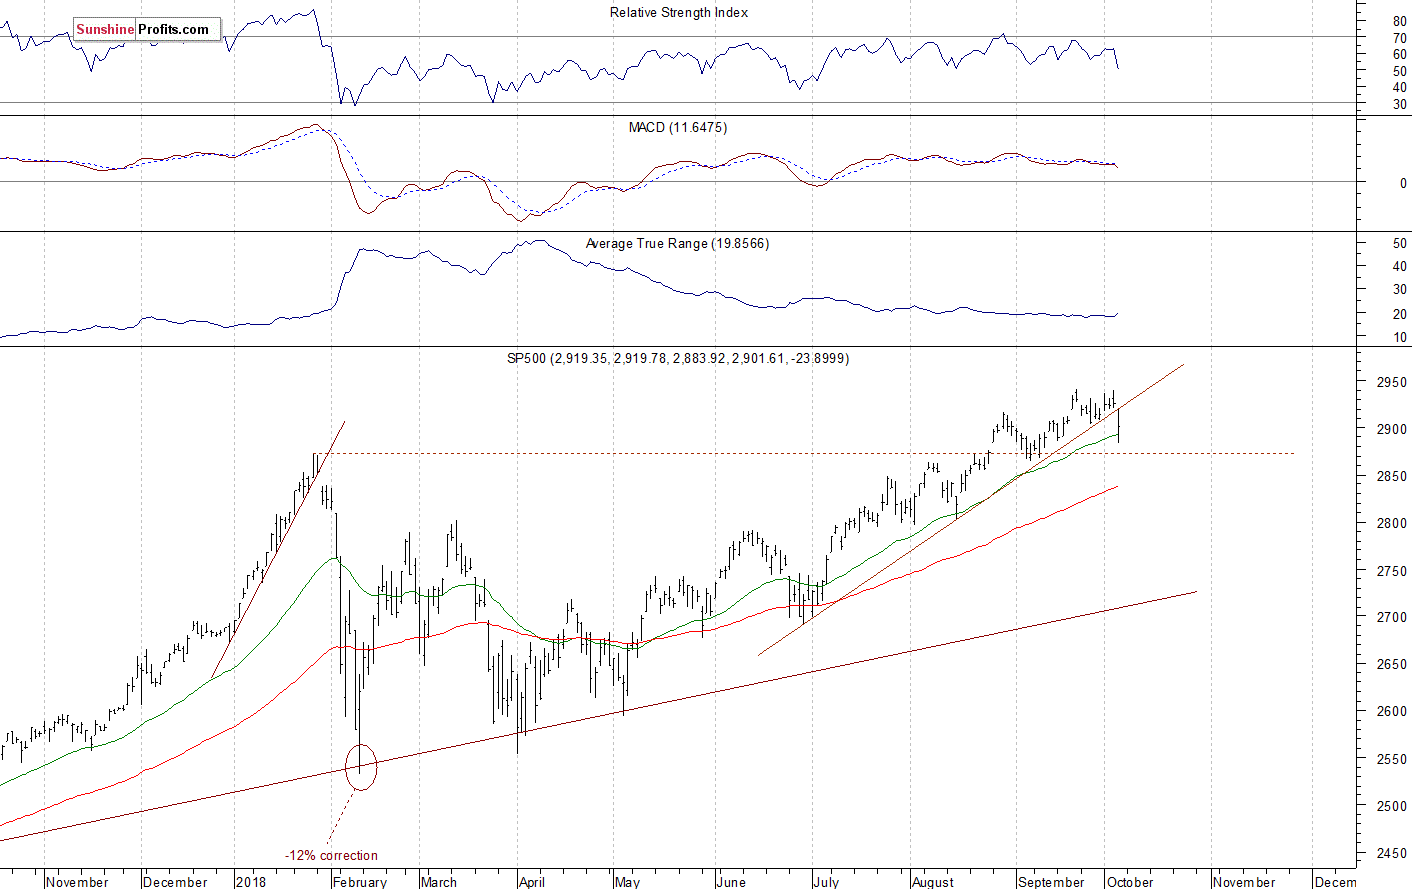
The U.S. stock market indexes lost 0.8-1.8% on Thursday, breaking below their recent trading ranges, as investors' sentiment much worsened following the bond yield's rise and some renewed trade war fears, among other factors. The S&P 500 index has reached the new record high of 2,940.91 on September the 21st. It currently trades 1.3% below that high. The Dow Jones Industrial Average lost 0.8% and the Nasdaq Composite lost 1.8% yesterday, as tech stocks were relatively weaker than the broad stock market.
The nearest important level of support of the S&P 500 index is now at around 2,900, marked by yesterday's closing price. The next support level is at 2,880-2,885, marked by yesterday's local low. The support level is also at around 2,865, marked by some previous local lows. On the other hand, the nearest important level of resistance is at 2,915-2,920, marked by the recent support level along with yesterday's daily gap down of 2,919.78-2,921.36. The resistance level is also at around 2,925-2,930, marked by last week's Monday's daily gap down of 2,923.79-2,927.11.
The broad stock market retraced most of its September's record breaking rally yesterday, as the S&P 500 index broke below its three-month long upward trend line. Is this a new downtrend or just some medium-term consolidation along the new record high? If the index remains above the late January local high, we could see more fluctuations:
Uncertainty Ahead of Jobs Data Release
Expectations before the opening of today's trading session are virtually flat, because the index futures contracts trade between -0.1% and +0.1% vs. their yesterday's closing prices. The European stock market indexes have lost 0.3-0.6% so far. Investors will wait for some important economic data announcements this morning: Nonfarm Payrolls, Unemployment Rate, Trade Balance at 8:30 a.m. The broad stock market will likely fluctuate following its yesterday's sell-off and an intraday reversal off the mentioned support level of around 2,880-2,885. For now, it looks like a short-term upward correction within a downtrend. If the index gets back above the level of 1,920, we could see more buying pressure. But the most likely scenario is some sideways movement along the level of 2,900.
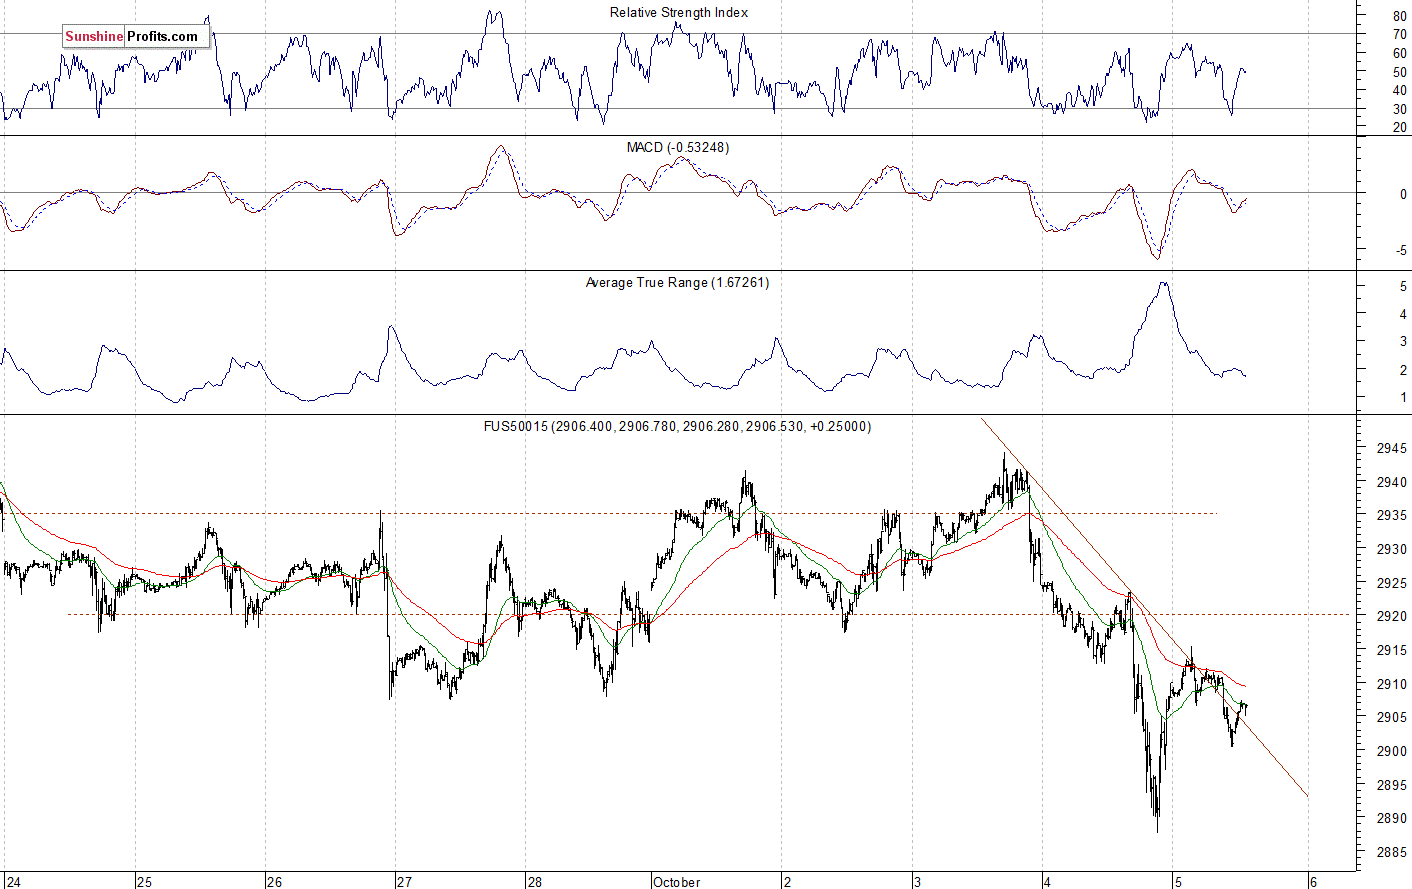
The S&P 500 futures contract trades within an intraday consolidation following yesterday's intraday rebound. The nearest important level of resistance is at around 2,920-2,925, marked by some local highs. The next resistance level is at 2,935-2,940. On the other hand, the support level is at 2,885-2,890, marked by yesterday's daily low. The futures contract broke below its recent trading range, as we can see on the 15-minute chart:
Nasdaq at 7,500 Mark Again
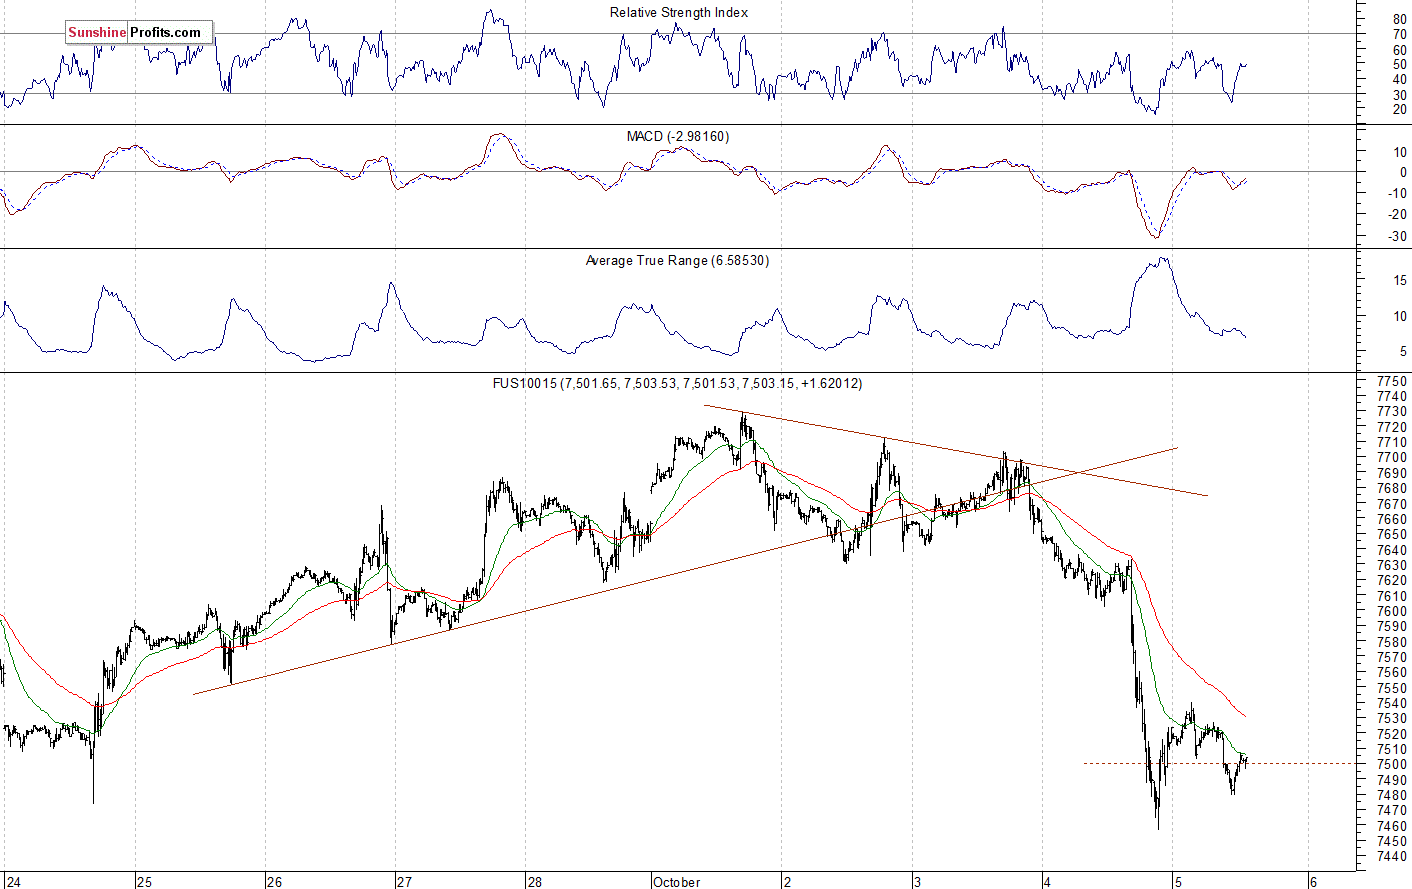
The technology Nasdaq 100 futures contract follows a similar path, as it trades within an intraday consolidation after bouncing off the support level yesterday. However, the tech stocks' gauge remains relatively weaker than the broad stock market. It broke below the level of 7,500 yesterday, as it retraced most of its recent record-breaking advance. The nearest important support level is at around 7,450, marked by the local low. The next level of support is at 7,400-7,420, marked by some August-September local lows. On the other hand, the resistance level is now at 7,550-7,600, among others. The Nasdaq futures contract trades within a relatively flat correction following the decline, as we can see on the 15-minute chart:
Apple, Amazon - Mixed Picture
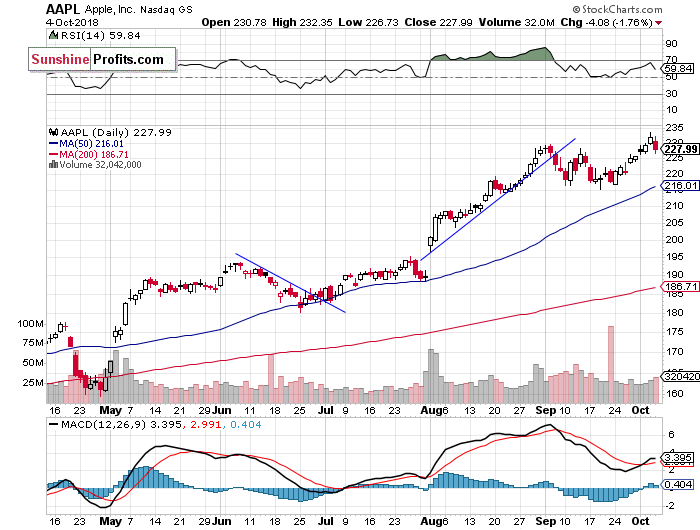
Let's take a look at Apple, Inc. stock (AAPL) daily chart (chart courtesy of http://stockcharts.com). It reached the new record high at the level of $233.47 on Wednesday, as it continued to act relatively strong. Then the stock retraced some of its rally yesterday. It is currently trading at the early September local high. Will it reverse its uptrend? There have been no confirmed negative signals so far. However, we can see some short-term negative technical divergences:
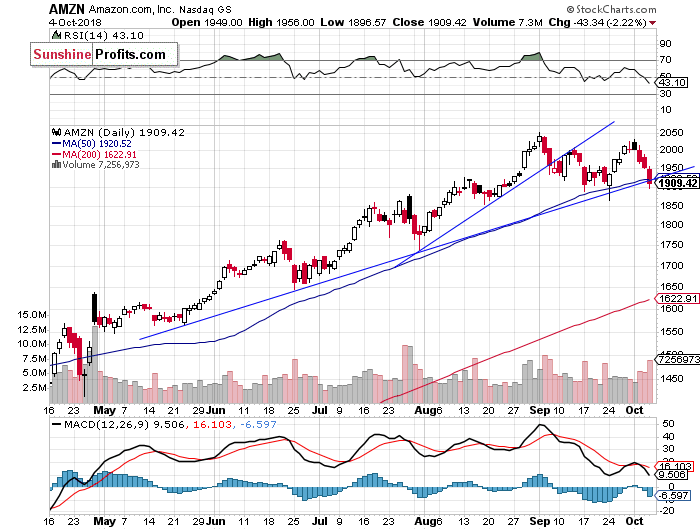
Now let's take a look at Amazon.com, Inc. stock (AMZN) daily chart. It is relatively weaker the Apple stock, as it is trading within a short-term downtrend. The stock broke slightly below its medium-term upward trend line yesterday. But will it continue below the recent local low of $1,865? If it does, we could see more selling pressure. However, it may fluctuate along the support level of its previous consolidation for some time:
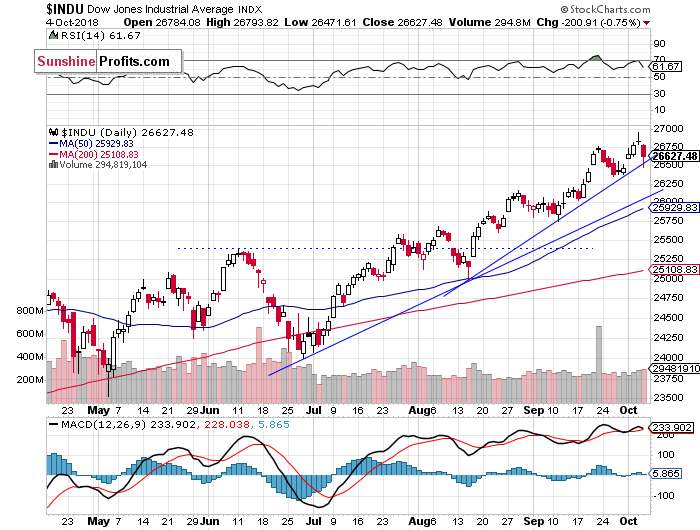
Dow Jones Still Above the Trend Line
The Dow Jones Industrial Average reached the new all-time high at the level of 26,951.81 on Wednesday. Thursday's trading session was obviously bearish, but the blue-chips' gauge managed to stay above its two-month-long upward trend line. The resistance level remains at around 27,000 and the support level is at 26,350, marked by the recent local low:
The S&P 500 index retraced most of its recent advance yesterday, as investors' sentiment worsened following the bond yield's surge, among other factors. The broad stock market's gauge is close to 2,900 mark again. But will it continue lower? Or is this just another downward correction within an uptrend? The index remains above its important medium-term support levels.
Concluding, the S&P 500 index will probably open virtually flat today. However, investors will have to react to today's Nonfarm Payrolls data release at 8:30 a.m. yet. So their expectations could change. If the index continues below its yesterday's local low, we could see more short-term selling pressure.
Intraday trade:
No intraday position is justified from the risk/reward perspective today.
Trading position (short-term; our opinion): no short-term positions are justified from the risk/reward perspective.
Thank you.
Paul Rejczak
Stock Trading Strategist
Stock Trading Alerts

