

Briefly:
Intraday trade: The S&P 500 index lost 1.7% on Monday, after opening 0.2% lower. The broad stock market will probably open lower again today. We may see some more downward action after breaking below the last week's local low.
Trading position (short-term; our opinion): no positions are justified from the risk/reward perspective.
Our short-term outlook is neutral, and our medium-term outlook is neutral:
Short-term outlook (next 1-2 weeks): neutral
Medium-term outlook (next 1-3 months): neutral
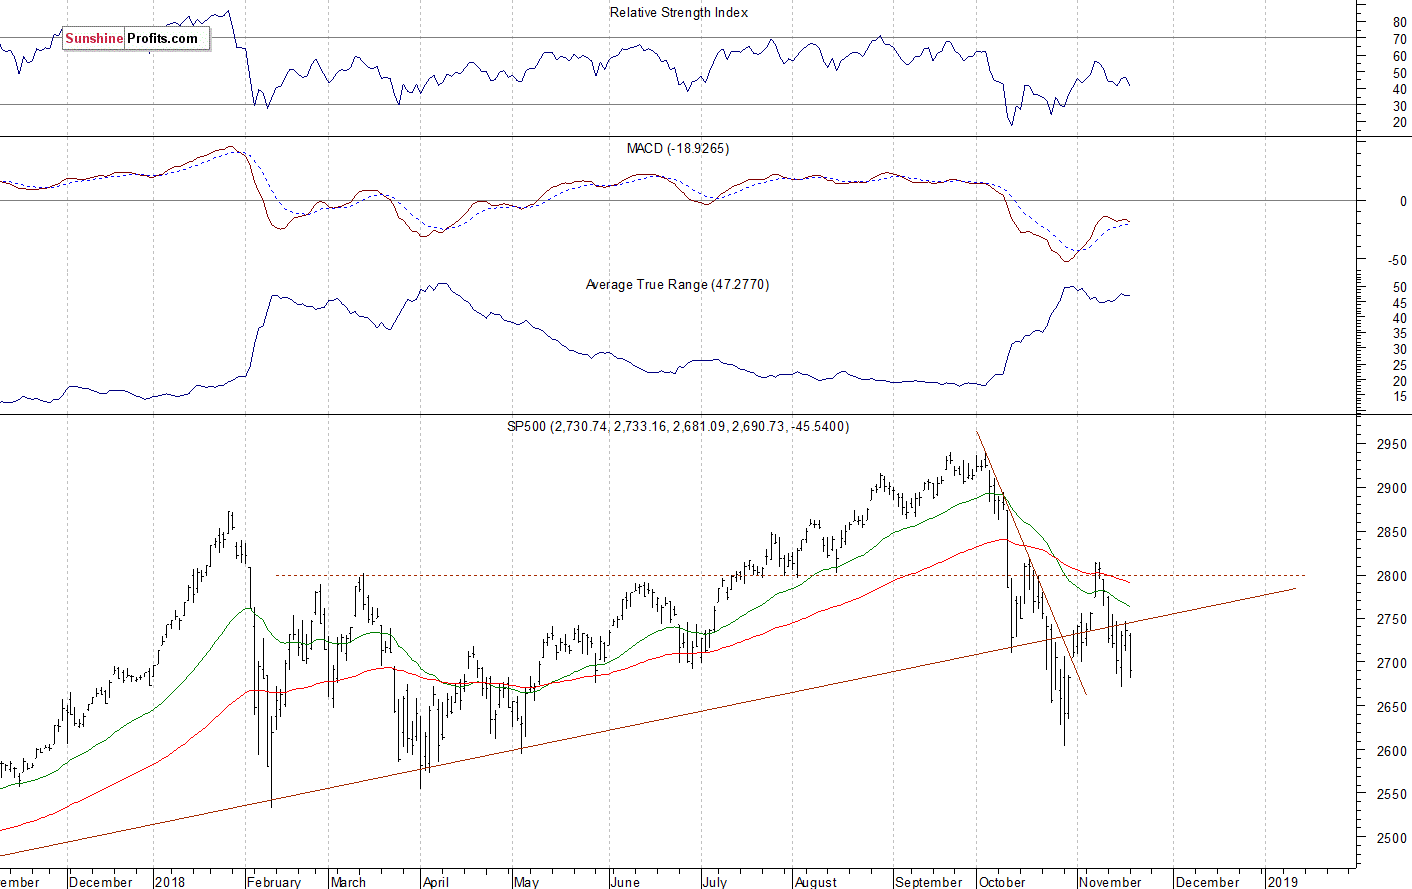
The U.S. stock market indexes lost between 1.6% and 3.0% on Monday, as investors' sentiment worsened once again following big cap tech stocks' sell-off. The S&P 500 index got closer to its Thrusday's local low of around 2,670 after breaking below 2,700 mark. The index was 11.5% below September the 21st record high of 2,940.91 three weeks ago. And now it trades 8.5% below the all-time high. The Dow Jones Industrial Average lost 1.6% and the Nasdaq Composite lost 3.0% on Monday.
The nearest important level of resistance of the S&P 500 index is now at 2,690-2,700, marked by the previous support level. The next resistance level is at 2,730-2,750, among others. On the other hand, the level of support is now at 2,650-2,670. The support level is also at 2,600-2,630, marked by the late October lows.
The broad stock market extended its downtrend three weeks ago, as the S&P 500 index fell closer to 2,600 mark. Then it quickly retraced slightly more than the 61.8% Fibonacci retracement of its September-October decline. And here it is again - below the level of 2,700, and below the long-term upward trend line, as we can see on the daily chart:
Negative Expectations Again
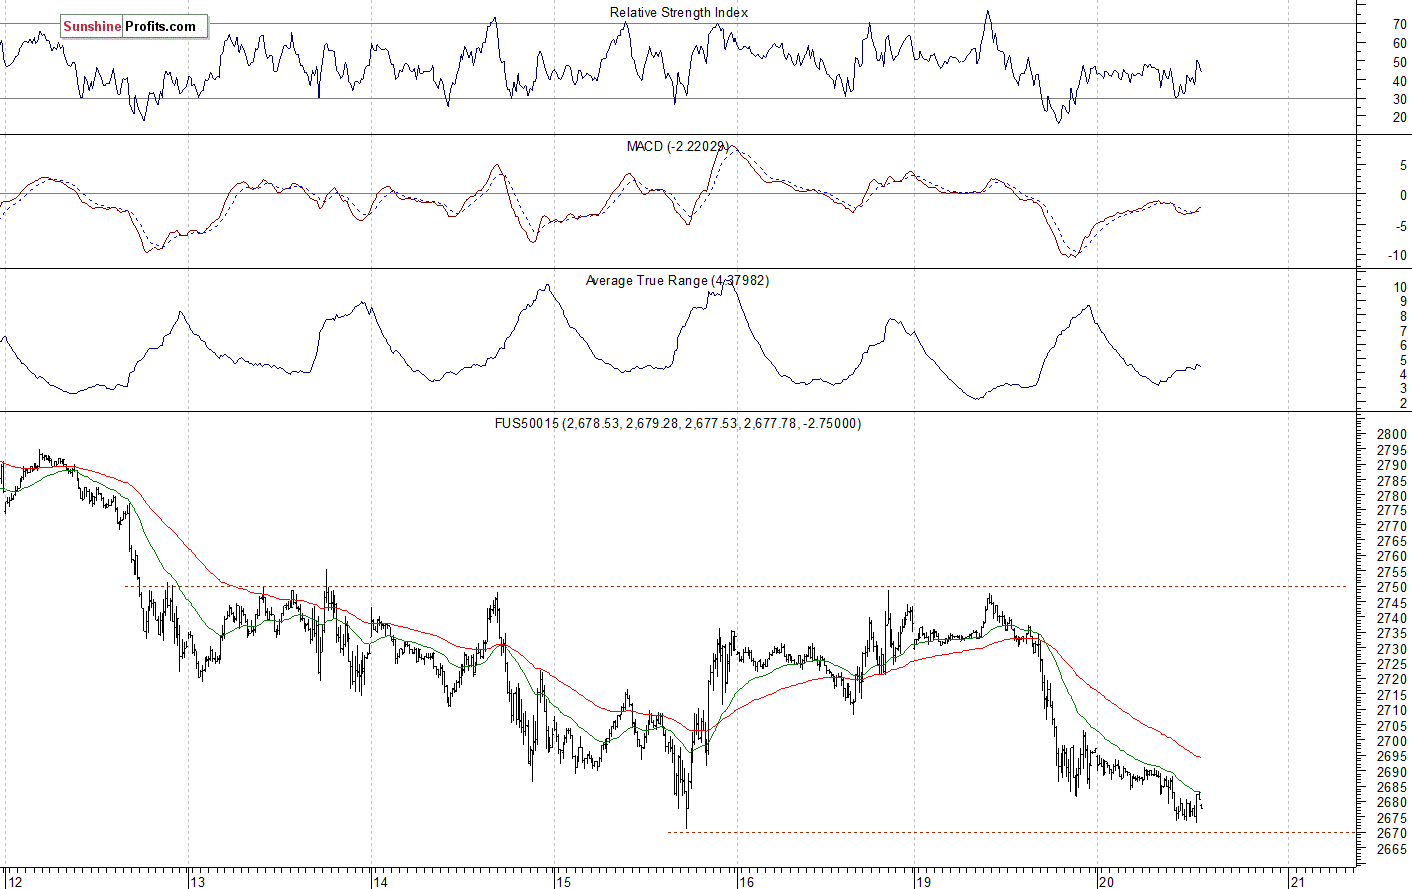
Expectations before the opening of today's trading session are negative, because the index futures contracts trade 0.5-0.9% below their Monday's closing prices. The European stock market indexes have been mixed so far. Investors will wait for some economic data announcements today: Housing Starts, Building Permits at 8:30 a.m. The broad stock market will likely extend its short-term downtrend today. However, we may see an attempt at bouncing of the support levels. There have been no confirmed positive signals so far.
The S&P 500 futures contract trades within an intraday consolidation following an overnight decline. The nearest important level of support is at around 2,670, marked by the recent local low. On the other hand, the resistance level is at 2,690-2,700, among others. The futures contract gets closer to its last week's Thursday's low, as the 15-minute chart shows:
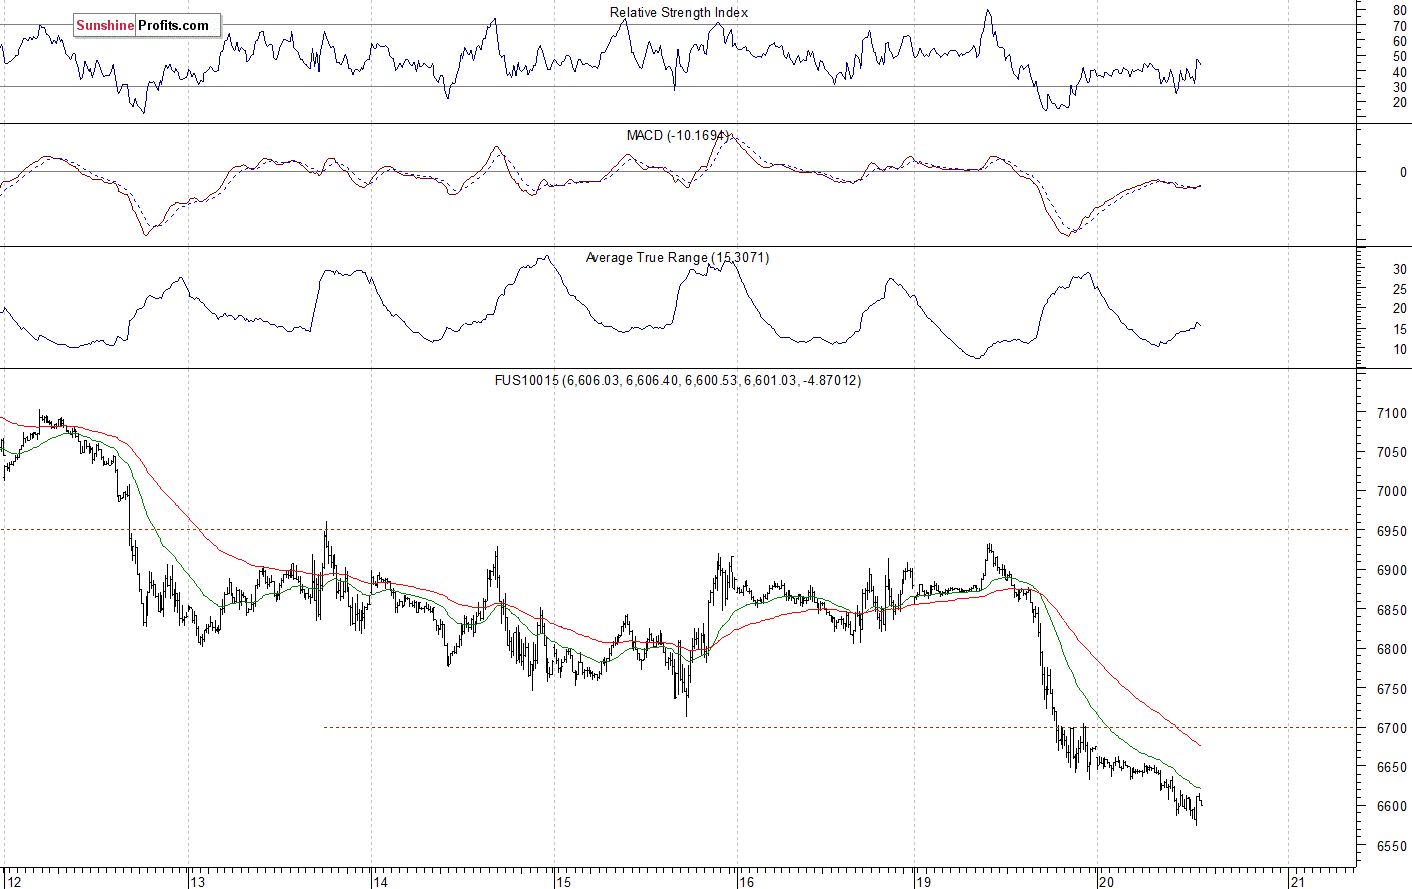
Nasdaq the Lowest Since Early May
The technology Nasdaq 100 futures contract follows a similar path, as it extends its short-term downtrend this morning. It fell below the level of 6,580 - the lowest since the early May. The tech stocks' gauge remains realtively weak vs. the broad stock market. The nearest important level of support is now at 6,580-6,600. On the other hand, the resistance level is at 6,650-6,700, among others. The Nasdaq futures contract broke below its recent trading range, as we can see on the 15-minute chart:
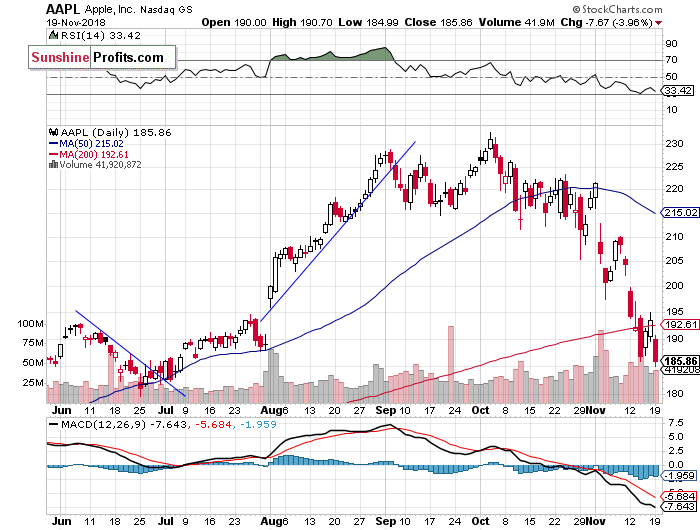
Big Cap Tech Stocks Selling Off
Let's take a look at Apple, Inc. stock (AAPL) daily chart (chart courtesy of http://stockcharts.com). Yesterday the stock fell the lowest since the early July. However, it continues to trade within a potential level of support of $185-190. We may see another attempts at bouncing off that support level:
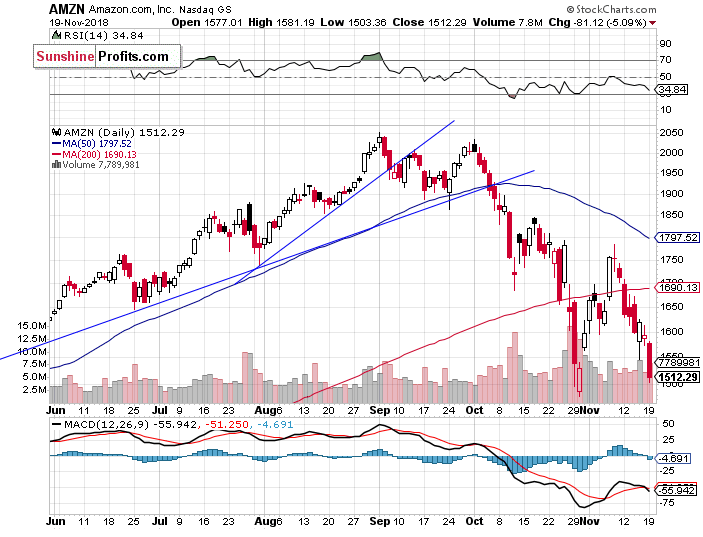
Now let's take a look at Amazon.com, Inc. stock (AMZN) daily chart. It accelerated its sell-off following quarterly earnings release in the late October. The stock continued lower, but then it bounced off the support level of $1,500. The price reached a potential resistance level of around $1,750-1,800 before reversing lower. Yesterday the stock retraced more of its recent advance, as it got closer to its late October low. If the price breaks below that support level, we could see more selling pressure:
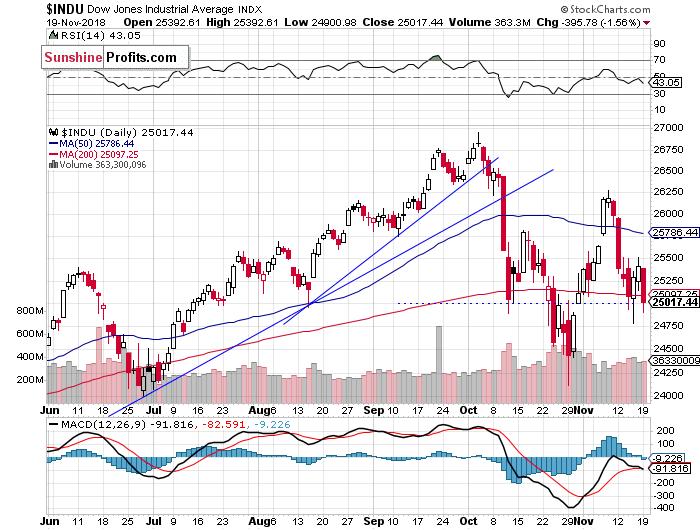
Dow Jones Still Above 25,000
The Dow Jones Industrial Average fell below 25,000 mark yesterday, before slightly bouncing off the support level. Recently it accelerated above 26,000 mark and got closer to the early October topping consolidation. Then the blue-chip stocks gauge retraced most of the rally. The nearest important level of resistance is at 25,750-26,000, and the support level remains at 24,750-25,000:
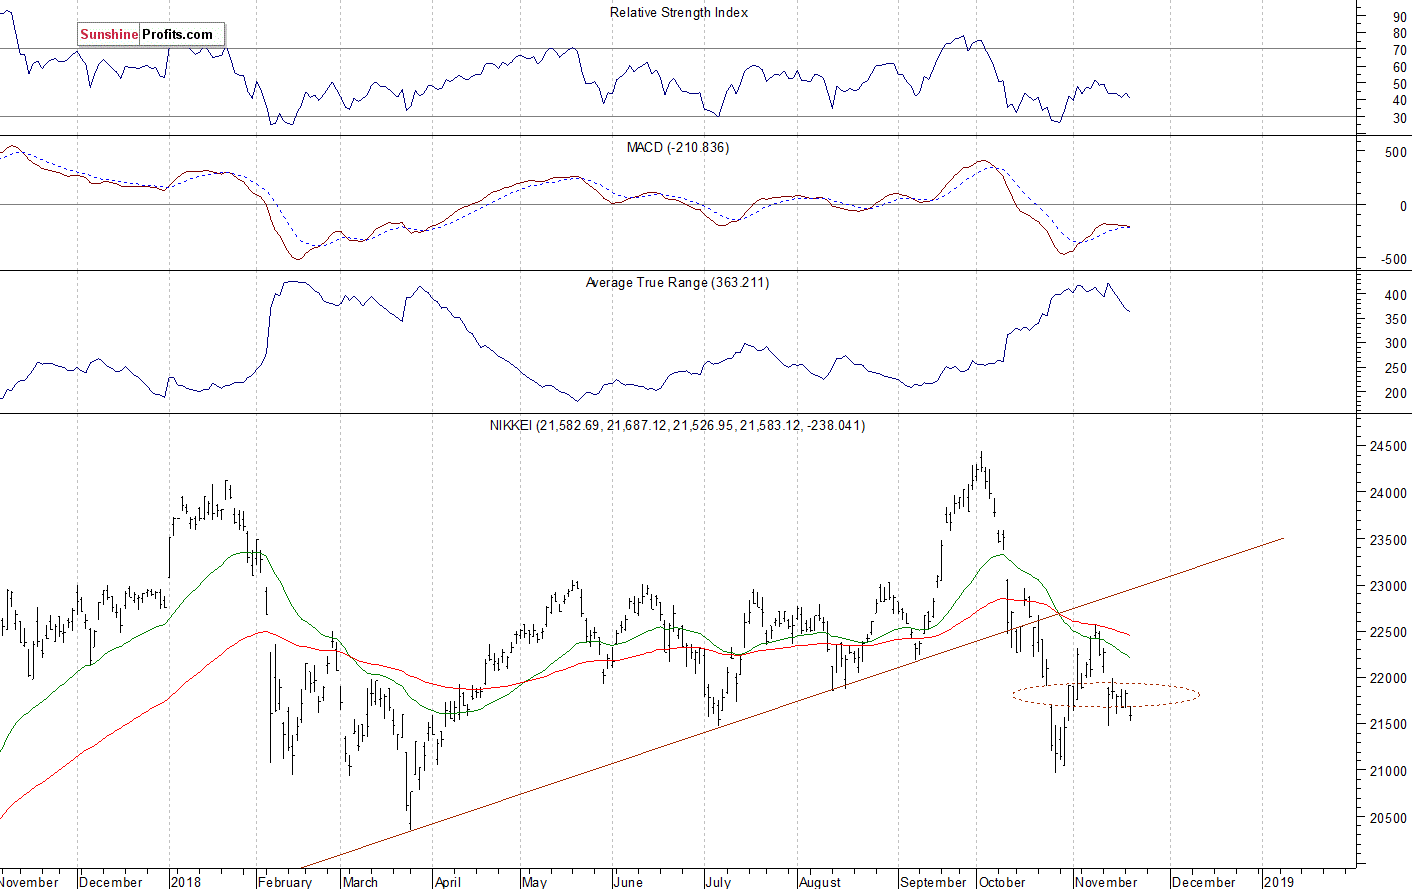
Japanese Nikkei - Breakdown or Just Consolidation?
Let's take a look at the Japanese Nikkei 225 index now. It retraced more of its October sell-off recently, but then it failed to continue higher following bouncing off the resistance level at 22,500. Then we saw more downward action. The Nikkei continues to trade below its broken long-term upward trend line. It is slightly below the October the 25th daily gap down. It still looks like a short-term consolidation:
The S&P 500 index got closer to its last week's local low yesterday, as technology stocks extended their sell-off. The market continues to trade within the support level of the October the 31st daily gap up. However, we may see an attempt at breaking below that support level and getting closer to the late October low.
Concluding, the S&P 500 index will probably open lower today and it will likely break below its last week's local low. However, we may see an attempt at bouncing of the support levels at some point. We will likely see more short-term volatility.
Trading position (short-term; our opinion): no positions are justified from the risk/reward perspective.
Thank you.
Paul Rejczak
Stock Trading Strategist
Stock Trading Alerts

