

Trading position (short-term; our opinion): long positions (100% position size) with stop-loss at 2700. As the initial upside target at 2900 has just been reached, we have our sights on the 2970 area, which is where the 61.8% Fibonacci retracement is. Stay tuned as finetuning the open trade positions' parameters over the coming days is likely.
Opening with a bullish gap, the buyers have pushed stocks higher throughout Monday. Looking at today's premarket gains, they really do have appetite for some more. Let's dig into the S&P 500 upswing and examine the health of the current advance.
Let's check yesterday's developments on the daily chart (charts courtesy of http://stockcharts.com ).
S&P 500 in the Short-Run
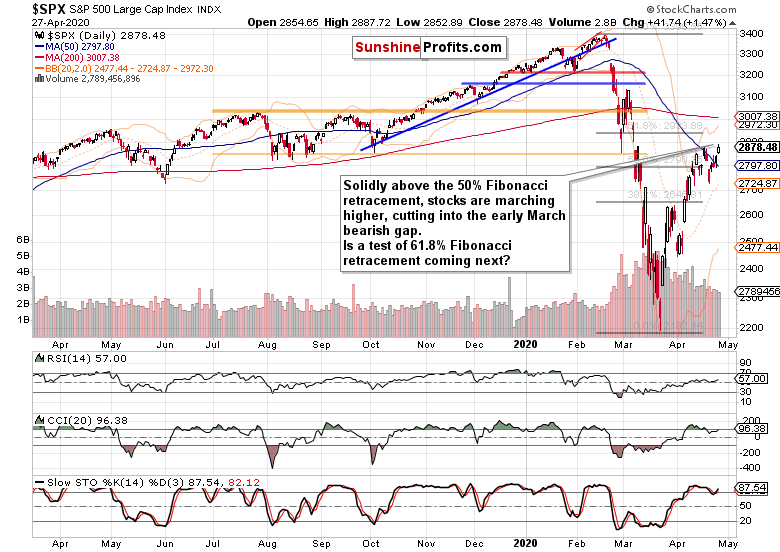
Price action is moving more and more away from the 50% Fibonacci retracement, and judging by today's strong premarket action, we're virtually guaranteed to see it confirmed by the third consecutive close above it. Stock bulls aren't really looking back, and have also broken above the 50-day moving average.
Volume remains solid, and doesn't pose an obstacle to the bullish case. Despite their extended readings, the daily indicators are looking increasingly supportive of the upswing as well.
Could it be that we're looking at a double top in progress here? The fact that prices are challenging local highs is no hint or guarantee of getting one, and the following two sections of today's analysis will show you why.
The Credit Markets' Point of View
Yesterday, we showed you the high yield corporate bonds to short-term Treasuries ratio overlaid with the S&P 500. We took a look at the recent past, and pointed out that:
(...) In early April, the ratio had also been on a downswing, and on Apr 3 (also Friday, by the way), it hit a new low while stocks didn't. Should the recent history repeat itself, we could be looking at credit markets again leading stocks higher.
Considering yesterday's closing prices, this is the current look of the above-mentioned chart.
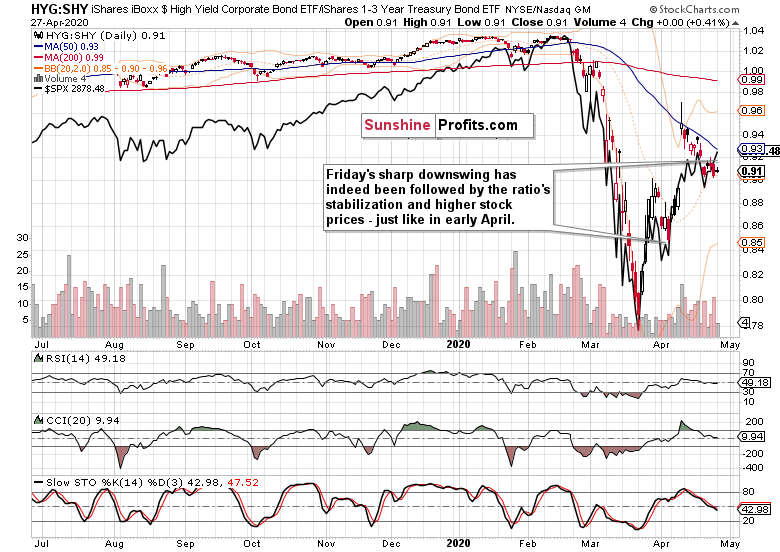
Both the ratio and high yield corporate debt (HYG ETF) stabilized yesterday above Friday's closing values, and stocks indeed marched higher just as they did at the beginning of April. It's encouraging to see that stocks anticipate improving financial conditions.
Let's examine the reflections of the S&P 500 advance in its key sectors and ratios.
Key S&P 500 Sectors and Ratios in Focus
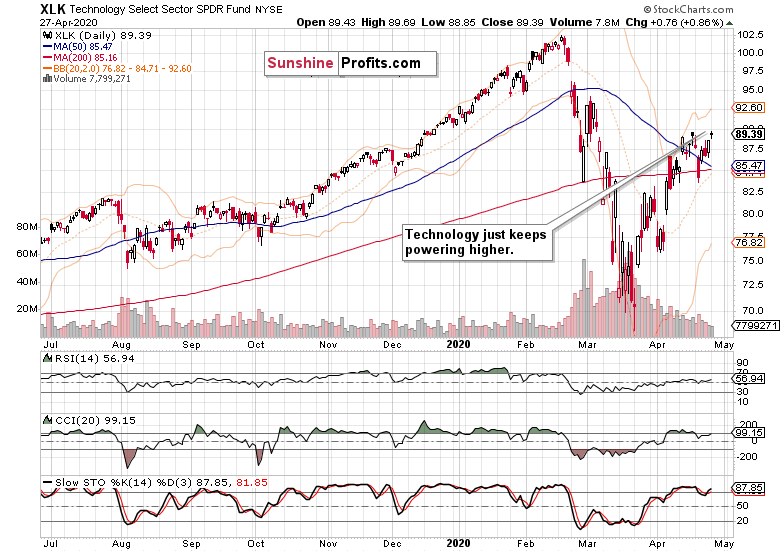
Technology is leading the index higher, and appears primed for more gains. While the lower volume warrants caution, the relative absence of sellers (be it bears or profit-takers) is encouraging. After today's market close, Alphabet's earnings will be announced - it's bellweather for this week's upcoming reports by other tech heavyweights.
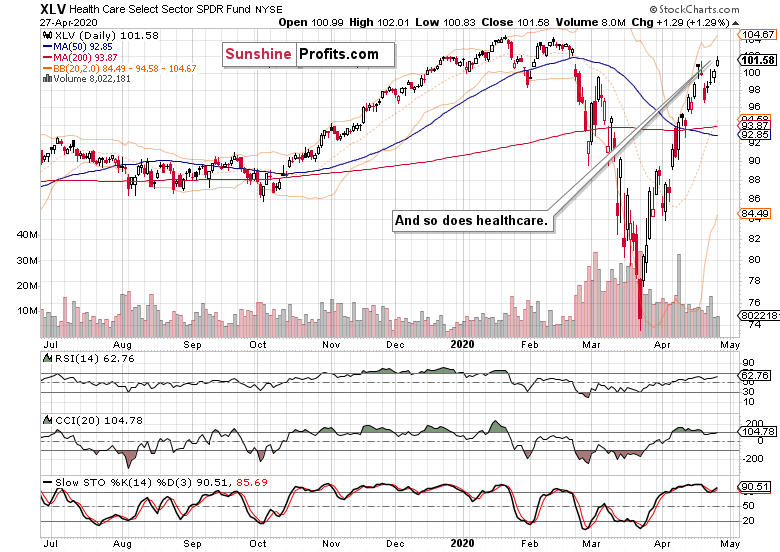
As the caption says, healthcare is also pointing to gains ahead. While the volume examination still misses higher values, it appears to have stabilized and moved actually higher. Just as with technology, continuation of the upswing appears to be most likely in the cards.
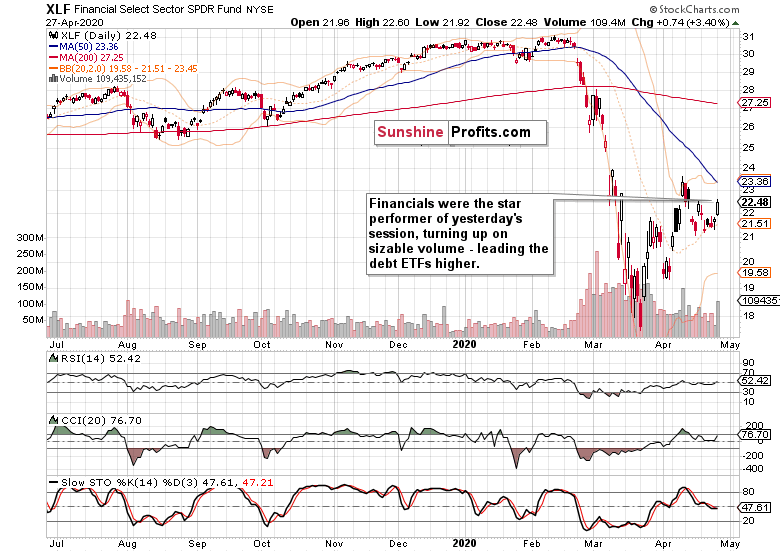
Our Friday's takeaway was that financials don't appear to be willing to decline much further these days and that the odds favor their next move to be up. And in line with anticipation and the signals from the credit markets, they've indeed turned steeply higher yesterday. This development bodes well for the risk-on assets and further index gains.
Talking risk-on, both energy (XLE ETF) and materials (XLB ETF) are leading higher as they challenge their April highs. Considering yesterday's renewed selling in oil, that's indeed promising for higher stock prices.
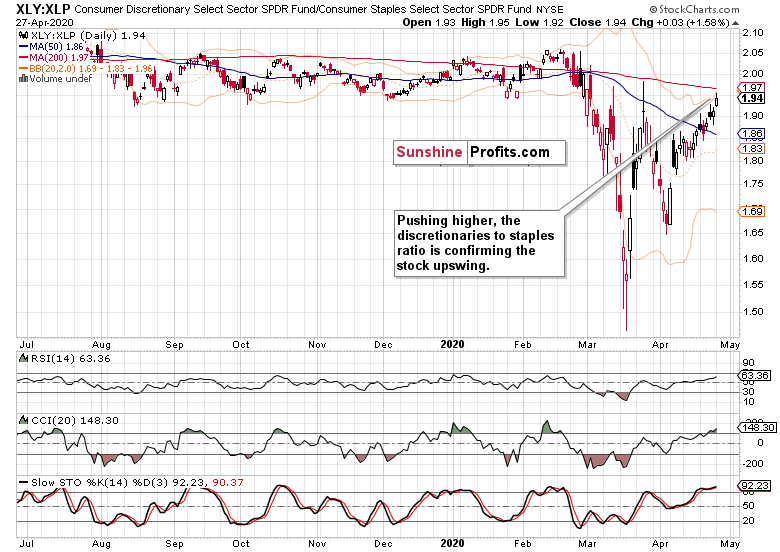
The dicretionaries to staples ratio provides more colorful insights. Just as the financials to utilities ratio (XLF:XLU), it moved higher yesterday. This leading metric is now trading above its March highs, reflecting increasing appetite for stocks.
The Fundamental S&P 500 Outlook
It's not just the tech earnings this week that will move the markets - it'll be tomorrow's Fed announcement too. Their prior interventions to stabilize the markets have worked, and downswing attempts didn't really stick. With all the quantitative tightening reversed, the Fed balance sheet moved from the QE3 peak of below $4.6T to over $6.5T currently. The repo operations were just an appetizer as their balance sheet has ballooned by well over $2T just in the last one and a half months.
Do the markets expect a new move out of this meeting? Yesterday, Bank of Japan took some more action, whetting the appetite around the world. But will the Fed deliver in a meaningful way? Probably not, as we look rather to the wait-and-see attitude to win overall at this meeting with perhaps a few bones thrown here and there.
Should the Fed meeting outcome be largely along these lines, stocks may waver thereafter. But the tape tells us that the expectations are for the Fed to have the bulls' back.
From the Readers' Mailbag
Q: Do you think stocks can drop at all besides very minor corrections with this fed repo going on and Trumps reelection chances in limbo needing the market to be stable?
A: Despite the many alphabet soup programs introduced since the Lehman collapse, it didn't prevent stocks from declining into the March 2009 low. This goes to show that market forces can overpower quite a few Fed interventions. The market also likes to anticipate the next Fed move and can force its hand. Do you remember the taper tantrum or the Dec 2018 stock plunge on tough Fed talk?
The markets can and do bet against the Fed from time to time. Does it look like they're betting against the central bank now? Not really. But that can change. Imagine what if it becomes generally accepted that the coronavirus situation isn't really improving over the coming weeks? Or that ending the lockdowns has happened too early, and we're back to square one? Or that the V-shaped recovery isn't what we have in front of our very eyes?
This would mean that the economic hit, earnings hit, small business hit and unemployment situation wouldn't be magically reversed by hitting the restart button. This way, it would become once again acknowledged that the underlying issue is not of monetary nature, and can't be really solved by money printing. Are we at that moment? No. Does it need to arrive? At some point in the future, perhaps or probably seem to be the best answers. This is why despite the current bullish action and setups, the S&P 500 upswing can still roll over to the downside.
How far will it reach before doing that, and how deep will it fall? The market will tip its hand, and the best we can do, is stay alert to the winds of change.
So yes, stocks can indeed fall beyond very minor corrections - that's the short answer.
As for Trump, sure he would love to see a well-performing stock market and economic confidence reflected there. However, handling of the corona crisis that inspires public approval, is of arguably just as great importance. Whether he proves himself to be a decisive and measured leader - the truth is in the eyes of the public. And it's the same with stocks.
Q: What sectors will be positioned for a sharp bounce when we reach the bottom
A: Within our sectoral analysis, we'll see the signs of resilience. In general, materials (XLB ETF) and industrials (XLI ETF) can be expected to take the lead, followed by energy (XLE ETF). All of these are pointing higher as they look to overcome their April highs. This would point to an early recovery, aka stealth bull market. As it climbs the wall of worry (and our recent article titles reveal where we stand on this issue), don't expect plain smooth sailing ahead.
Q: Do you have a time frame for the bottom?
A: We're best advised to read the tape, and watch the money flows, sectors and ratios. The next local bottom can just as easily happen as late as around Labor Day. Judging by history, September storms are not that unprecedented in the stock market - but the picture will get clearer day by day. In the current environment, we have to stay nimble and alert - that's the only way to deal with whatever curveball lands at ours.
Summary
Summing up, S&P 500 is trading solidly above the 50% Fibonacci retracement, and primed for further gains. The key sectors and their ratios (financials to utilities, and especially discretionaries to staples) favor the upswing attempt to continue, and so does today's bullish gap. Credit markets stopped declining, and financials have sharply rebounded in a nod to the unfolding stock upswing. The ease with which bad news (economic or corona-related) are ignored, gives the bulls the benefit of (perhaps even more than) a short-term doubt. Our profitable long position remains justified.
Trading position (short-term; our opinion): long positions (100% position size) with stop-loss at 2700. As the initial upside target at 2900 has just been reached, we have our sights on the 2970 area, which is where the 61.8% Fibonacci retracement is. Stay tuned as finetuning the open trade positions' parameters over the coming days is likely.
Thank you.
Monica Kingsley
Stock Trading Strategist
Sunshine Profits - Effective Investments through Diligence and Care

