

Briefly:
Intraday trade: Our Thursday's intraday outlook was neutral. The S&P 500 index gained 0.8% after opening 0.4% higher. The market extended its over two-week-long consolidation following March move down. We will probably see more short-term uncertainty. Therefore, we still prefer to be out of the market, avoiding low risk/reward ratio trades.
Medium-term trade: In our opinion, no medium-term positions are justified.
Our intraday outlook is neutral. Our short-term outlook is neutral, and our medium-term outlook is neutral:
Intraday outlook (next 24 hours): neutral
Short-term outlook (next 1-2 weeks): neutral
Medium-term outlook (next 1-3 months): neutral
The U.S. stock market indexes gained between 0.8% and 1.2% on Thursday, as investors' sentiment improved following economic news, quarterly earnings releases. The S&P 500 index is trading 7.2% below its January 26 record high of 2,872.87. The Dow Jones Industrial Average gained 1.2%, and the technology Nasdaq Composite gained 1.0% yesterday.
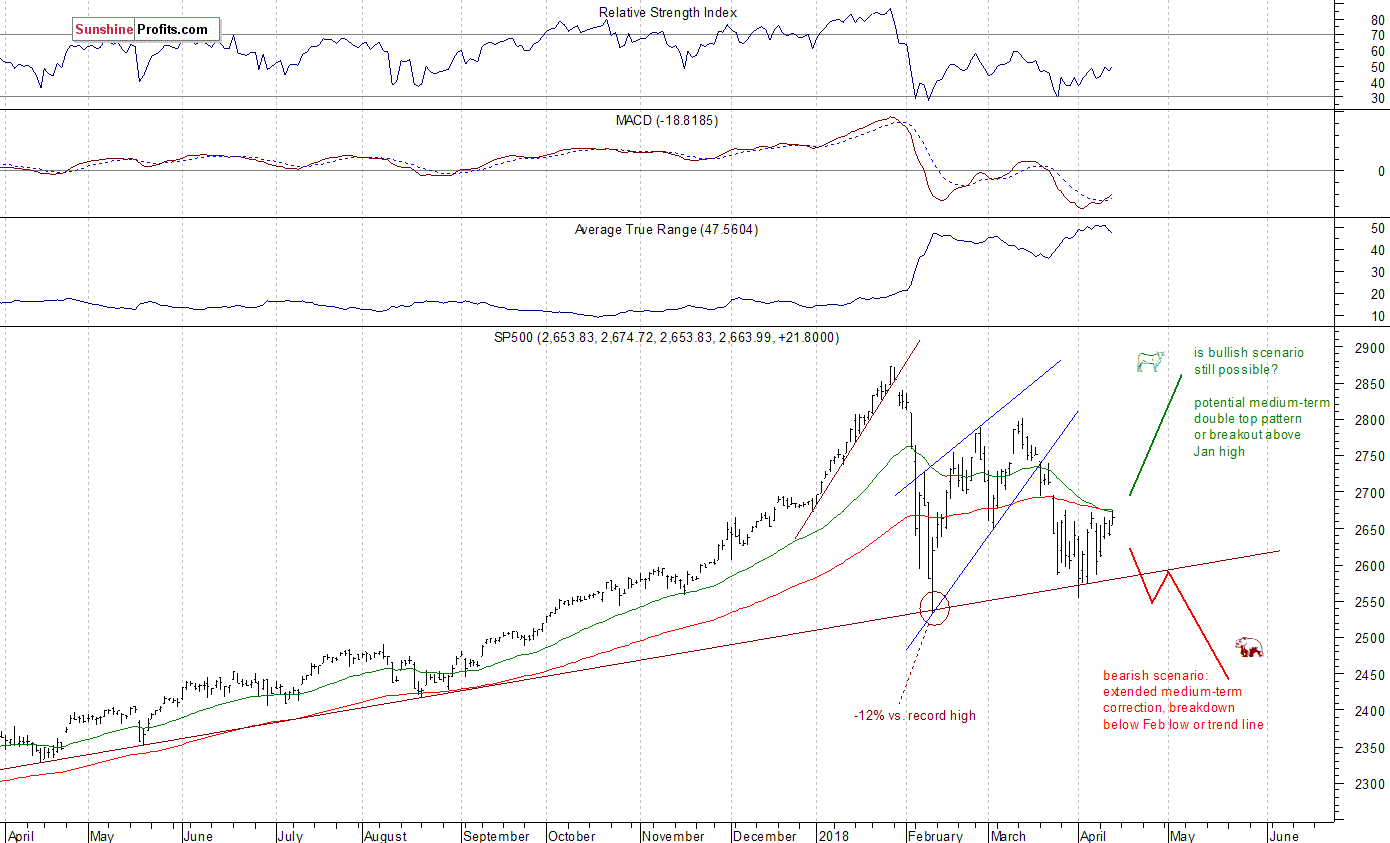
The nearest important level of resistance of the S&P 500 index remains at around 2,670-2,675, marked by last weeks' local highs. The resistance level is also at 2,695-2,710, marked by March 22 daily gap down of 2,695.68-2,709.79. On the other hand, the nearest important level of support is at 2,650-2,655, marked by yesterday's daily low. The next support level is at 2,635-2,640, marked by local lows.
We can see that stocks reversed their medium-term upward course following whole retracement of January euphoria rally. Then the market bounced off its almost year-long medium-term upward trend line, and it retraced more than 61.8% of the sell-off within a few days of trading. The uptrend reversed in the middle of March, and stocks retraced almost all of their February - March rebound. The index got back down to its medium-term upward trend line. There are still two possible future scenarios. The bearish one, leading us to February low or lower after breaking below medium-term upward trend line, and bullish: medium-term double top pattern or breakout higher. Last Friday's sell-off made the bearish case more likely, but then the market got back higher again. The broad stock market index continues to trade within a short-term consolidation along the above-mentioned upward trend line:
Closer to Breakout
Expectations before the opening of today's trading session are slightly positive, because the index futures contracts are trading between +0.1% and +0.3% vs. their Thursday's closing prices right now. The European stock market indexes have been mixed so far. Will stocks take another attempt at breaking above their short-term consolidation? It may happen if sentiment further improves ahead of coming quarterly earnings releases. Investors will also wait for some economic data announcements: Michigan Sentiment, JOLTS Job Openings at 10:00 a.m.
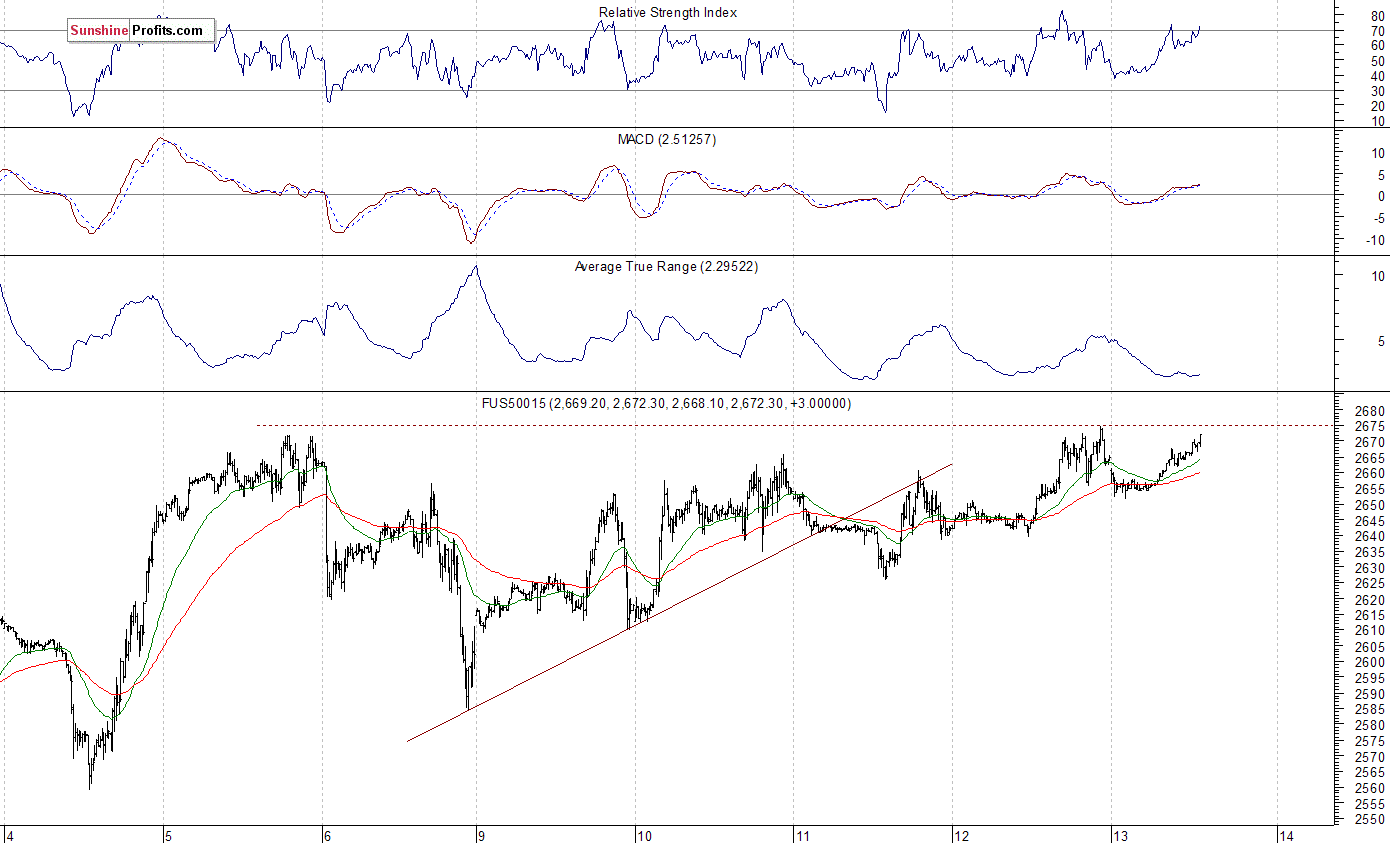
The S&P 500 futures contract trades within an intraday uptrend, as it retraces most of its yesterday's intraday move down. The market is closer to breaking above its over two-week-long consolidation. The nearest important level of resistance is at around 2,675, marked by local high. The next level of resistance is at 2,695-2,700, marked by previous support level. On the other hand, support level is now at 2,650-2,655, marked by local low. The support level is also at around 2,640. The futures contract trades close to yesterday's daily high, as the 15-minute chart shows:
New Uptrend or Just Upward Correction?
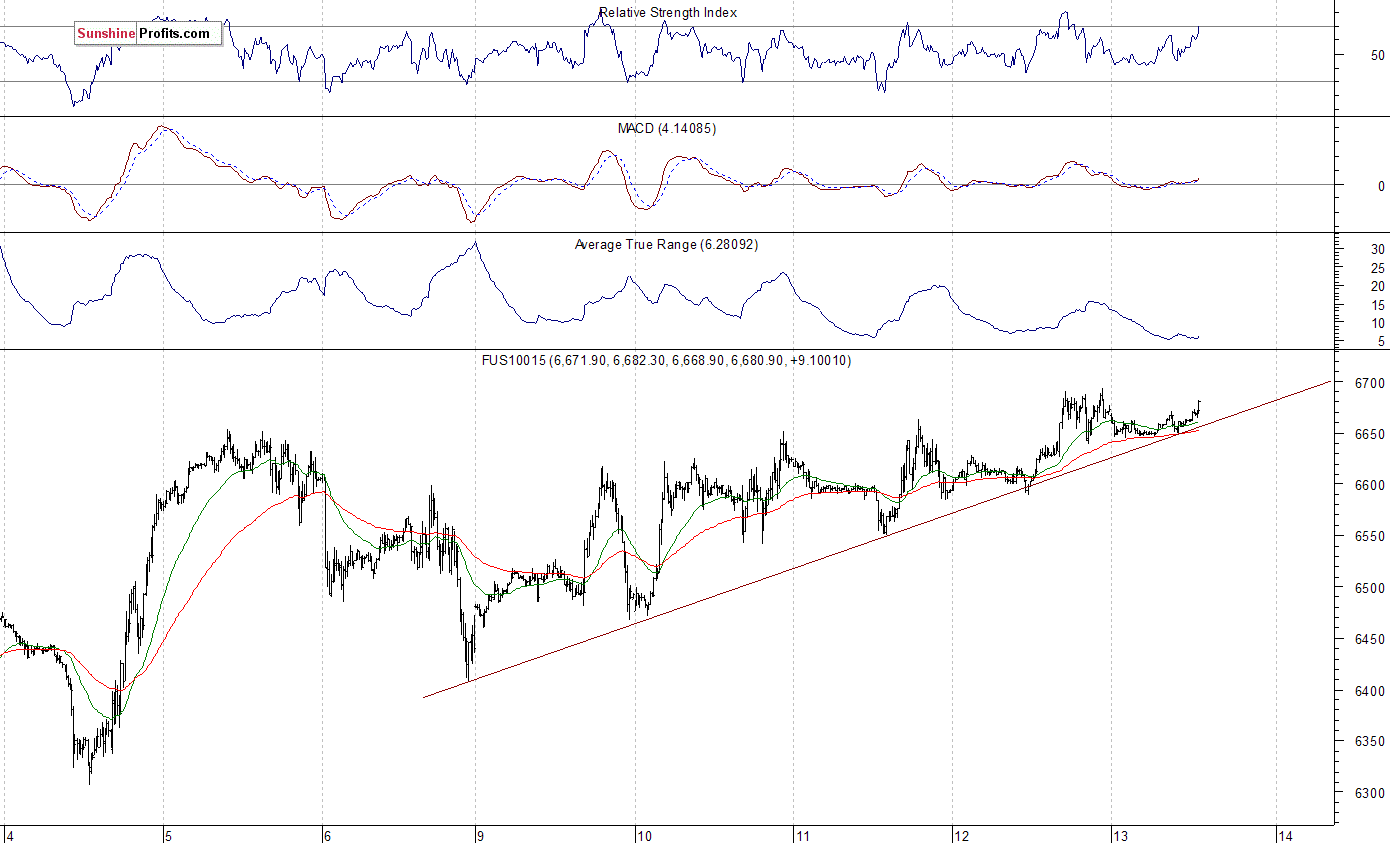
The technology Nasdaq 100 futures contract follows a similar path, as it retraces some of its yesterday's intraday decline. The market got closer to 6,700, after breaking above its two-week-long consolidation. The volatility remains somewhat lower than a few days ago when the index bounced off 6,300 mark. Will tech stocks continue higher and retrace more of their sell-off from mid-March record high? It's hard to say. For now, it looks like an upward correction within a medium-term downtrend. The Nasdaq futures contract trades above its short-term upward trend line, as we can see on the 15-minute chart:
Apple, Facebook - Mixed Picture
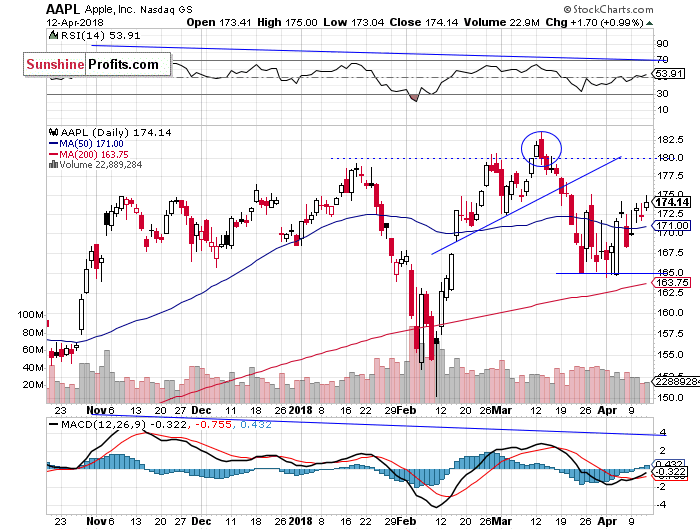
Let's take a look at Apple, Inc. stock (AAPL) daily chart (chart courtesy of http://stockcharts.com). The market broke slightly above its recent trading range, but it remained below the resistance level of $175. Is this a new uptrend or just topping pattern before downward reversal? If the market breaks above the resistance level, it could retrace more of March sell-off and get close to record high again. On the other hand, support level remains at $165:
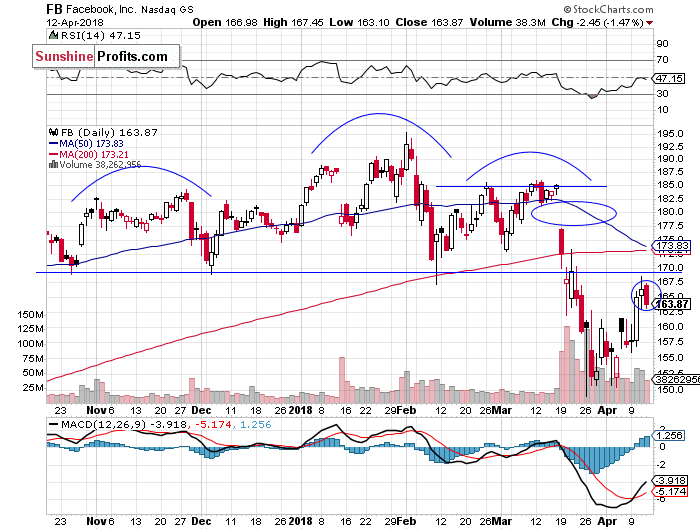
Now let's take a look at Facebook, Inc. (FB) daily chart again. The price broke above its short-term consolidation on Tuesday, as it retraced some of its late March sell-off. Investors' sentiment improved after Mark Zuckerberg' Senate hearing. It continued higher on Wednesday, but failed to extend the short-term uptrend yesterday. The price remains below medium-term head and shoulders downward reversal pattern. The nearest important level of resistance is at around $170. On the other hand, support level remains at $150-155, marked by recent local lows. For now, it looks like an upward correction. We can see a negative bearish engulfing candlestick pattern:
Dow Jones at Downward Trend Line
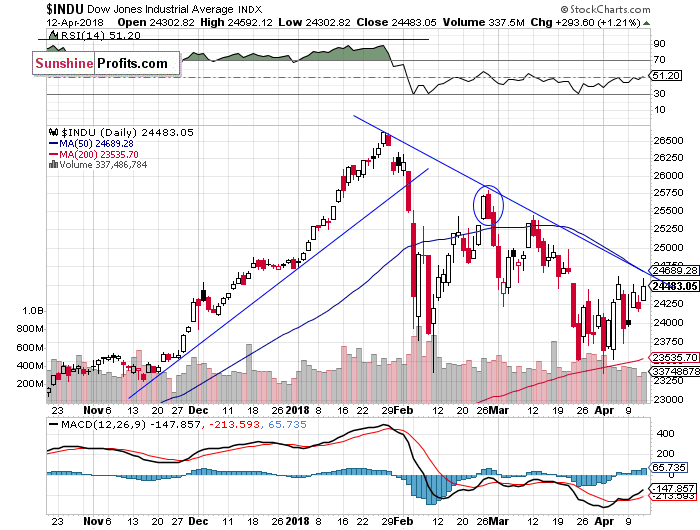
The Dow Jones Industrial Average formed a positive "Harami" candlestick pattern over a week ago. Since then it retraced some of its March move down. However, it continued to trade below the resistance level of 24,500. There is also resistance level at around 24,800, marked by medium-term downward trend line. Will the blue-chip index continue higher? It would have to break above the trend line:
Concluding, the S&P 500 index will likely extend its short-term fluctuations today, following higher opening of the trading session. The market is much closer to breaking above its over two-week-long consolidation, but there may be some uncertainty ahead of weekend and potentially negative global politics news. However, it seems that coming quarterly corporate earnings releases slightly outweigh trade war fears, Syrian conflict escalation worries at this moment.
The early March rally failed to continue following monetary policy tightening, trade war fears, negative political news. What was just profit-taking action, quickly became a meaningful downward reversal. Breakdown below over-month-long rising wedge pattern made medium-term bearish case more likely, and after some quick consolidation, the index accelerated lower, towards its early February low. Just like we wrote in our several Stocks Trading Alerts, the early February sell-off set the negative tone for weeks or months to come. However, recent fluctuations may be some bottoming pattern before an upward reversal.
Currently, we prefer to be out of the market, avoiding low risk/reward ratio medium-term trades. We will let you know when we think it is safe to get back in the market.
To summarize: no medium-term positions are justified from the risk/reward perspective at this moment.
Intraday trade:
No intraday position is justified from the risk/reward perspective today.
No medium-term position is justified from the risk/reward perspective at this moment.
Thank you.
Paul Rejczak
Stock Trading Strategist
Stock Trading Alerts

