

Another day, another all-time large-cap equity index high, right? Today, let’s take a look at an ETF that could interest traders looking for a contrarian strategy.
The bull market has continued, albeit with some warning signs beneath the surface of the market.
Last week, markets flexed their resiliency muscles by quickly erasing a 700 + point Dow Jones Industrial Average on Monday and ending the week at all-time highs. Easy monetary policy has continued, and liquidity is high. There was no shortage of buyers that were ready, willing, and able to buy that dip.
Even though the Fed has telegraphed its message of increasing rates in the future, Fed bond purchases have continued for the time being. The purchasing of these bonds helps to keep rates lower and create liquidity across markets.
Since June of 2020, the Fed has been buying $80 billion a month in Treasury bonds and $40 billion in MBS (Mortgage Backed Securities).
There is quite a lot happening this week. Consumer Confidence is set for release tomorrow. We will hear from Fed Chair Powell on Wednesday with the FOMC statement and the subsequent conference call. Advance GDP and Core PCE are on the table for later in the week.
All of the above happens during earnings week for the tech giants, namely Apple, Facebook, Google, Tesla, Amazon, and Microsoft.
What can we do on a week like this when the S&P 500 is at or near an all-time high?
Last week, we examined the divergence of the Dow Jones Transports and the Dow Jones Industrial Average.
The Transports:
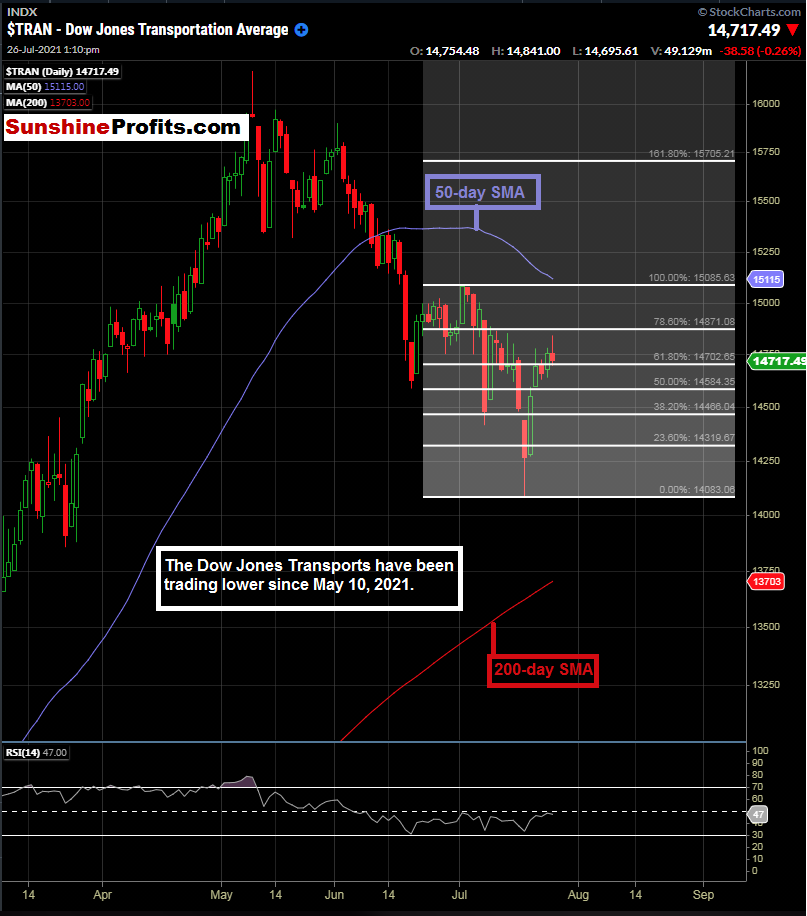
Figure 1 - Dow Jones Transportation Average March 8, 2021 - July 26, 2021, Daily Candles Source stockcharts.com
Transports have been weak, and today the index traded up to and touched the 78.6% Fibonacci retracement level from its July 1, 2021, high to its July 19, 2021 low. What is going on with the transports?
We can see lower highs and higher lows that have been occurring since May. Today is providing a nice bounce and intraday reversal so far.
As we can see, there is a downtrend in place in an otherwise sector uptrend dominant marketplace, let’s go with what is working here.
Looking for an ETF to take advantage of this downtrend is no easy task. Currently, I do not see a liquid way to take the inverse side of the transportation, so we will examine a short position in IYT.
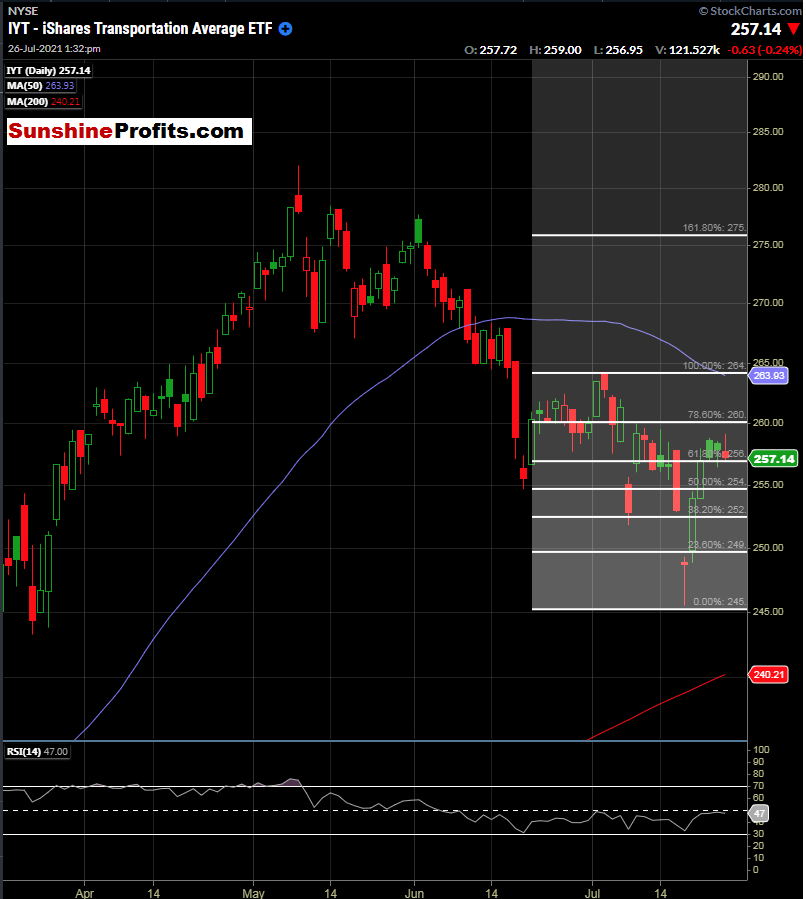
Figure 2 - iShares Transportation Average ETF March 18, 2021 - July 26, 2021, Daily Candles Source stockcharts.com
We see IYT doing its job rather well, seeking to track the investment results of an index composed of U.S. equities in the transportation sector.
Considering this downtrend could be a way to gain some alternative exposure in today’s market.
We are in a big earnings and economic data release week. There could be volatility in either direction in the major indices.
Since I am cautious on the indices in the current landscape per previous Stock Trading Alert publications, a trade in the transports could be a way to take advantage of an existing countertrend, while the major market indices have been trading at highs.
Let’s consider establishing a short position in IYT between $256.87 and $259.99 with a target between the recent low of $249.28 and the 200-day moving average of $240.21 (currently).
We will monitor this market each day!
To sum up the current viewpoint and opinion:
I have BUY opinions for:
NONE
I have SELL opinions for:
- iShares Transportation Average ETF (IYT) between $257.00 and $259.99 with a target between the recent low of $249.28 and the 200-day moving average of $240.21 (currently). Always use a stop order that caters to your individual risk tolerance.
I have a HOLD opinion for:
- First Trust NASDAQ Clean Edge Smart Grid Infrastructure Index Fund (GRID). Update 07/26: GRID was trading at $94.41 the last time I checked. Daily RSI(14) at 59.25 suggests it has room to run. Looking for high $90.00’s / overbought conditions to ring the register since our initial long entry between $86.91 and $88.17 in our May 6th publication. Always use a stop order that caters to your individual risk tolerance.
- Invesco MSCI Sustainable Future ETF (ERTH). Update 07/26: No changes here. This one is also right near the current 50-day MA of $65.70. If not on board, I think there is still time to act. Use limit orders and do not chase. Always use a stop order that caters to your individual risk tolerance.
- Invesco Solar ETF (TAN). Update 07/26: TAN is currently sitting right near its 50-day SMA of $81.82. I like this one for a longer term swing to a longer term position trade. Consider it today for the long side if not already on board. Do not chase. Always use a stop order that caters to your individual risk tolerance.
Thanks for reading today’s Stock Trading Alert. Your readership is valued and appreciated.
Have a great day!
Thank you,
Rafael Zorabedian
Stock Trading Strategist

