

-
S&P 500 Going Sideways - Are We Getting Close to Breaking Out?
June 23, 2022, 9:09 AMThere’s still no clear direction, as stock prices continue to fluctuate following their mid-June sell-off. So is this a bottoming pattern?
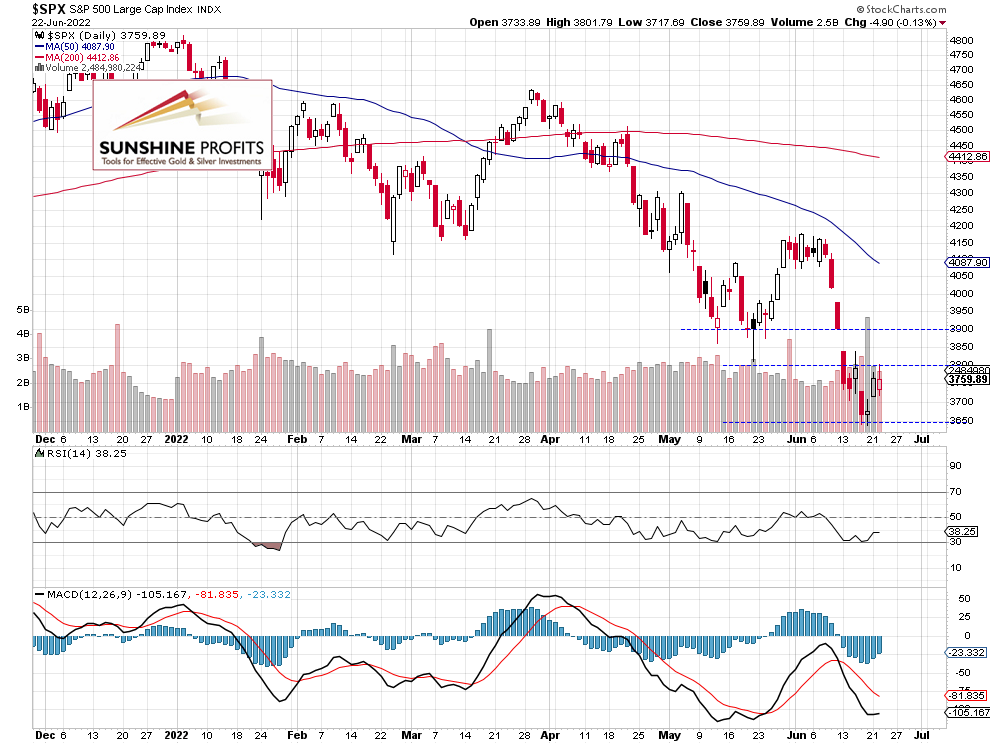
The S&P 500 index lost 0.13% on Wednesday, as it continued to fluctuate below the 3,800 level. Earlier in the week it retraced last week’s Wednesday’s-Friday’s decline to new medium-term low of 3,636.87. On Friday the market was 1,181.75 points or 24.5% below its Jan. 4 record high of 4,818.62. And on Tuesday it bounced up to around 3,780. Yesterday buyers gave up at 3,800 level though.
There’s still a lot of uncertainty and worries about inflation data, tightening Fed’s monetary policy and the Russia-Ukraine conflict. Today we will get another Fed Chair Powell’s Testimony at 10:00 a.m. This morning the S&P 500 index will likely open 0.5% higher, following an overnight retreat from the 3,800 level.
The nearest important resistance level is at around 3,800-3,850, marked by the previous support level. The resistance level is also at 3,900. On the other hand, the support level is at 3,650-3,700. The S&P 500 index trades within an over week-long consolidation, as we can see on the daily chart (chart by courtesy of http://stockcharts.com):
Futures Contract Remains Below the 3,800 Level
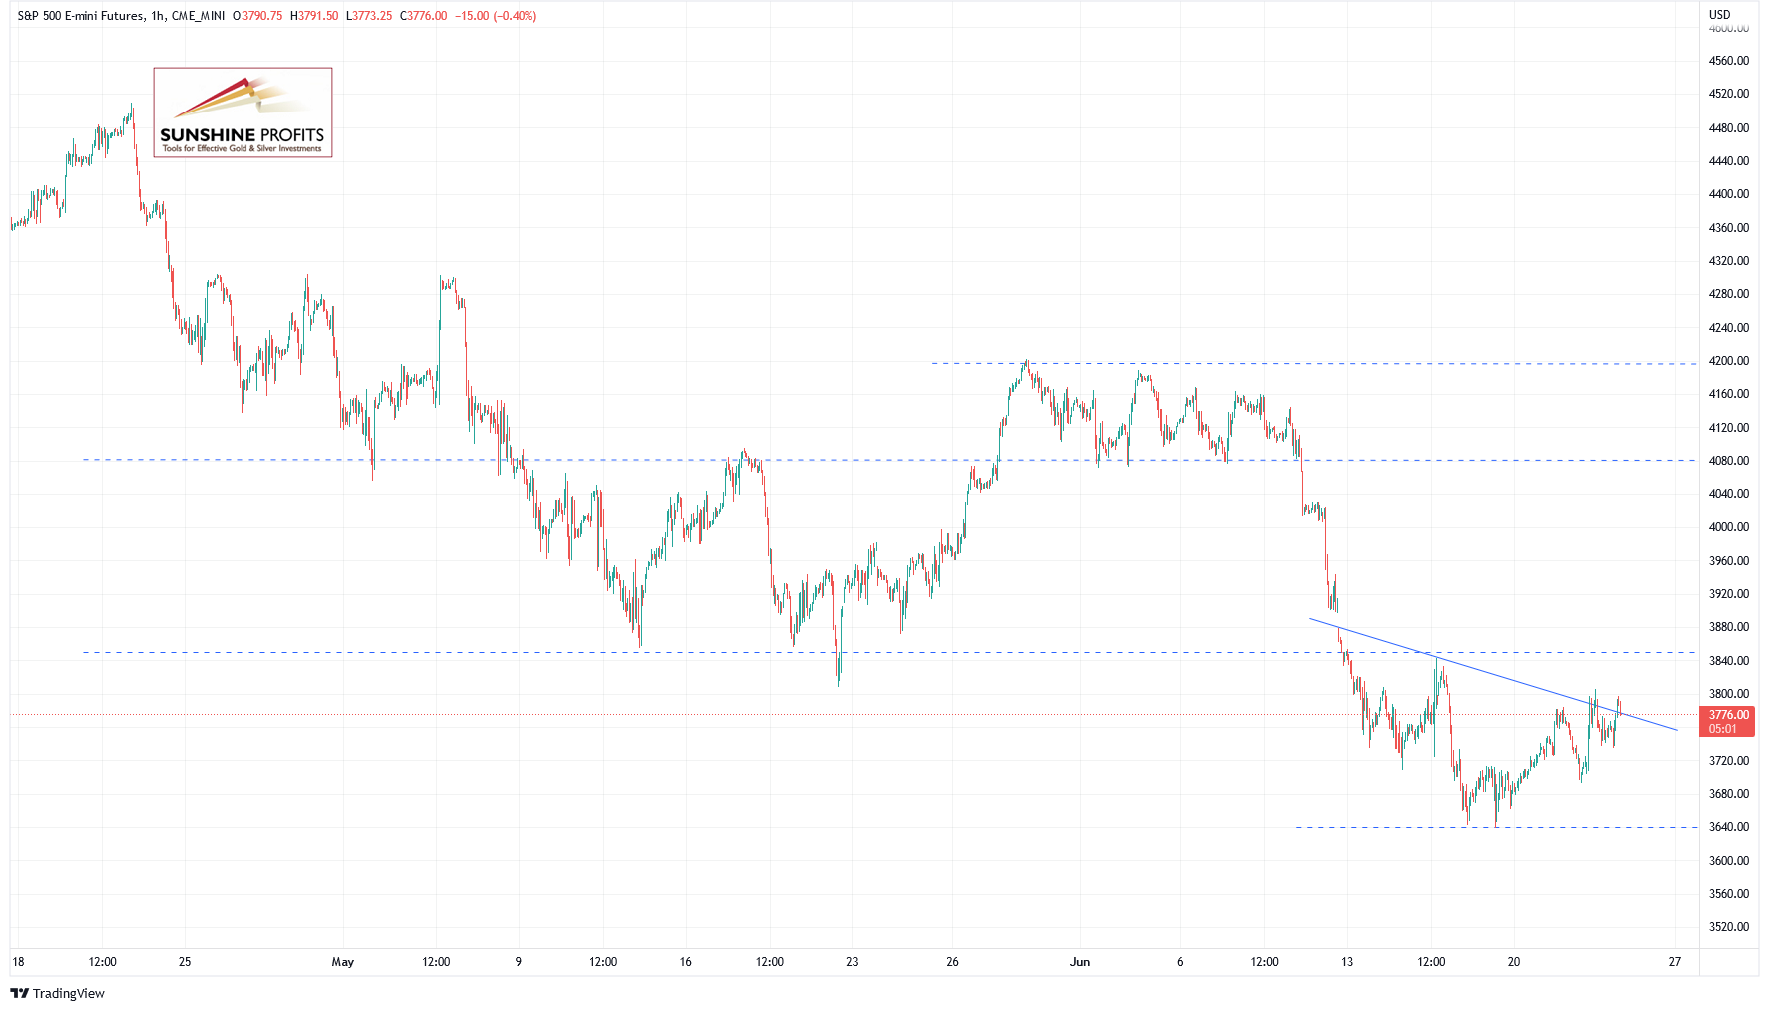
Let’s take a look at the hourly chart of the S&P 500 futures contract. Last week it broke below the previous consolidation. The market reached new medium-term low on Friday, as it tumbled below the 3,700 level. This morning it is fluctuating slightly below the short-term resistance level of 3,800. (chart by courtesy of http://tradingview.com):
Conclusion
The S&P 500 index will likely open 0.5% higher this morning and we may see another attempt at breaking above the 3,800 level. For now, it looks like a consolidation within a downtrend or a bottoming pattern.
Here’s the breakdown:
- The S&P 500 index continues to fluctuate within a consolidation following its mid-June decline
- We may see further attempts at breaking above short-term local highs.
Today's premium Stock Trading Alert includes details of our trading position. Interested in more exclusive updates? Join our premium Stock Trading Alerts newsletter and read all the details today.
Thank you.
Paul Rejczak,
Stock Trading Strategist
Sunshine Profits: Effective Investments through Diligence and Care -
Stocks Will Extend Consolidation – Is This a Bottoming Pattern?
June 22, 2022, 9:04 AMAvailable to premium subscribers only.
-
Stocks to Open Higher, but Fears Remain
June 21, 2022, 9:05 AMAvailable to premium subscribers only.
-
S&P 500 Tumbled to New Low – Is the Bottom In Sight?
June 17, 2022, 8:57 AMAvailable to premium subscribers only.
-
FOMC Release Volatility – Will Stocks’ Downtrend Reverse?
June 16, 2022, 8:11 AMAvailable to premium subscribers only.


Free Gold &
Stock Market Newsletter
with details not available
to 99% investors
+ 7 days of Gold Alerts
Gold Alerts
More-
Status
New 2024 Lows in Miners, New Highs in The USD Index
January 17, 2024, 12:19 PM -
Status
Soaring USD is SO Unsurprising – And SO Full of Implications
January 16, 2024, 8:40 AM -
Status
Rare Opportunity in Rare Earth Minerals?
January 15, 2024, 2:06 PM

