

Briefly: In our opinion, speculative short positions are favored (with stop-loss at 2,510, and profit target at 2,300, S&P 500 index).
Our intraday outlook is bearish, and our short-term outlook is bearish. Our medium-term outlook remains neutral, following S&P 500 index breakout above last year's all-time high:
Intraday outlook (next 24 hours): bearish
Short-term outlook (next 1-2 weeks): bearish
Medium-term outlook (next 1-3 months): neutral
Long-term outlook (next year): neutral
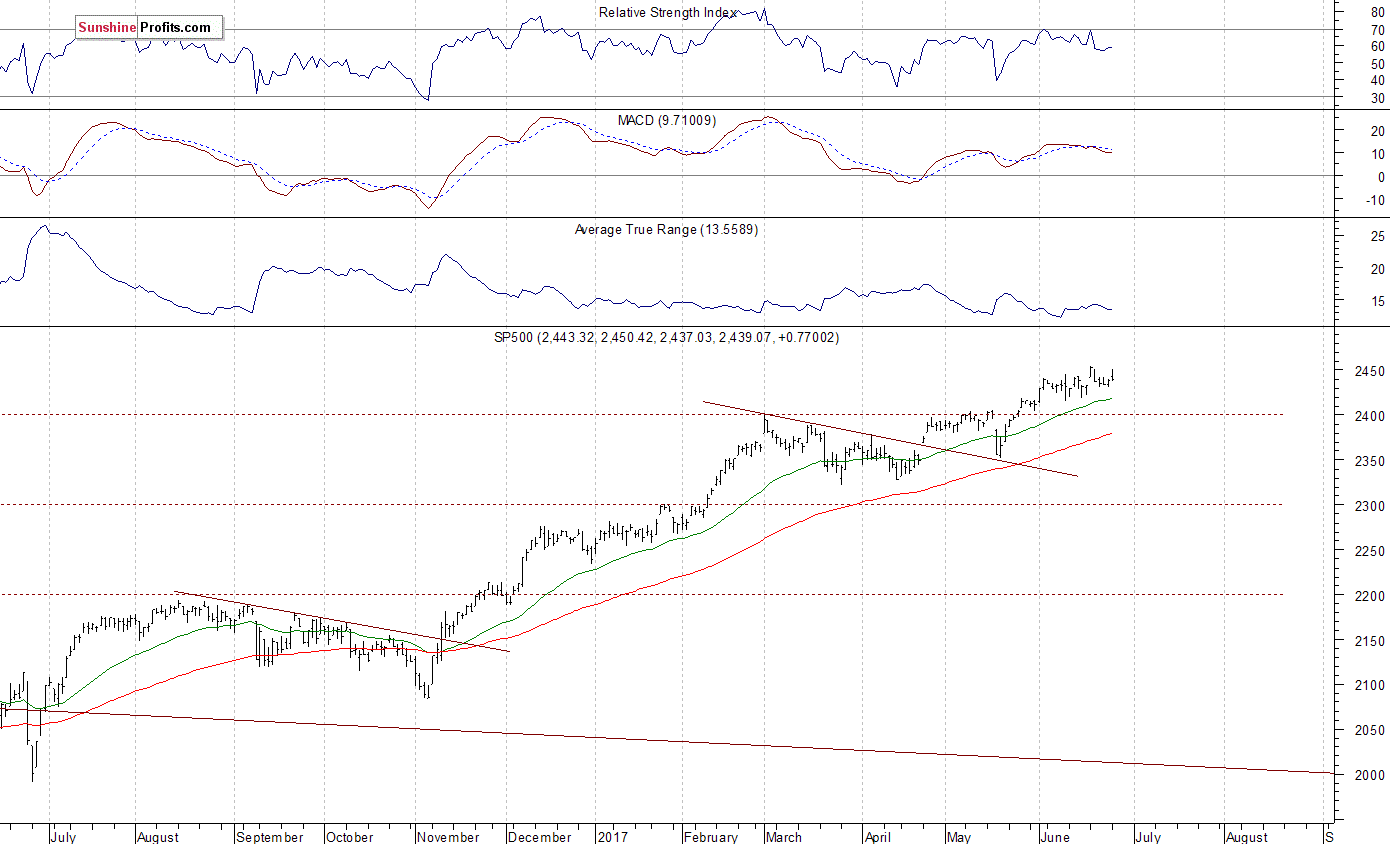
The main U.S. stock market indexes were mixed between -0.3% and +0.1% on Monday, following relatively volatile trading session, as investors reacted to economic data releases, among others. The S&P 500 index remains relatively close to its last Monday's new all-time high of 2,453.82. It has reached new record high after a breakout above short-term consolidation along the level of 2,420-2,440. Stocks have rebounded strongly following their mid-May quick two-session sell-off and continued over eight-year-long bull market off 2009 lows. The Dow Jones Industrial Average remains close to its last Tuesday's new all-time high at the level of 21,535.03. The technology Nasdaq Composite was relatively weaker than the broad stock market yesterday, as it reversed its yesterday's intraday uptrend. The nearest important support level of the S&P 500 index is at around 2,430-2,435, marked by last week's Monday's daily gap up of 2,433.15-2,441.79. The next level of support is at 2,415-2,420, marked by some recent local lows. The support level is also at 2,400-2,410, marked by the May 25 daily gap up of 2,405.58-2,408.01, among others. On the other hand, level of resistance is at 2,450-2,455, marked by new all-time high. There have been no confirmed negative signals so far. However, we can see overbought conditions and negative technical divergences. The S&P 500 index is trading within its three-week-long consolidation, as we can see on the daily chart:
Mixed Expectations
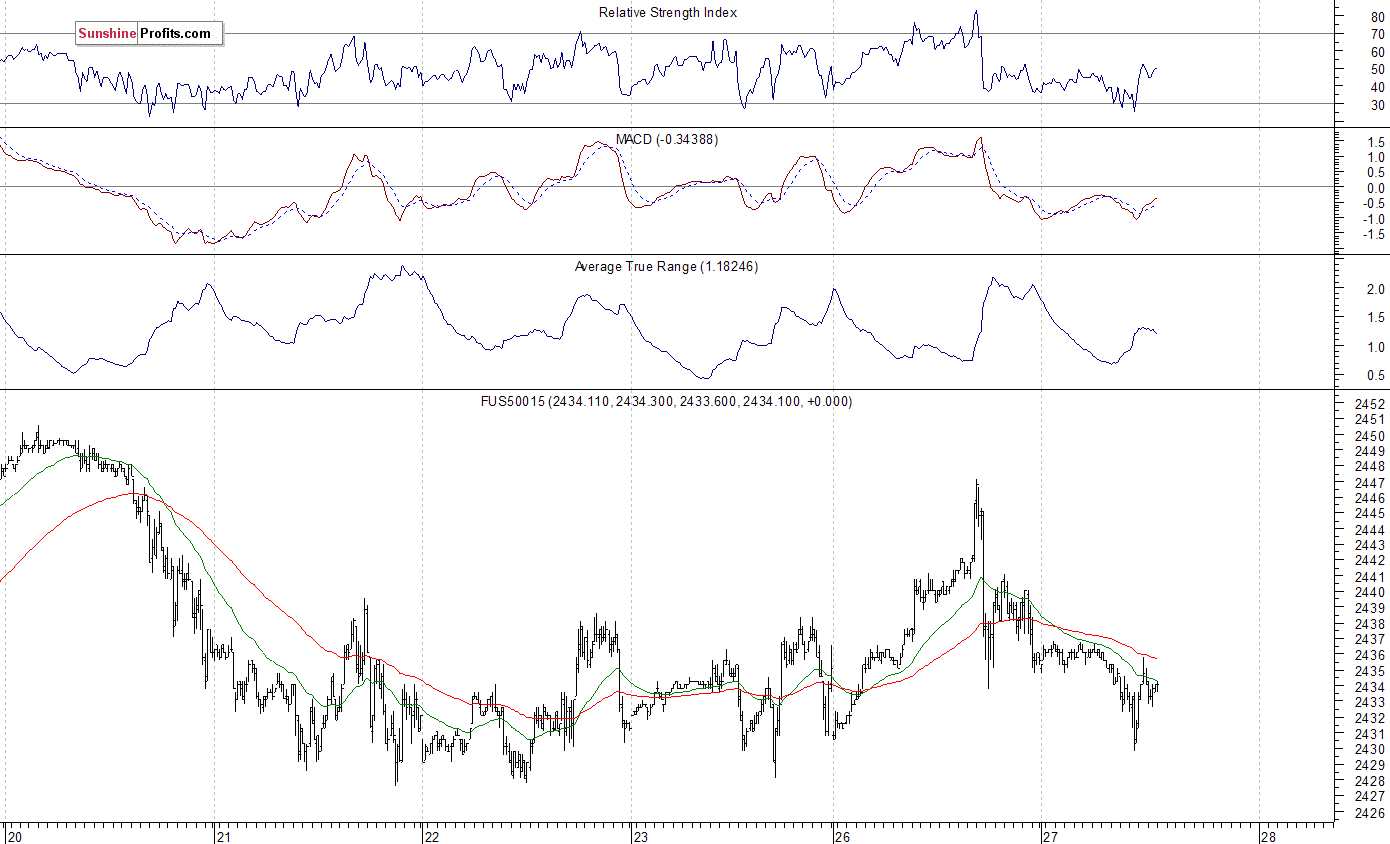
Expectations before the opening of today's trading session are mixed, with index futures currently between -0.4% and 0.0% vs. yesterday's closing prices. The European stock market indexes have lost 0.1-0.5% so far. Investors will now wait for the Consumer Confidence number release at 10:00 a.m. The market expects that it was at 116.7 in June. The S&P 500 futures contract trades within an intraday consolidation, following an overnight downtrend. The market retraced its yesterday's move up and got back to its short-term consolidation again. The nearest important level of support is at 2,425-2,430, marked by last week's Monday's gap-up opening, among others. The next support level is at around 2,415-2,420, marked by recent local lows. The nearest important level of resistance is at around 2,445-2,450, marked by record high, among others. The market extends its short-term consolidation, as it continues to trade along all-time high. Is this a topping pattern before downward reversal or just flat correction within an uptrend? There have been no confirmed negative signals so far.
Techs Weaker Again
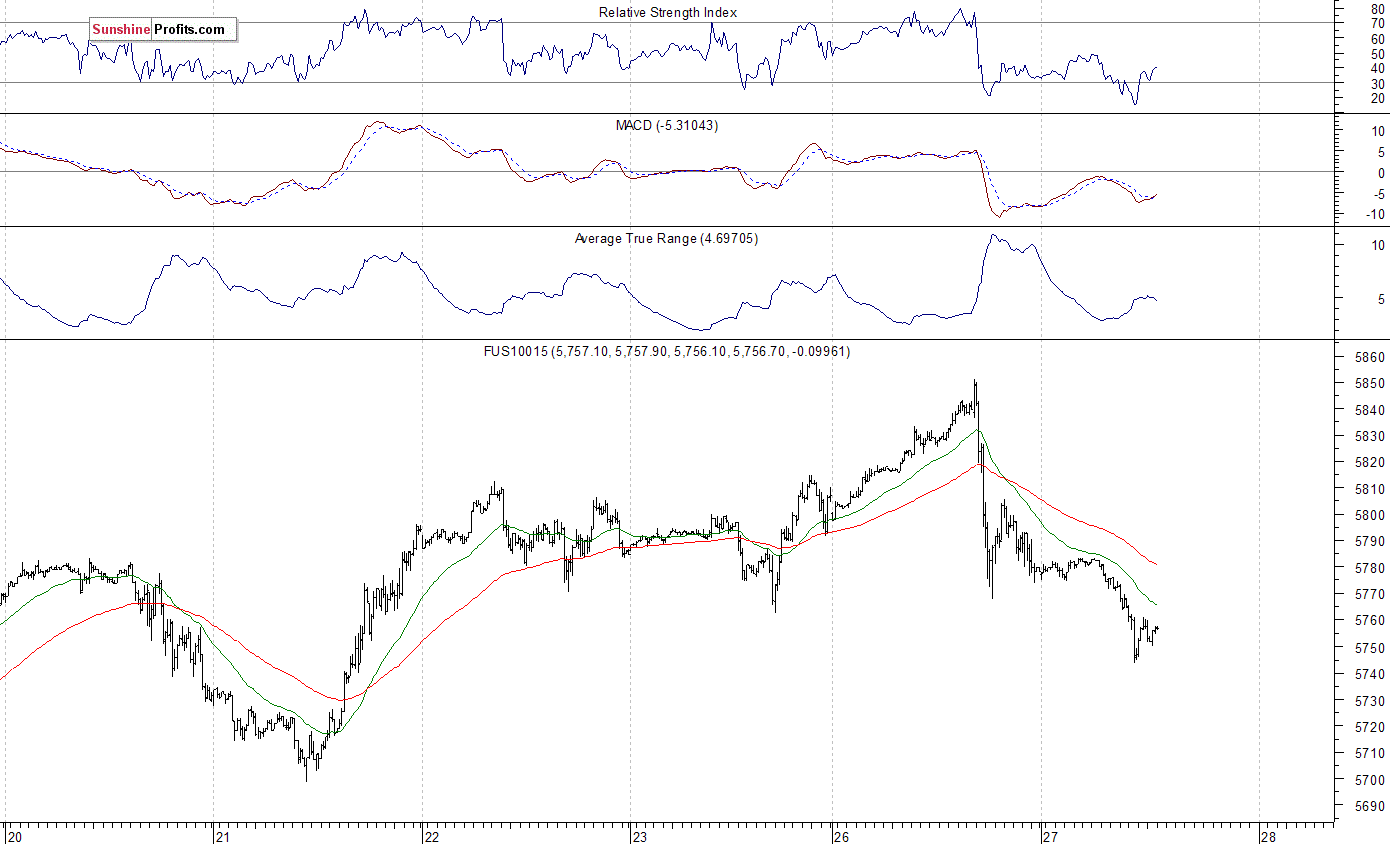
The technology Nasdaq 100 futures contract follows a similar path, as it retraces its recent move up. The nearest important level of resistance is at 5,800-5,850, marked by some previous local lows and local highs. The next resistance level is at around 5,900, marked by record high. On the other hand, support level is at around 5,700-5,720, marked by recent local lows, as the 15-minute chart shows:
Concluding, the S&P 500 index got closer to its record high yesterday, before closing just 0.03% higher. Will the broad stock market continue its uptrend? Or is this some topping pattern before a downward correction? There have been no confirmed negative signals so far. However, we still can see negative technical divergences, along with medium-term overbought conditions.
Therefore, we continue to maintain our speculative short position (opened at 2,437.83 on June 5 - opening price of the S&P 500 index). Stop-loss level is at 2,510 and potential profit target is at 2,300 (S&P 500 index). You can trade S&P 500 index using futures contracts (S&P 500 futures contract - SP, E-mini S&P 500 futures contract - ES) or an ETF like the SPDR S&P 500 ETF - SPY. It is always important to set some exit price level in case some events cause the price to move in the unlikely direction. Having safety measures in place helps limit potential losses while letting the gains grow.
To summarize: short position in S&P 500 index is justified from the risk/reward perspective with the following entry prices, stop-loss orders and profit target price levels:
S&P 500 index - short position: profit target level: 2,300; stop-loss level: 2,510
S&P 500 futures contract (September) - short position: profit target level: 2,297; stop-loss level: 2,507
SPY ETF (SPDR S&P 500, not leveraged) - short position: profit target level: $230; stop-loss level: $251
SDS ETF (ProShares UltraShort S&P500, leveraged: -2x) - long position: opening price: $12.56; profit target level: $13.98; stop-loss level: $11.82
Thank you.
Paul Rejczak
Stock Trading Strategist
Stock Trading Alerts

