
Briefly: In our opinion, no speculative positions are justified.
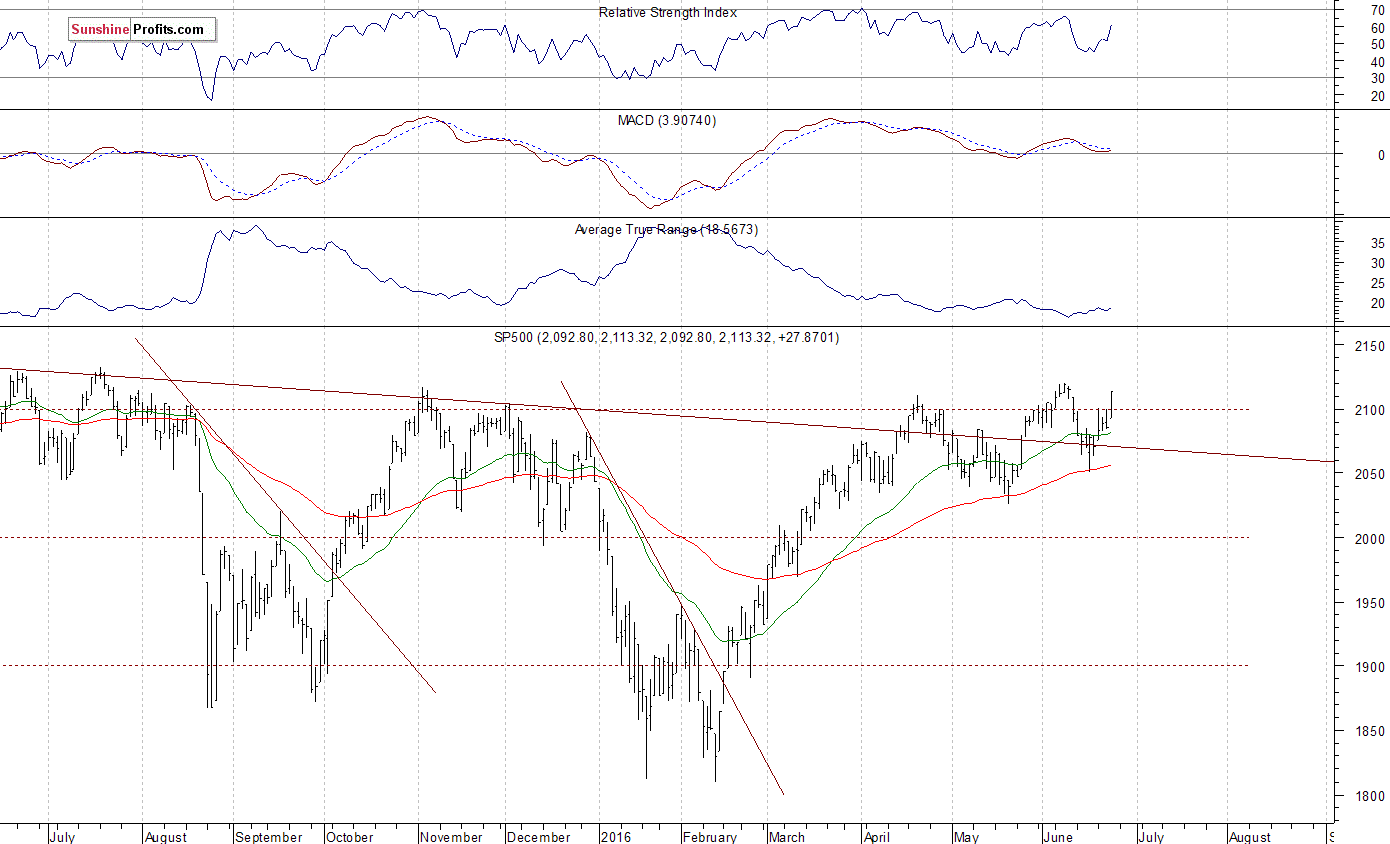
Our intraday outlook is now neutral, and our short-term outlook is neutral. Our medium-term outlook remains bearish, as the S&P 500 index extends its lower highs, lower lows sequence:
Intraday outlook (next 24 hours): neutral
Short-term outlook (next 1-2 weeks): neutral
Medium-term outlook (next 1-3 months): bearish
Long-term outlook (next year): neutral
The main U.S. stock market indexes gained 1.3-1.4% on Thursday, extending their recent rebound, as investors awaited British European Referendum Polls release. The S&P 500 index broke above resistance level of 2,100, as it got close to resistance level of 2,120. On the other hand, support level remains at around 2,080-2,085, marked by recent consolidation. The next support level is at around 2,050-2,060. Last year's highs along the level of 2,100 continue to act as medium-term resistance level. Will the market break above these medium-term highs and continue its seven-year long bull market? Or will it reverse its over three-month long uptrend off medium-term support level at around 1,800?
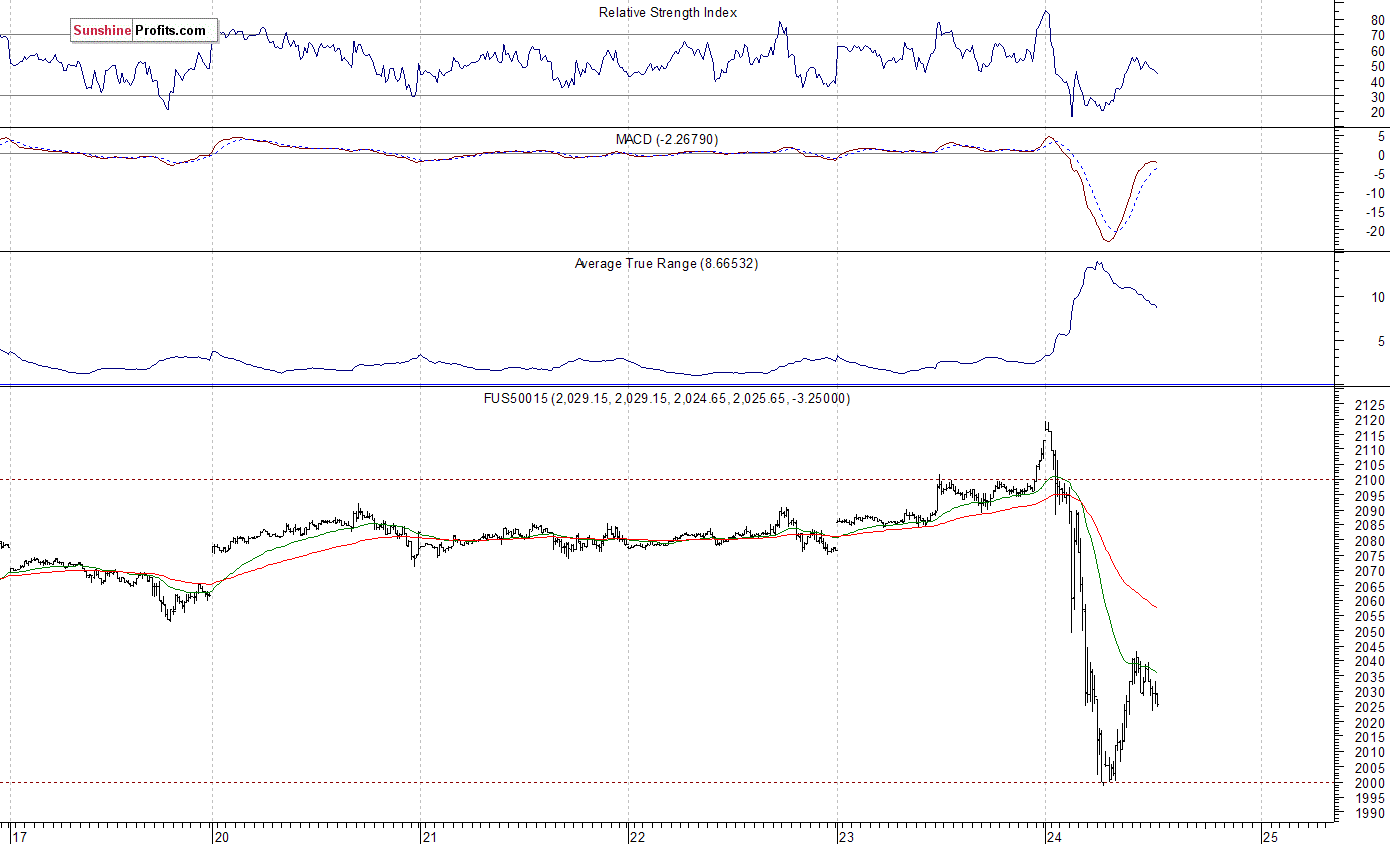
Expectations before the opening of today's trading session are very negative, with index futures currently down 3.0-3.8%, as investors react to "Brexit" announcement. The European stock market indexes have lost 4.8-8.6% so far. However, stock markets bounced off following early morning panic selling. Investors will now wait for some economic data announcements: Durable Orders at 8:30 a.m., Michigan Sentiment number at 10:00 a.m. The S&P 500 futures contract trades within an intraday downtrend, following yesterday's move up. It bounced off support level at around 2,000. The nearest important level of resistance is at 2,050, and the next resistance level is at 2,070, marked by recent consolidation. There have been no confirmed short-term positive signals so far:
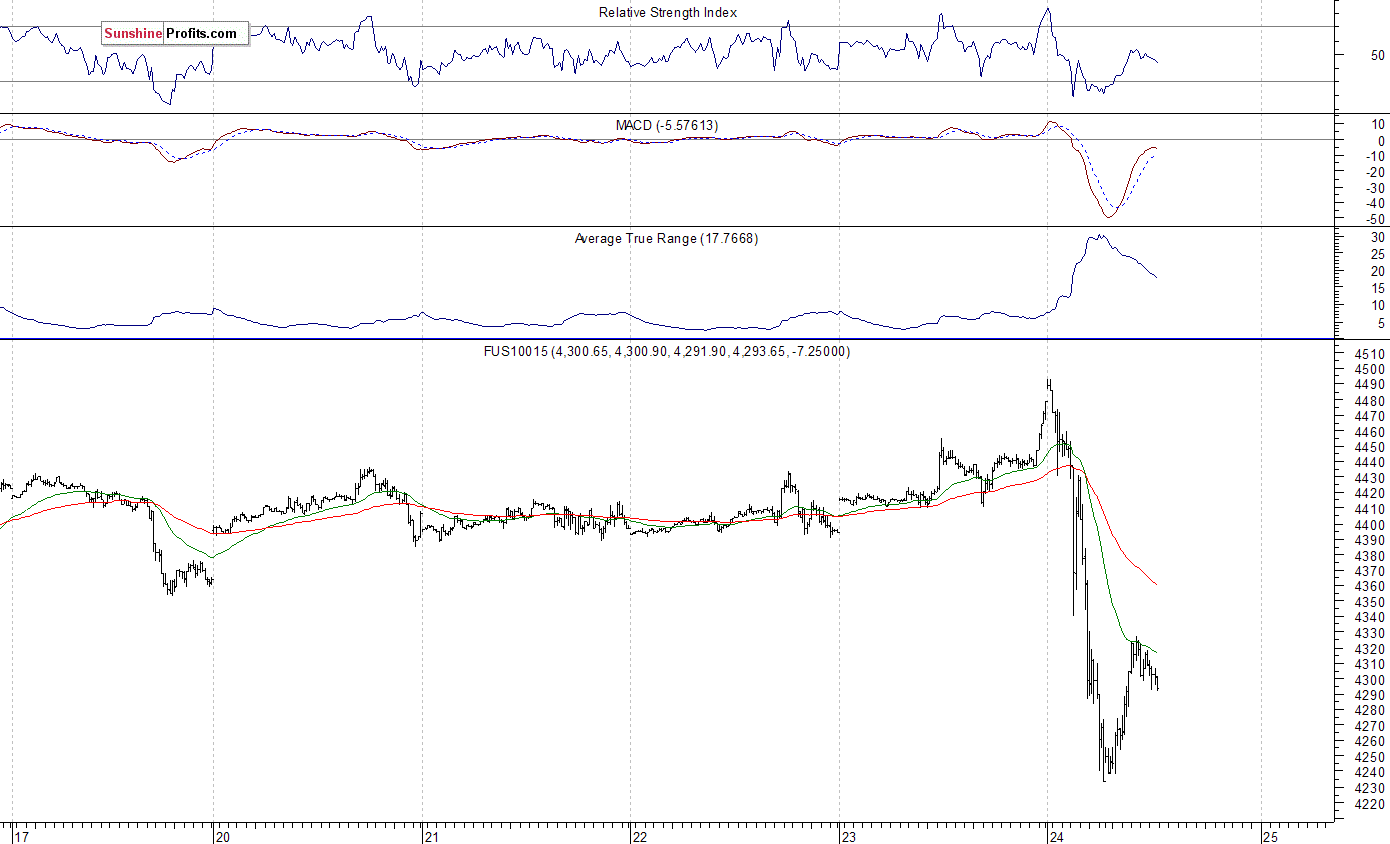
The technology Nasdaq 100 futures contract follows a similar path, as it currently trades along the level of 4,300, following bouncing off support level at around 4,230-4,250. On the other hand, resistance level is at 4,350-4,400, marked by previous support level, as we can see on the 15-minute chart:
Concluding, the broad stock market extended its short-term uptrend yesterday, but investors' sentiment worsened considerably during after-hours trading session, following "Brexit" announcement. We decided to close our speculative short position (opened on June 1 at 2,093.94 - S&P 500 index) at the opening of today's trading session (cash market - S&P 500 index). Our stop-loss level is at 2,120, and profit target iss at 2,000 (S&P 500 index). It is always important to set some exit price level in case some events cause the price to move in the unlikely direction. Having safety measures in place helps limit potential losses while letting the gains grow. Currently, we prefer to be out of the market, avoiding low risk/reward ratio trades. We will let you know when we think it is safe to get back in the market.
Thank you.
Paul Rejczak
Stock Trading Strategist
Stock Trading Alerts

