
Briefly: In our opinion, no speculative positions are justified.
Our intraday outlook remains neutral, and our short-term outlook is neutral:
Intraday
(next 24 hours) outlook: neutral
Short-term (next 1-2 weeks) outlook: neutral
Medium-term (next 1-3 months) outlook: neutral
Long-term outlook (next year): bullish
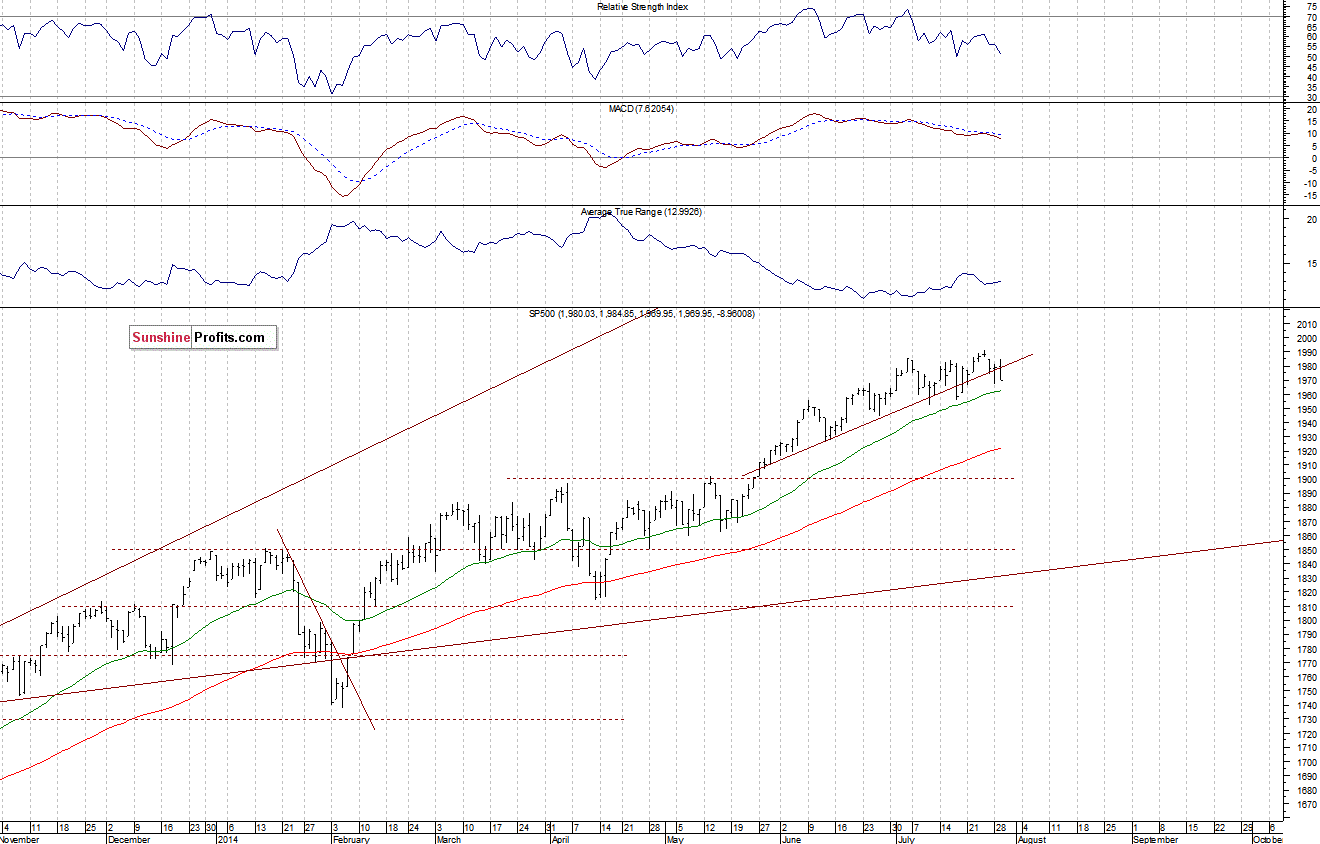
The U.S. stock market indexes lost between 0.2% and 0.5% on Tuesday, extending their short-term consolidation, as investors continued to hesitate ahead of economic data announcements, quarterly earnings releases, geopolitical developments. The S&P 500 index broke below its upward trend line, which is negative. However, there is still no clear short-term direction, as the index fluctuates relatively close to its all-time high of 1,991.39. The resistance level is at around 1,990-2,000. On the other hand, the level of support remains at 1,950-1,970. For now, it looks like a flat correction within a long-term uptrend, however, a downward correction cannot be excluded here:
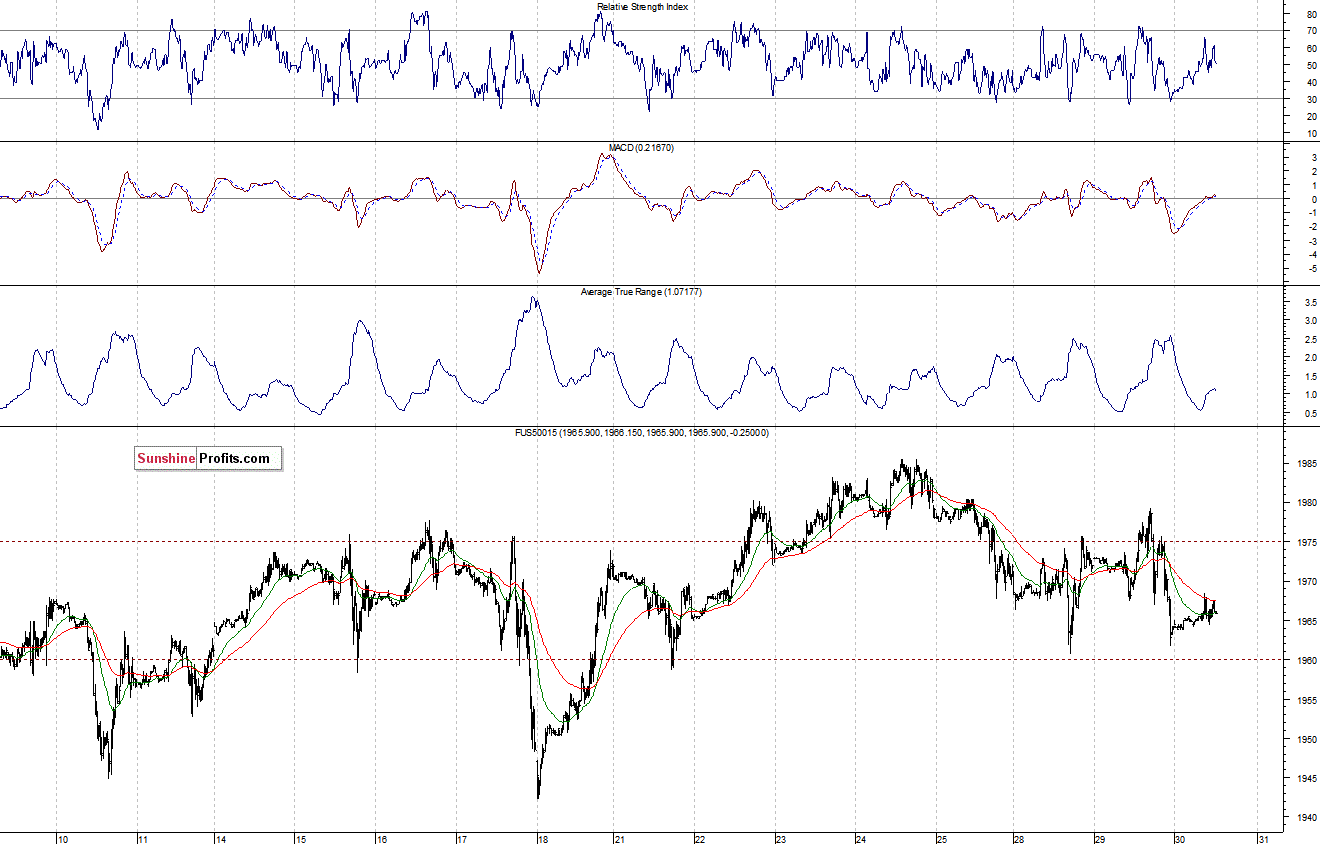
Expectations before the opening of today’s session are positive, with index futures currently up 0.2-0.3%. The main European stock market indexes have been virtually flat so far. Investors will now wait for some key economic data announcements: ADP Employment Change report at 8:15 a.m., U.S. GDP at 8:30 a.m., FOMC Rate Decision at 2:00 p.m. Investors will particularly focus on the GDP data release, following GDP’s first quarter decline of 2.9%. The ADP report release will be watched closely too, before Friday’s monthly jobs report announcement. The S&P 500 futures contract (CFD) trades close to the support level of 1,960, marked by recent local lows. On the other hand, the level of resistance remains at around 1,980-1,985, as we can see on the 15-minute chart:
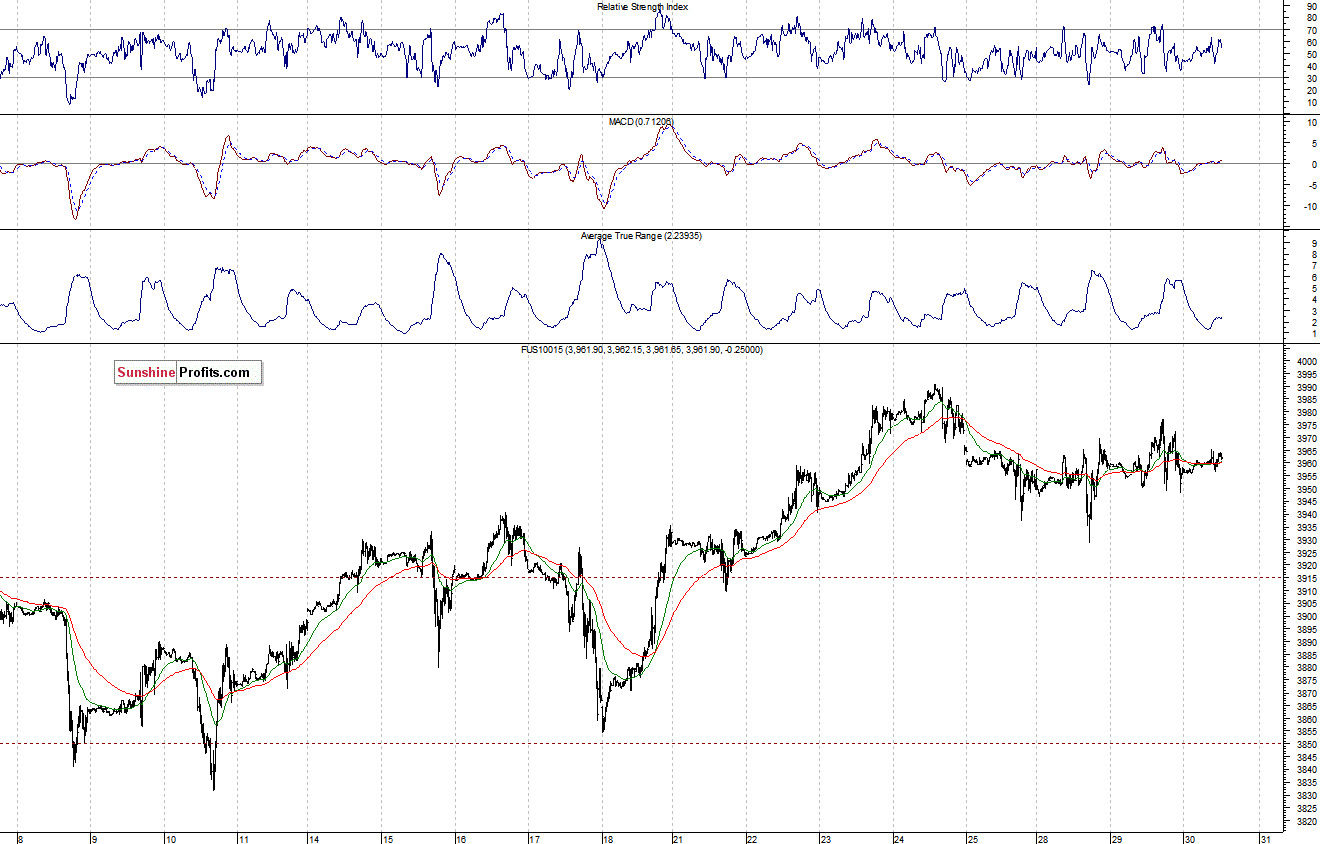
The technology Nasdaq 100 futures contract (CFD) extends its short-term consolidation, as it trades slightly below long-term highs. The resistance level is at around 3,980-4,000, and the nearest important level of support is at 3,930, marked by Monday’s local low. There have been no confirmed negative signals so far, as the 15-minute chart shows:
Concluding, the broad stock market remains in a short-term consolidation, still quite close to its all-time high. Investors wait for some key economic data announcements, which may lead to a new short-term trend. There have been no confirmed negative signals so far. We think that it is better to stay out of the market at this moment, avoiding low risk/reward ratio trades, and we will let you know when we think it is safe to get back in the market.
Thank you.
Paul Rejczak
Stock Trading Strategist
Stock Trading Alerts

