
Briefly: In our opinion, no speculative positions are justified.
Our intraday outlook remains neutral, and our short-term outlook is neutral:
Intraday
(next 24 hours) outlook: neutral
Short-term (next 1-2 weeks) outlook: neutral
Medium-term (next 1-3 months) outlook: neutral
Long-term outlook (next year): bullish
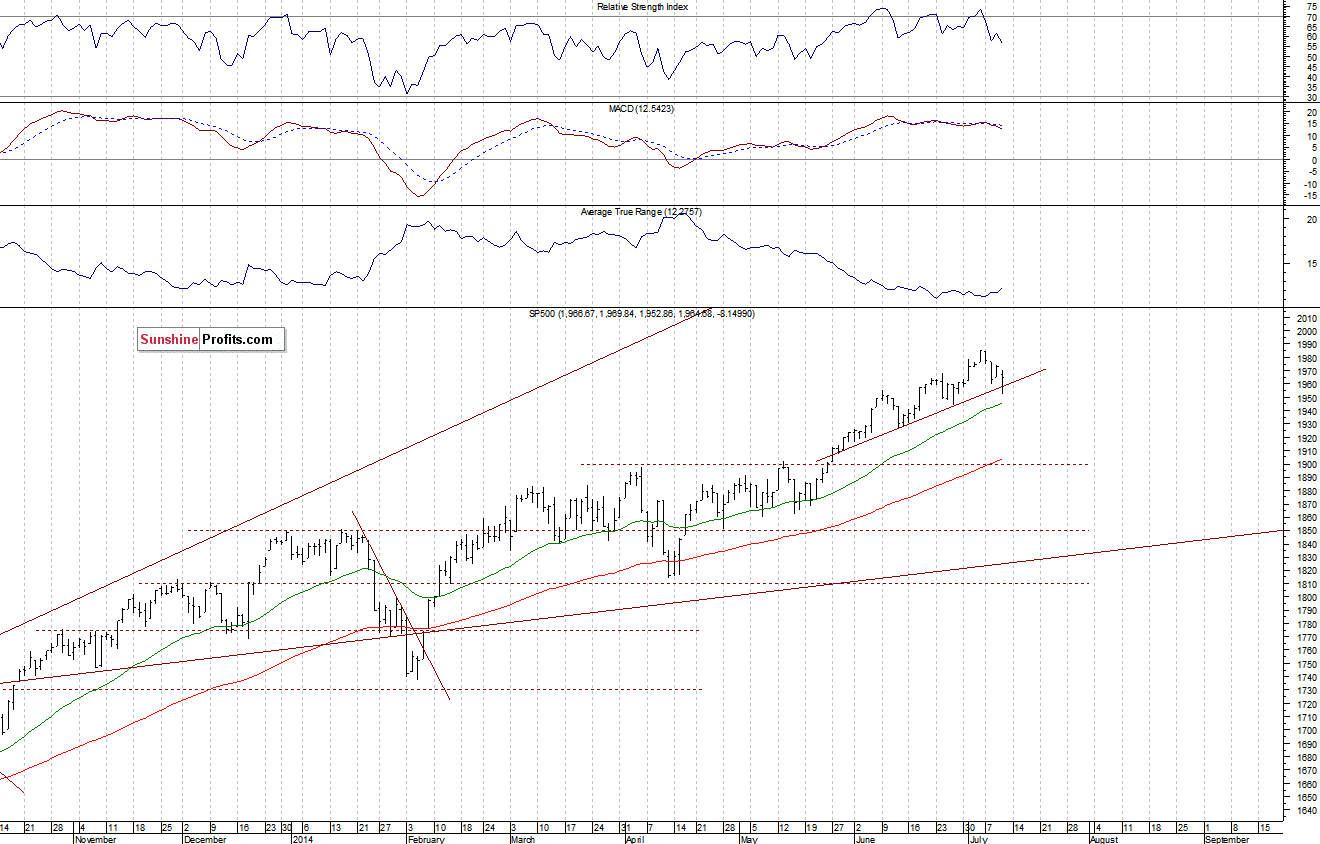
The U.S. stock market indexes lost 0.3-0.4% on Thursday, extending their recent fluctuations, as investors continued to hesitate ahead of economic data announcements, quarterly earnings releases. Earnings season can be a time of increased volatility as investors react to news from the companies. So, it may be better to cut back on your trading or even move to the sidelines completely, especially following recent run-up. The S&P 500 index managed to stay above its month-long upward trend line, which is positive. There have been no confirmed negative signals so far, however, a downward correction still cannot be ruled out. The resistance level is at around 1,980-1,985, marked by July 3 all-time high of 1,985.59. On the other hand, the level of support is at 1,950-1,960, marked by recent local lows, among others:
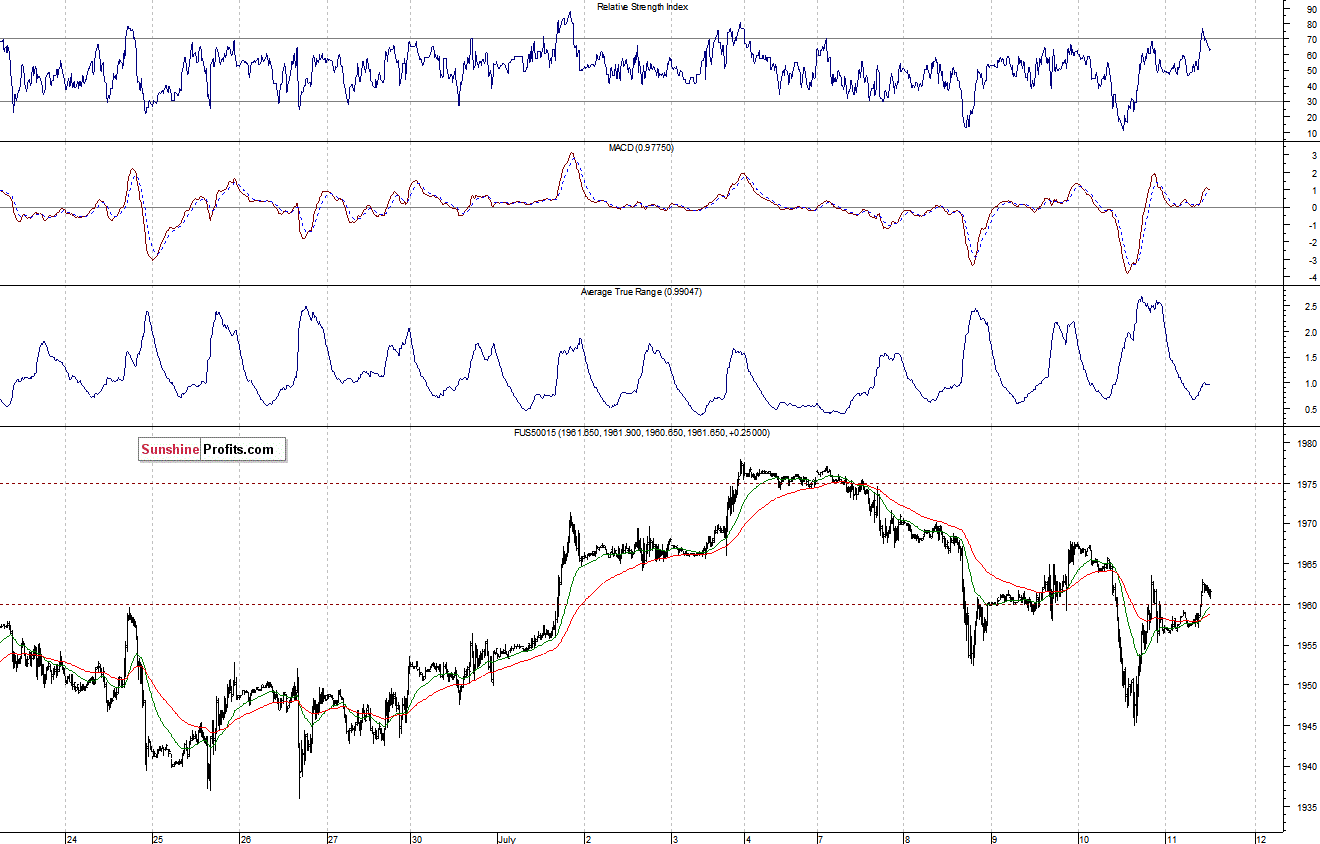
Expectations before the opening of today’s session are slightly positive, with index futures currently up 0.2%. The main European stock market indexes have gained between 0.1% and +0.4% so far. Investors will now wait for some quarterly corporate earnings releases. The S&P 500 futures contract (CFD) trades in a relatively narrow intraday range, along the level of 1,960. The resistance level is at around 1,965-1,970, and the nearest important level of support is at 1,945-1,950, as we can see on the 15-minute chart:
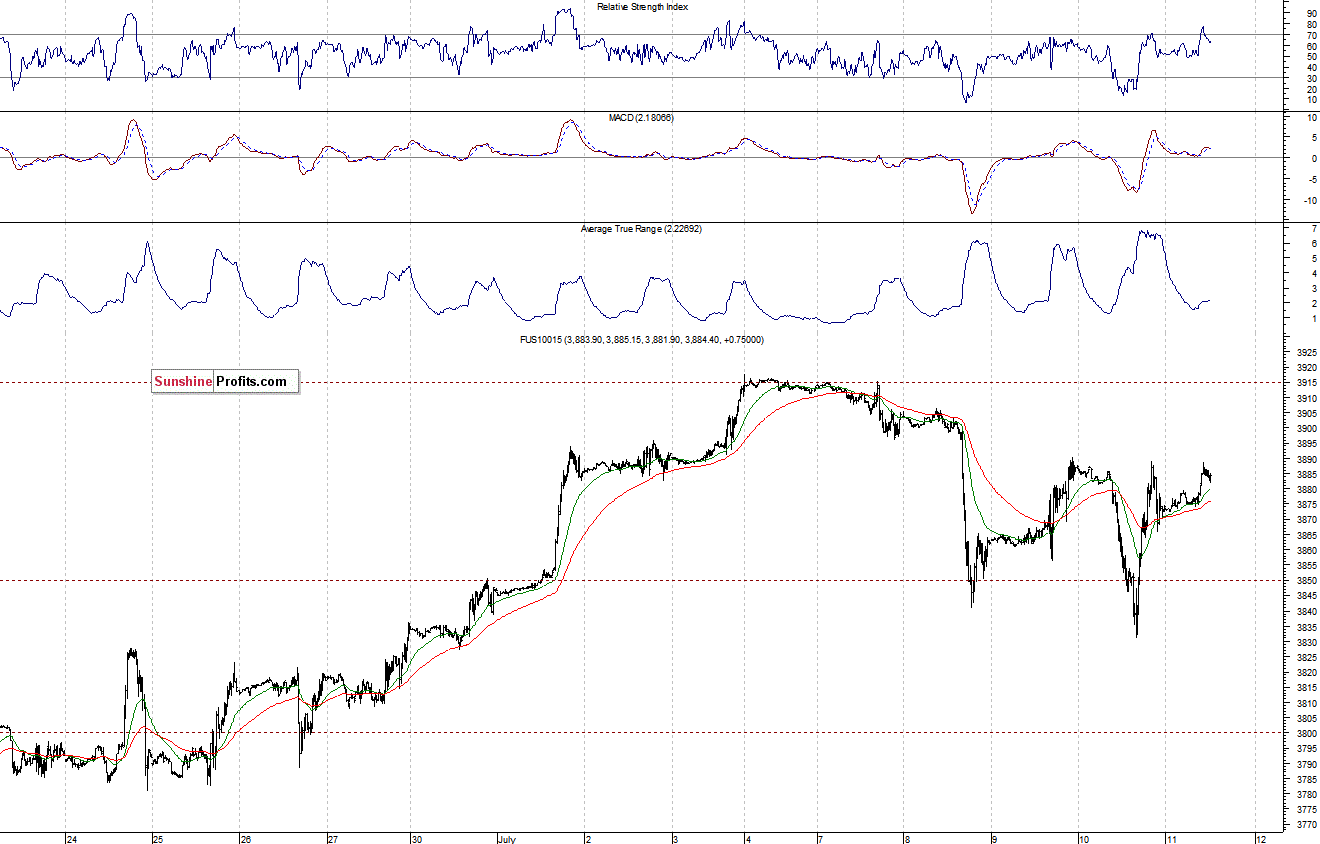
The technology Nasdaq 100 futures contract (CFD) follows a similar path, as it trades below the resistance of 3,900-3,915, marked by recent highs. The level of support is at 3,830-3,850, marked by recent local lows. For now, it looks like another consolidation within uptrend, as the 15-minute chart shows:
Concluding, the broad stock market extends its short-term consolidation, as the S&P 500 index remains close to all-time high. There have been no confirmed negative signals, however, we still see some technical overbought which may lead to a downward correction. Therefore, we think that it is better to stay out of the market at this moment, just to avoid low risk/reward ratio trades.
Thank you.
Paul Rejczak
Stock Trading Strategist
Stock Trading Alerts

