
Briefly: In our opinion speculative long positions are still favored (with stop-loss at 1,885, S&P 500 index).
Our intraday outlook is now neutral, and our short-term outlook is bullish, following a breakout above consolidation:
Intraday
(next 24 hours) outlook: neutral
Short-term (next 1-2 weeks) outlook: bullish
Medium-term (next 1-3 months) outlook: neutral
Long-term outlook (next year): bullish
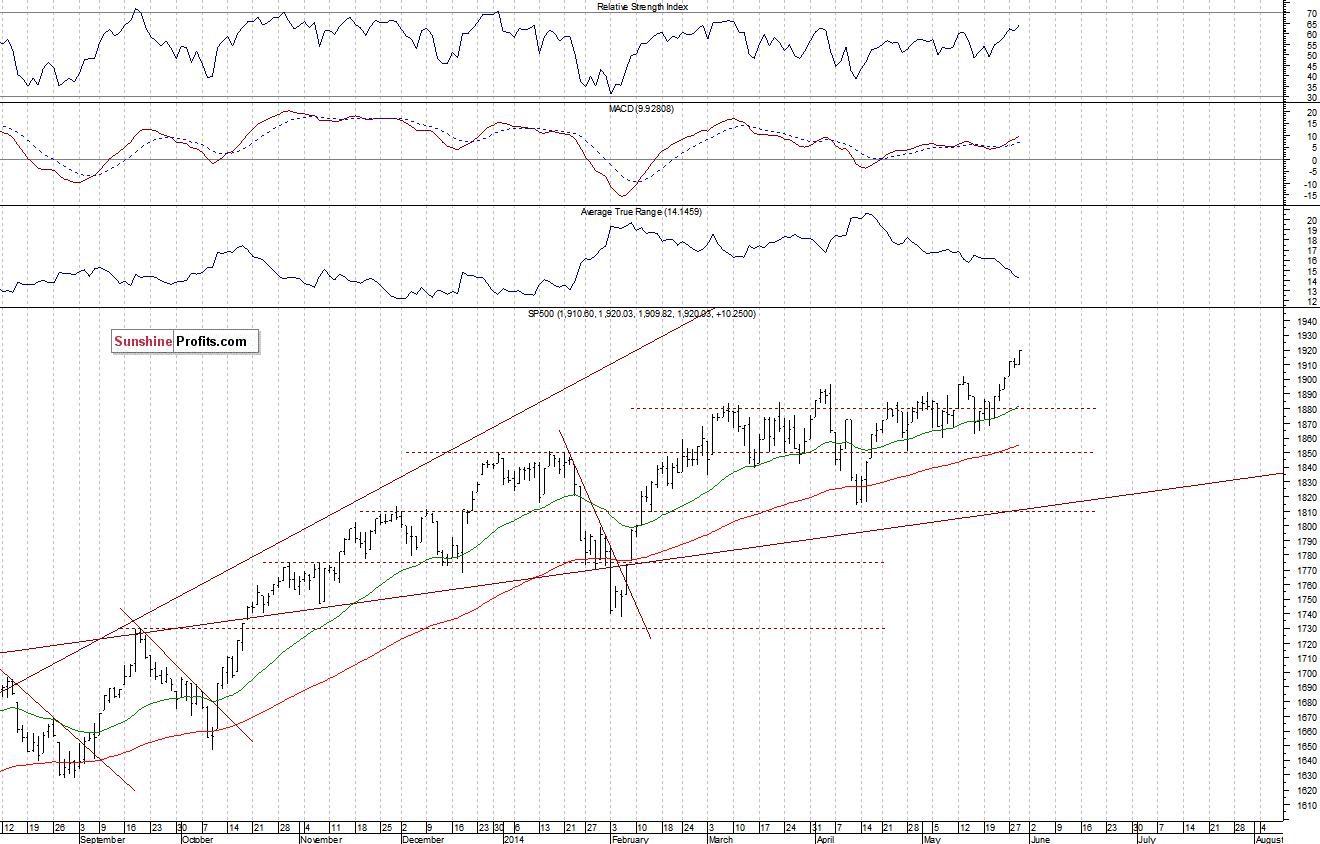
The main U.S. stock market indexes gained 0.4-0.6% on Thursday, extending their uptrend, as investors didn’t react to worse-than-expected GDP data release. The S&P 500 index has reached the new record high of 1,920.03. The level of support remains at 1,880-1,900, marked by previous resistance. Potential level of resistance is at around 1,920.There have been no confirmed negative signals so far, however, we can see some short-term overbought here:
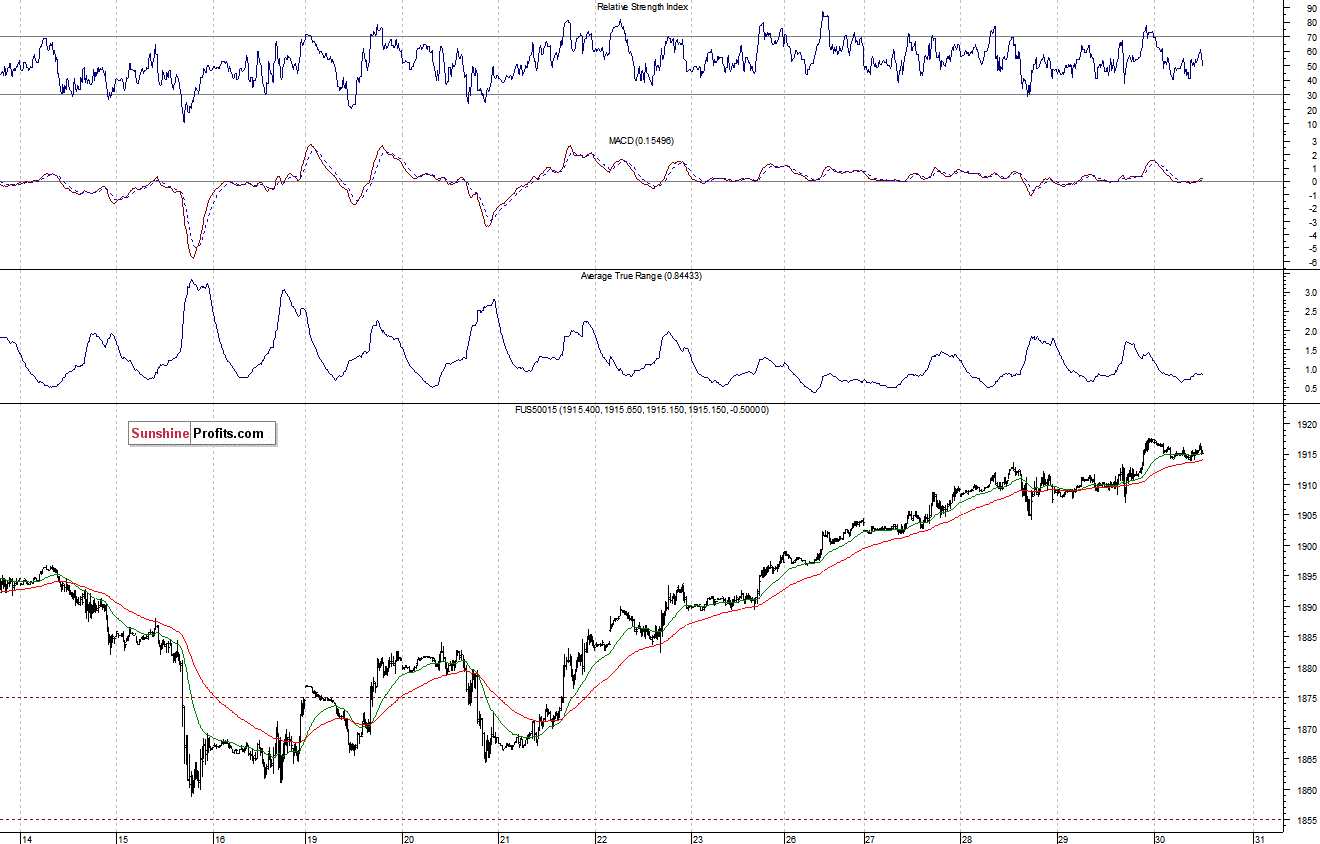
Expectations before the opening of today’s session are virtually flat, with index futures currently mixed between -0.1% and 0.0%. The European stock market indexes have been mixed between -0.3% and +0.1% so far. Investors will now wait for some further economic data announcements: Personal Income, Personal Spending, PCE Prices-Core number at 8:30 a.m., Chicago PMI at 9:45 a.m., Michigan Sentiment at 9:55. The S&P 500 futures contract (CFD) is in a relatively narrow intraday trading range, following yesterday’s move up. The nearest important level of support is at around 1,900-1,905, marked by the recent local lows, among others. On the other hand, the resistance is at around 1,915-1,920, as we can see on the 15-minute chart:
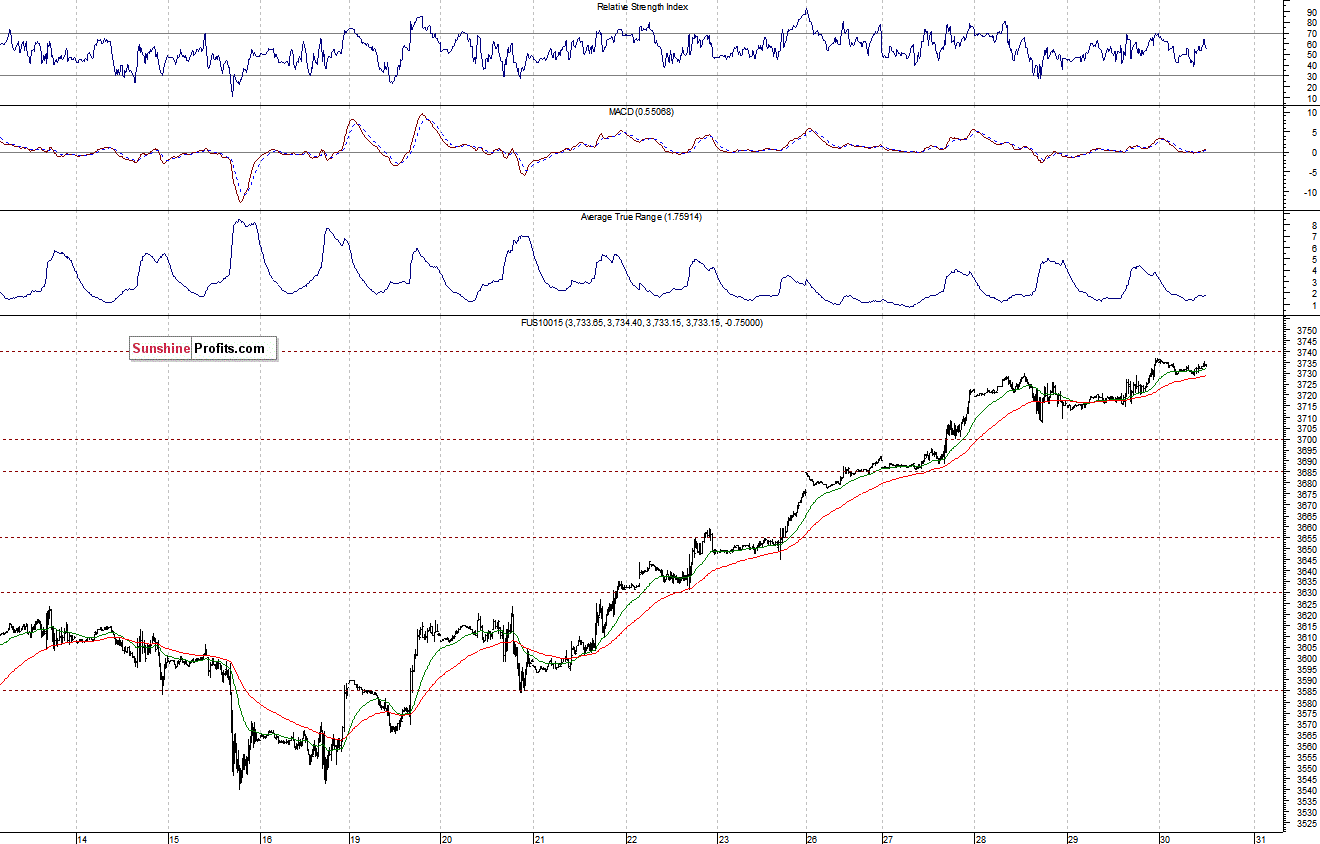
The technology Nasdaq 100 futures contract (CFD) follows a similar path, as it trades close to yesterday’s high. The resistance is at around 3,740, and the nearest important level of support is at 3,700-3,710, as the 15-minute chart shows:
Concluding, the broad stock market remains in an uptrend, however, some short-term retracement cannot be excluded here. We continue to maintain our already profitable long position, with stop-loss at 1,885 (S&P 500 index).
Thank you.
Paul Rejczak
Stock Trading Strategist
Stock Trading Alerts

