

Briefly:
Intraday trade: The S&P 500 index lost 1.9% on Friday, after opening 0.8% lower. The market will probably open slightly lower today. We may see some fluctuations along the medium-term support level.
Trading position (short-term; our opinion): no positions are justified from the risk/reward perspective.
Our short-term outlook is neutral, and our medium-term outlook is neutral:
Short-term outlook (next 1-2 weeks): neutral
Medium-term outlook (next 1-3 months): neutral
The U.S. stock market indexes lost 1.9-2.3% on Friday, retracing their recent advance, as investors' sentiment worsened again. The S&P 500 index is currently 11.6% below September the 21st record high of 2,940.91. The Dow Jones Industrial Average lost 2.0% and the Nasdaq Composite lost 2.3% on Friday.
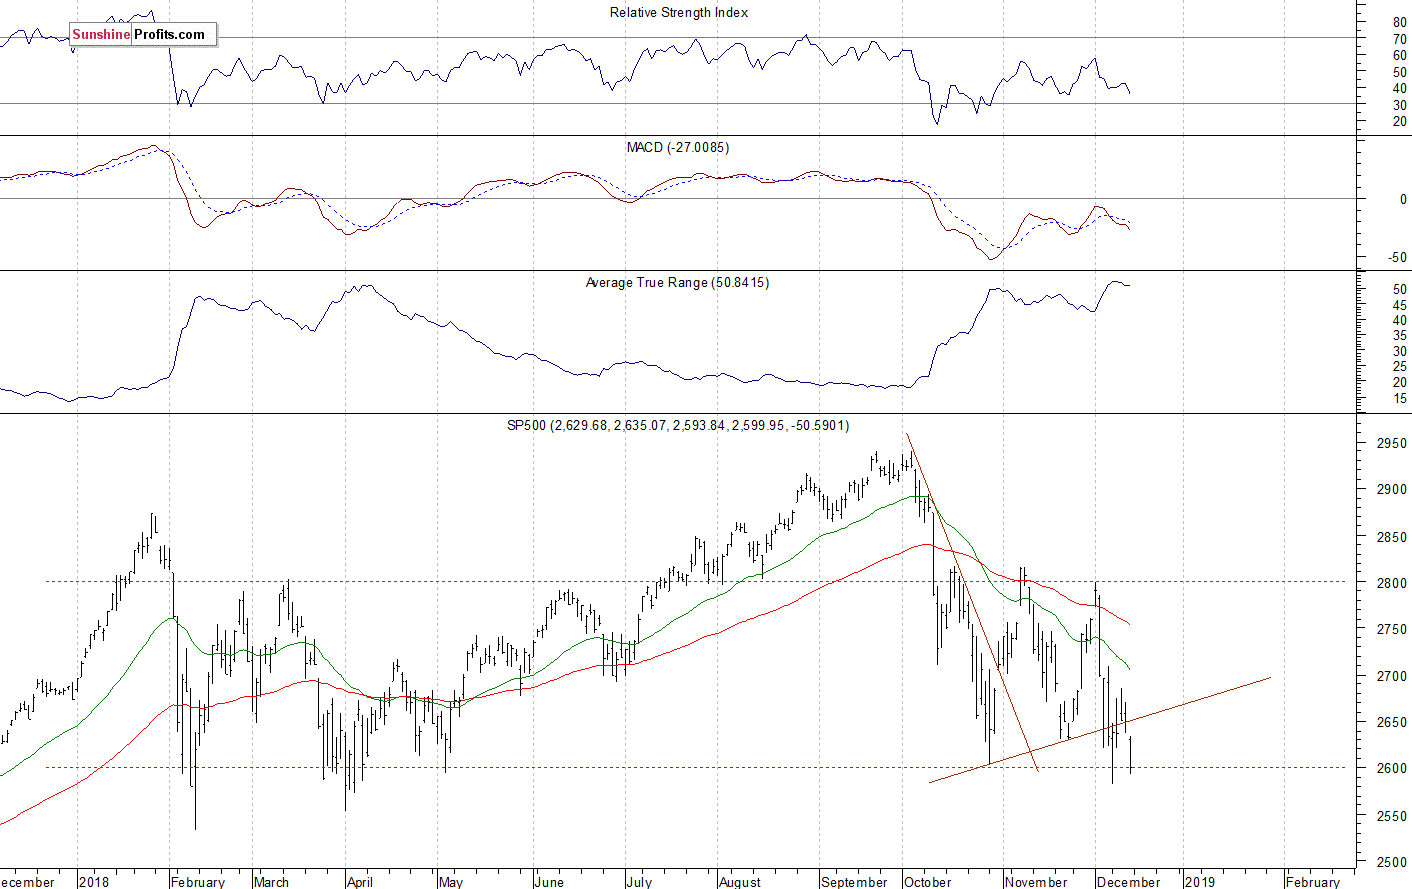
The nearest important level of resistance of the S&P 500 index is now at 2,635-2,640, marked by Friday's daily gap down of 2,635.07-2,637.27. The next resistance level is at 2,675-2,685, marked by some recent fluctuations. The resistance level is also at 2,695-2,700, marked by the previous daily gap down of 2,696.15-2,697.18. On the other hand, the support level is at 2,580-2,600, marked by the medium-term local lows. The next support level is at 2,530-2,550.
The broad stock market reversed its recent upward course following the S&P 500 index' reversal off the resistance level at 2,800. Then the market broke below 2,700 mark, as it retraced more of the rally. On Monday a week ago it fell the lowest since the early April, before bouncing off and getting above 2,600 mark at the end of the day. The index continues to trade along its previous medium-term lows, as we can see on the daily chart:
Mixed Expectations
The index futures contracts trade 0.1% below their Friday's closing prices. So expectations before the opening of today's trading session are slightly negative to virtually flat. The European stock market indexes have lost 0.5-0.6% so far. Investors will wait for some economic data announcements: Empire State Manufacturing Index at 8:30 a.m., NAHB Housing Market Index at 10:00 a.m., Leading Indicators at 10:30 a.m. The broad stock market will likely fluctuate along the mentioned medium-term support level. If the S&P 500 index breaks below the last Monday's daily low, we could see more selling pressure.
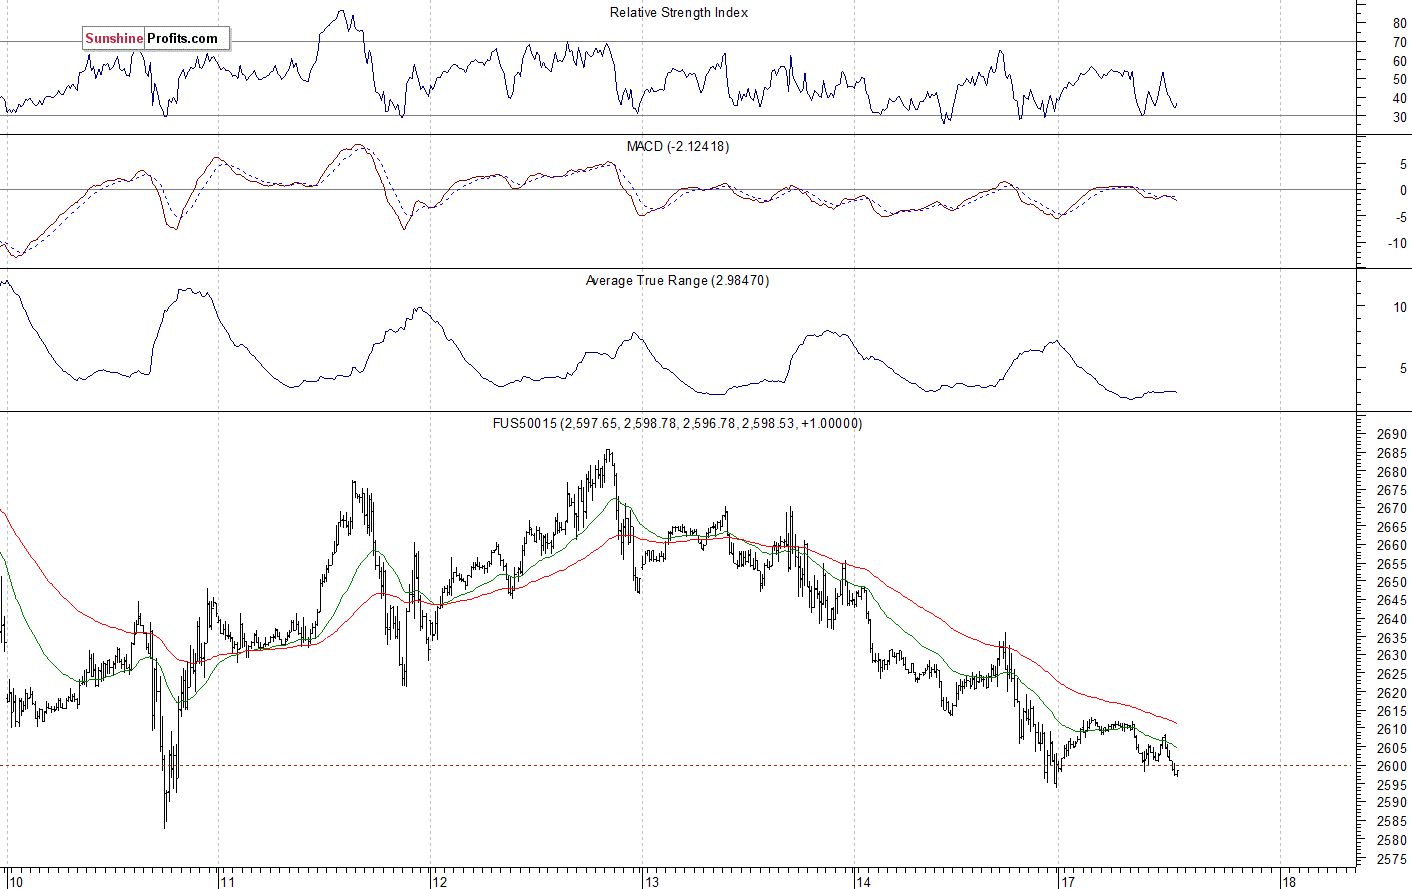
The S&P 500 futures contract trades within an intraday downtrend, as it retraces its overnight advance. The nearest important level of resistance is at around 2,610-2.615, marked by the short-term local highs. On the other hand, the support level is at 2,590, among others. The futures contract trades along the level of 2,600 this morning, as the 15-minute chart shows:
Nasdaq Closer to Local Lows
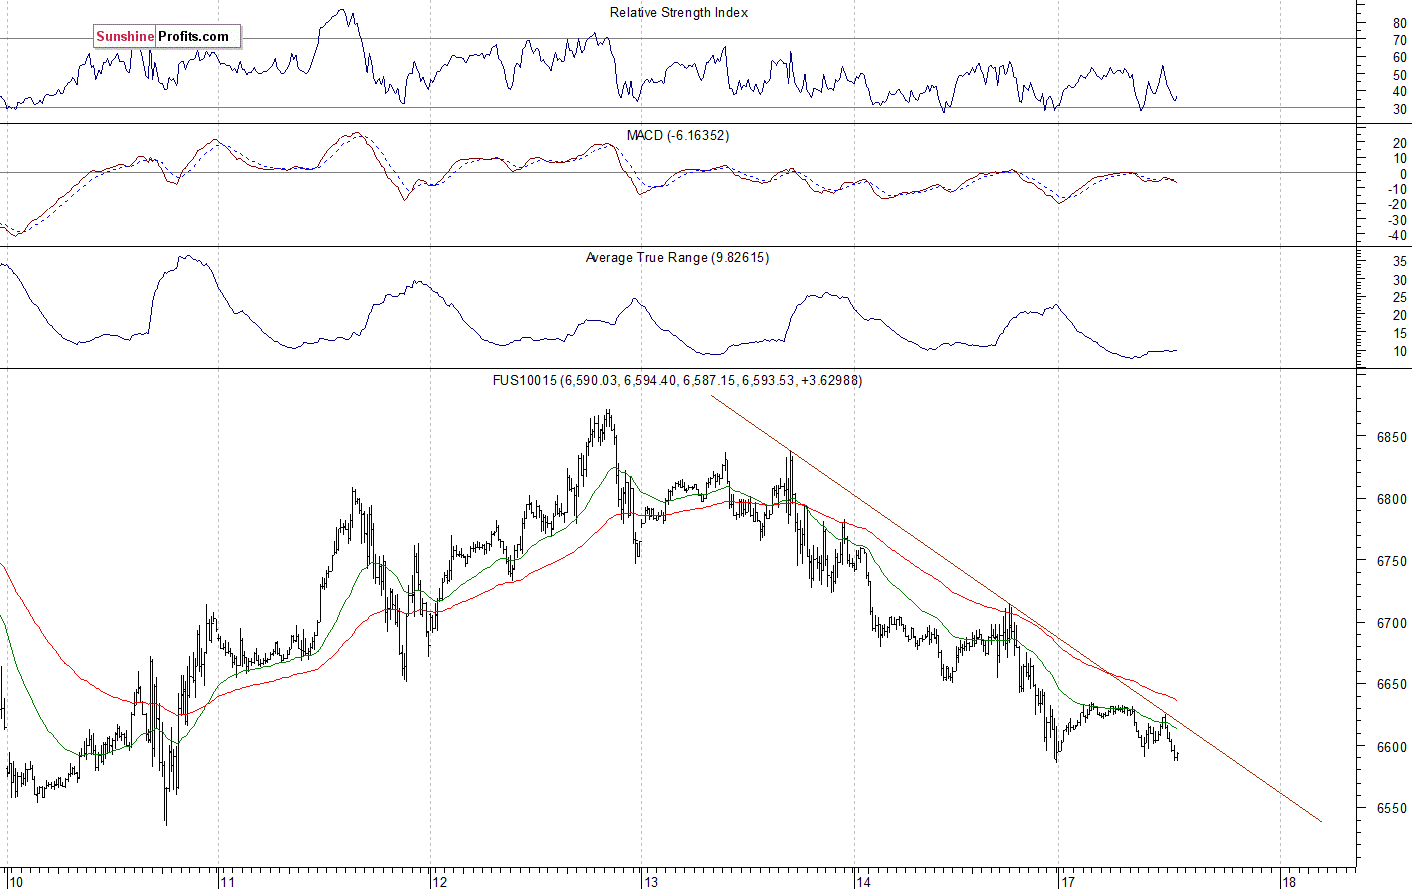
The technology Nasdaq 100 futures contract follows a similar path, as it trades within an intraday downtrend. The market is closer to the late November lows again. It was relatively stronger than the broad stock market recently, as it didn't reach a new medium-term low. The nearest important support level is at 6,500-6,550, among others. The Nasdaq futures contract trades below its short-term downward trend line, as we can see on the 15-minute chart:
Apple, Amazon - Still Not Bullish
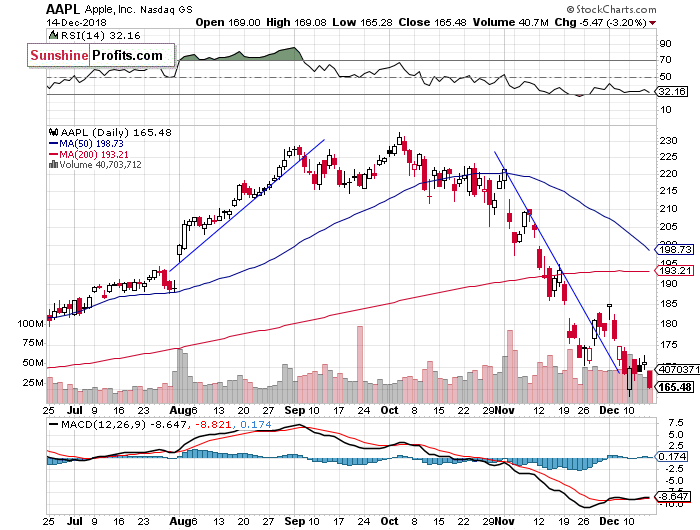
Let's take a look at Apple, Inc. stock (AAPL) daily chart (chart courtesy of http://stockcharts.com). The stock extended its sell-off on Monday a week ago, following Friday's breakdown below the price of $170. It reached the new medium-term low of $163.33. Then the market got back to $170. So was it a panic bottom before an upward reversal? There have been no confirmed positive signals so far:
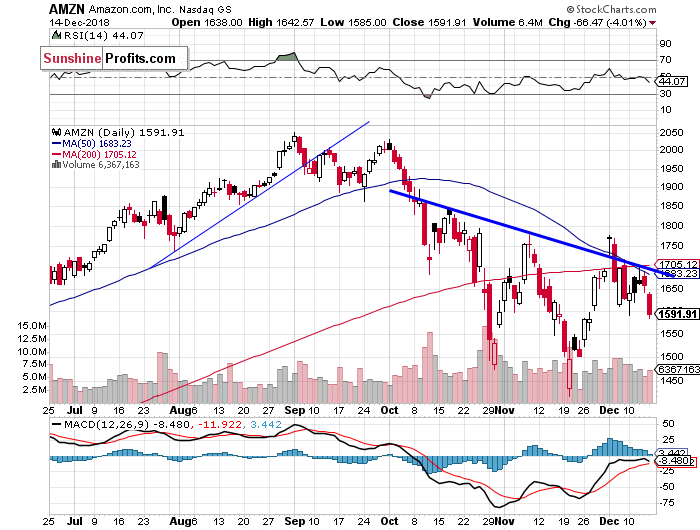
Now let's take a look at Amazon.com, Inc. stock (AMZN) daily chart. The resistance level remains at $1,700-1,800, marked by some previous local highs. The stock continues to trade below its two-month-long downward trend line, as we can see on the daily chart:
Dow Jones - Breaking Lower?
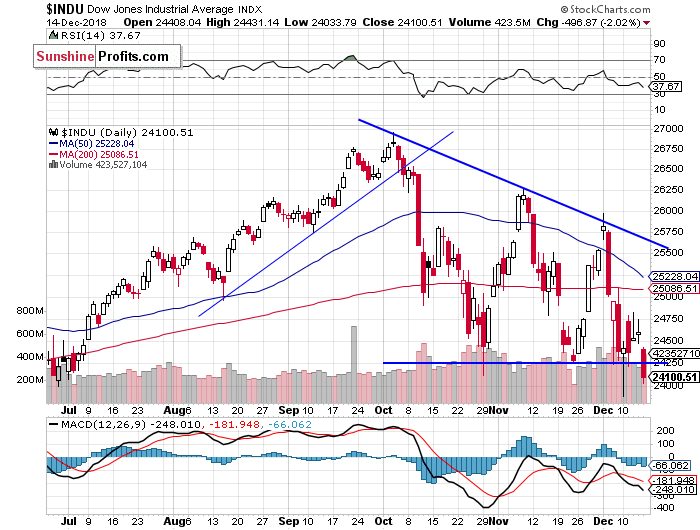
The Dow Jones Industrial Average got closer to 26,000 mark recently, as it accelerated its short-term uptrend, but then it quickly reversed lower. We saw more downward action a week ago, as the index fell below 24,000 before bouncing off and closing virtually flat. Will the market break below the medium-term support level? If it continues below 24,000 mark, we could see more selling pressure:
Japanese Nikkei Going Sideways
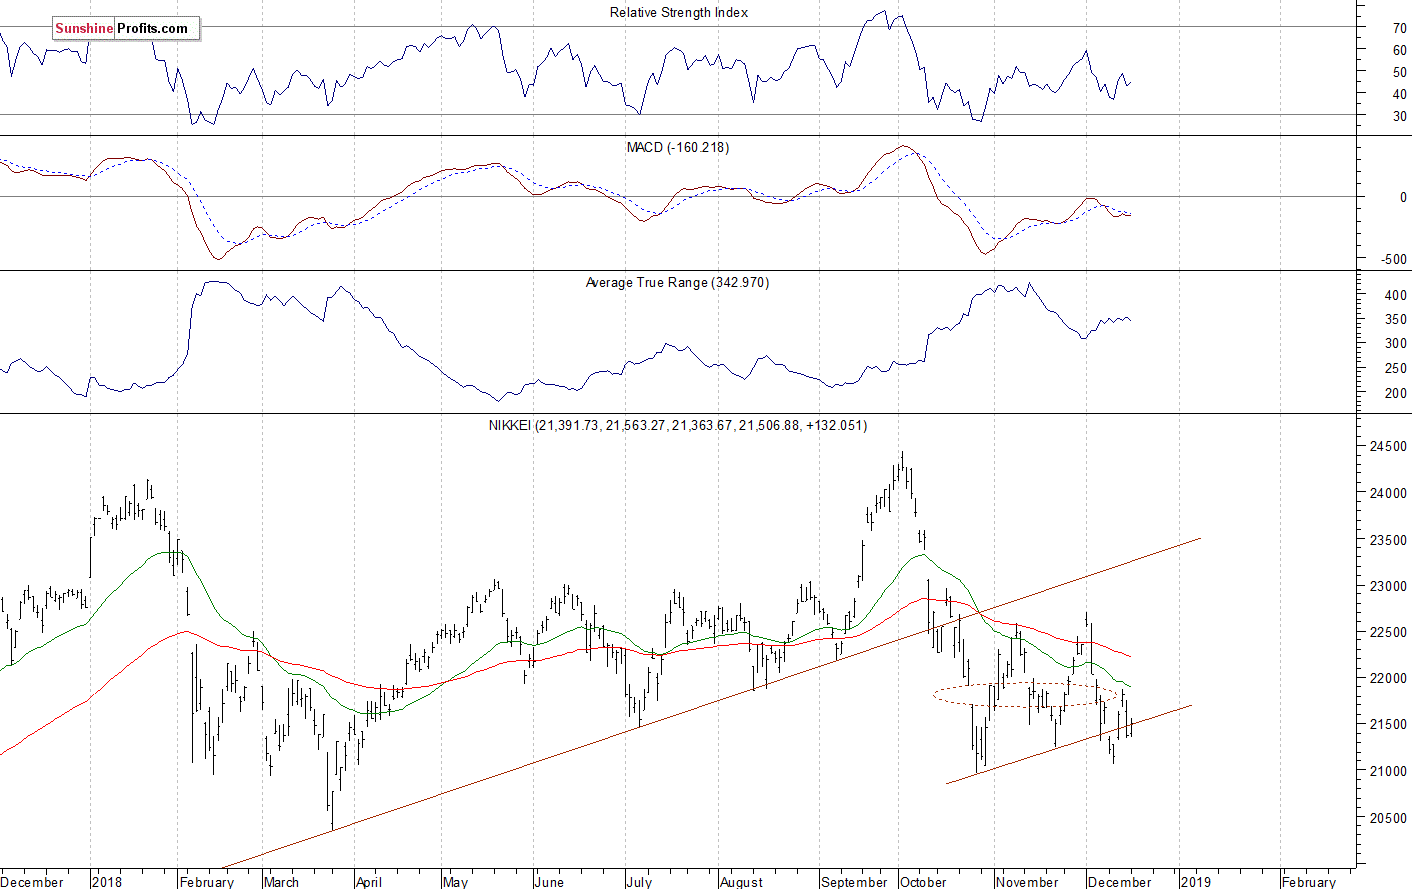
Let's take a look at the Japanese Nikkei 225 index. It continues to trade along its two-month-long upward trend line. We still can see the medium-term consolidation along the level of 22,000:
The S&P 500 index fell the lowest since the early April on Monday a week ago following a failed rally to 2,800 mark. It reversed its intraday downward course after bouncing off the support level of around 2,580-2,600. We saw a rebound, but stocks got back lower on Friday. The broad stock market continues to trade close to its medium-term support level.
Concluding, the S&P 500 index will likely open slightly lower today. We may see an attempt at breaking below the medium-term support level. There have been no confirmed positive signals so far.
Trading position (short-term; our opinion): no positions are justified from the risk/reward perspective.
Thank you.
Paul Rejczak
Stock Trading Strategist
Stock Trading Alerts

