

In the last five trading days (September 23 - September 29) the broad stock market has been retracing some of its recent decline. The S&P 500 index set new record high of 3,588.11 on September 2. But then the market fell below February 19 high of 3,393.52. On Thursday it set a local low of 3,209.45 before bouncing back above 3,300 mark for the second time. So far, the recent decline looks like a downward correction of a 63.7% rally from March 23 corona virus low at 2,191.86.
The S&P 500 index has gained 0.46% between September 23 and September 29. In the same period of time our five long and five short stock picks have lost 0.15%. So stock picks were relatively slightly weaker than the broad stock market. Our long stock picks have lost 1.43%, but short stock picks have resulted in a gain of 1.12%.
There are risks that couldn't be avoided in trading. Hence the need for proper money management and a relatively diversified stock portfolio. This is especially important if trading on a time basis - without using stop-loss/ profit target levels. We are just buying or selling stocks at open on Wednesday and selling or buying them back at close on the next Tuesday.
If stocks were in a prolonged downtrend, being able to profit anyway, would be extremely valuable. Of course, it's not the point of our Stock Pick Updates to forecast where the general stock market is likely to move, but rather to provide you with stocks that are likely to generate profits regardless of what the S&P does.
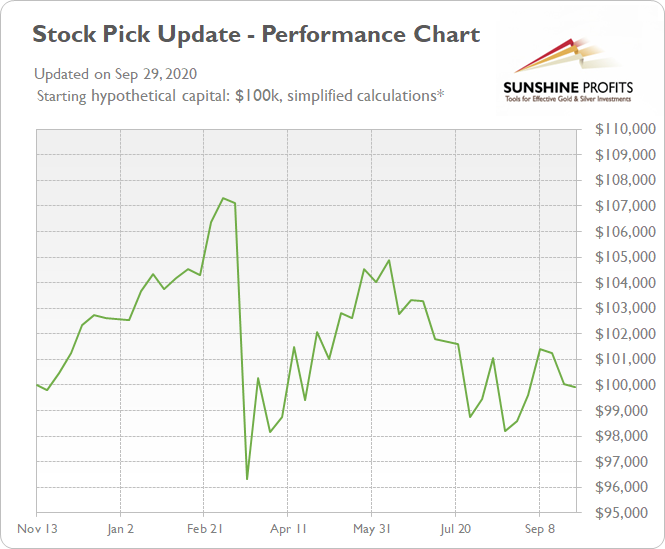
This means that our overall stock-picking performance can be summarized on the chart below. The assumptions are: starting with $100k, no leverage used. The data before Dec 24, 2019 comes from our internal tests and data after that can be verified by individual Stock Pick Updates posted on our website.
Below we include statistics and the details of our three recent updates:
- September 29, 2020
Long Picks (September 23 open - September 29 close % change): MLM (+4.25%), MAS (-0.88%), ROST (+0.03%), OXY (-10.24%), JNJ (-0.28%)
Short Picks (September 23 open - September 29 close % change): KMI (-3.26%), MCK (-1.92%), VZ (-0.99%), AMCR (-1.27%), IR (+1.82%)
Average long result: -1.43%, average short result: +1.12%
Total profit (average): -0.15% - September 22, 2020
Long Picks (September 16 open - September 22 close % change): CF (-5.53%), ROST (-4.54%), SPG (-8.33%), XOM (-2.55%), CME (-1.50%)
Short Picks (September 16 open - September 22 close % change): MPC (-0.86%), JPM (-5.19%), ETR (+1.03%), SHW (-3.12%), MCD (-2.59%)
Average long result: -4.49%, average short result: +2.15%
Total profit (average): -1.17% - September 15, 2020
Long Picks (September 9 open - September 15 close % change): UAA (+7.37%), EFX (-3.77%), CF (+2.30%), SLB (-1.52%), INTC (+0.95%)
Short Picks (September 9 open - September 15 close % change): PSX (+0.02%), GLW (+0.98%), EIX (-0.37%), MCD (+3.43%), RTX (+2.79%)
Average long result: +1.07%, average short result: -1.37%
Total profit (average): -0.15%
Let's check which stocks could magnify S&P's gains in case it rallies, and which stocks would be likely to decline the most if S&P plunges. Here are our stock picks for the Wednesday, September 30 - Tuesday, October 6 period.
We will assume the following: the stocks will be bought or sold short on the opening of today's trading session (September 30) and sold or bought back on the closing of the next Tuesday's trading session (October 6).
We will provide stock trading ideas based on our in-depth technical and fundamental analysis, but since the main point of this publication is to provide the top 5 long and top 5 short candidates (our opinion, not an investment advice) for this week, we will focus solely on the technicals. The latter are simply more useful in case of short-term trades.
First, we will take a look at the recent performance by sector. It may show us which sector is likely to perform best in the near future and which sector is likely to lag. Then, we will select our buy and sell stock picks.
There are eleven stock market sectors: Energy, Materials, Industrials, Consumer Discretionary, Consumer Staples, Health Care, Financials, Technology, Communications Services, Utilities and Real Estate. They are further divided into industries, but we will just stick with these main sectors of the stock market.
We will analyze them and their relative performance by looking at the Select Sector SPDR ETF's.
Let's start with our first charts (charts courtesy of www.stockcharts.com).
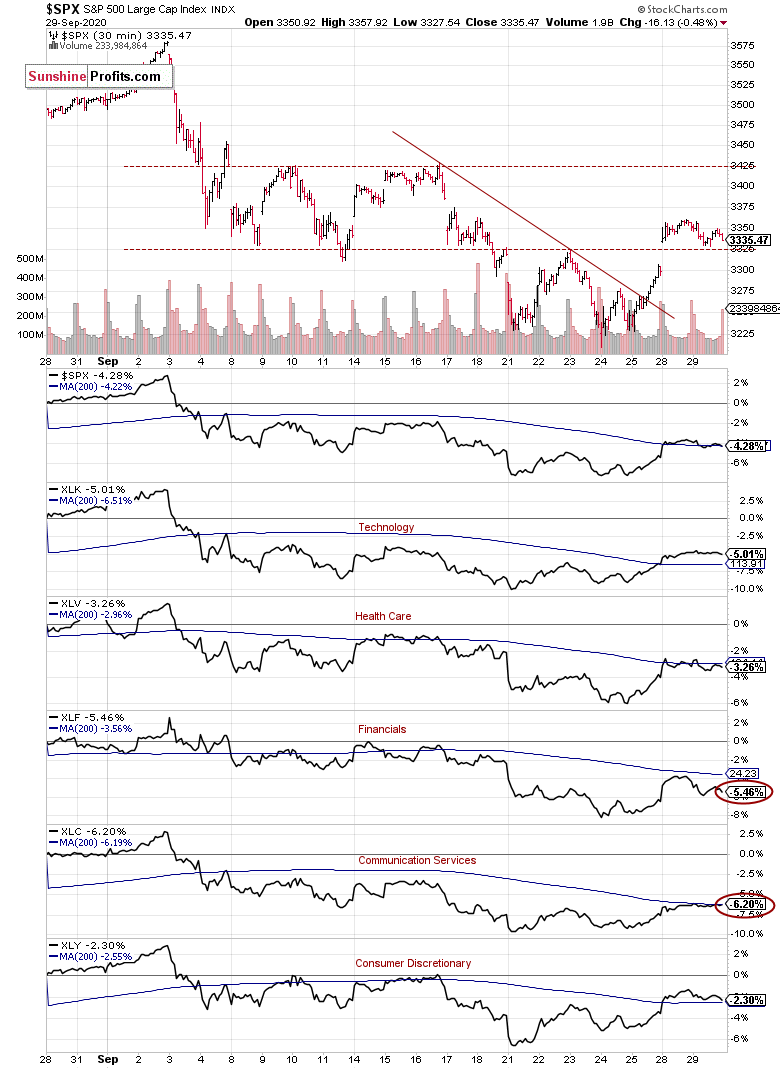
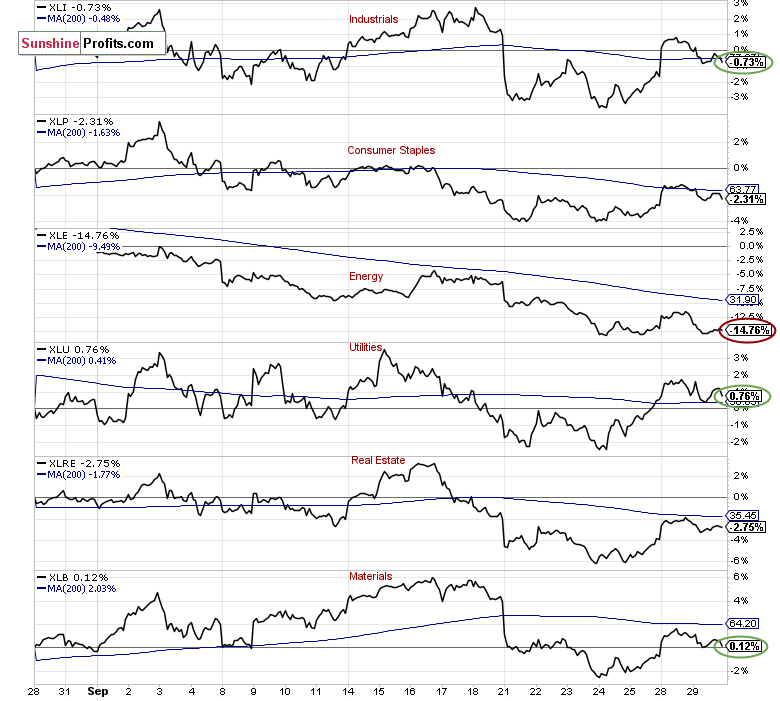
There's S&P 500's 30-minute chart along with market sector indicators for the past month. The S&P 500 index has lost 4.28% from the closing price on August 27. The strongest sector was Utilities XLU, as it gained 0.76%. The Materials XLB gained 0.12% and Industrials XLI lost 0.73%.
On the other hand, the weakest sector was Energy XLE, as it lost 14.76% in a month. The Communication Services XLC lost 6.20% and Financials XLF lost 5.46%.
Based on the above, we decided to choose our stock picks for the next week. We will choose our top 3 long and top 3 short candidates using trend-following approach, and top 2 long and top 2 short candidates using contrarian approach:
Trend-following approach:
- buys: 1 x Utilities, 1 x Materials, 1 x Industrials
- sells: 1 x Energy, 1 x Communication Services, 1 x Financials
Contrarian approach (betting against the recent trend):
- buys: 1 x Energy, 1 x Communication Services
- sells: 1 x Utilities, 1 x Materials
Trend-following approach
Top 3 Buy Candidates
SO Southern Co. - Utilities
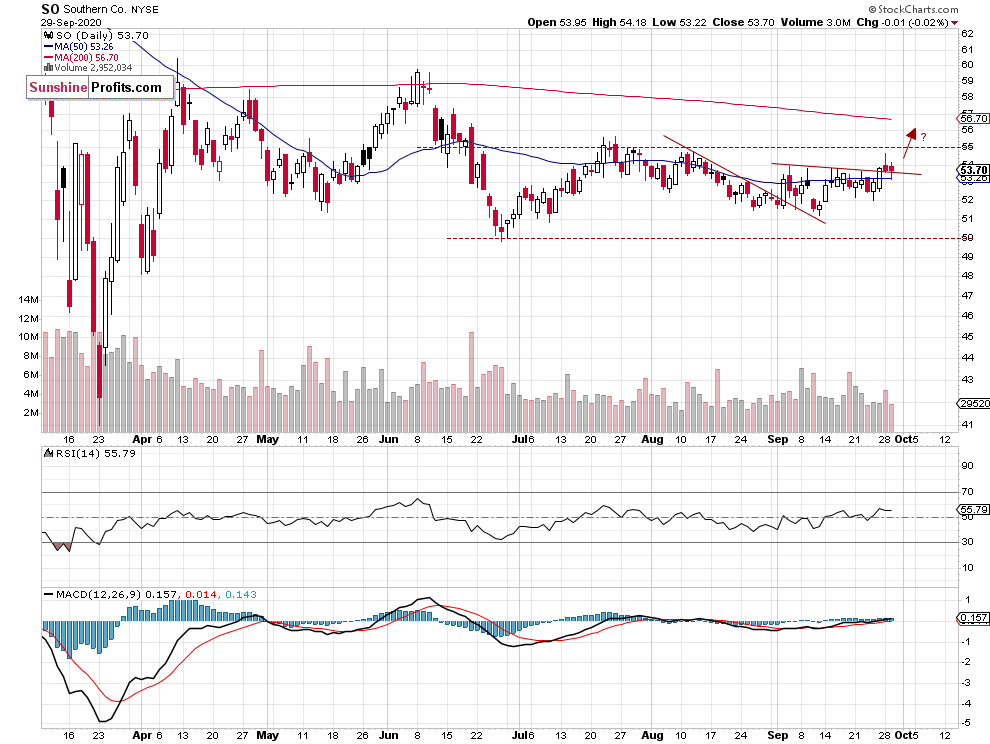
- Stock trades within a short-term consolidation after breaking above local highs - possible uptrend continuation play
- The resistance level is at $55
- The support level is at $50-52
SEE Sealed Air Corp New - Materials
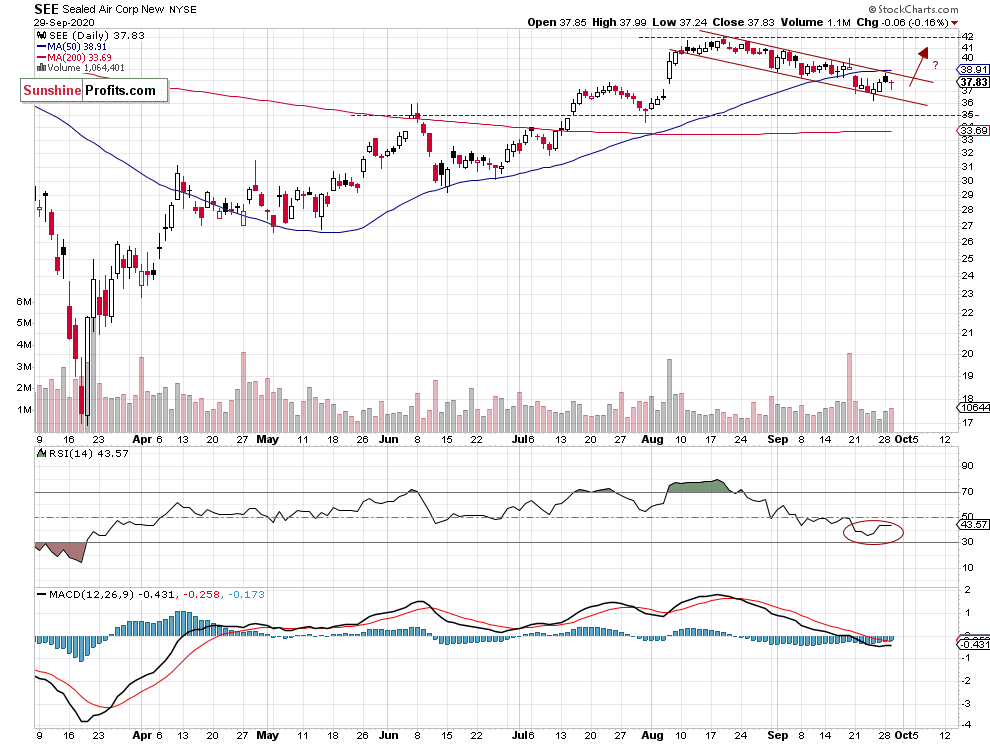
- Possible bull flag pattern and uptrend continuation
- The resistance level of $42
- The support level is at $35-36
MAS Masco Corp. - Industrials
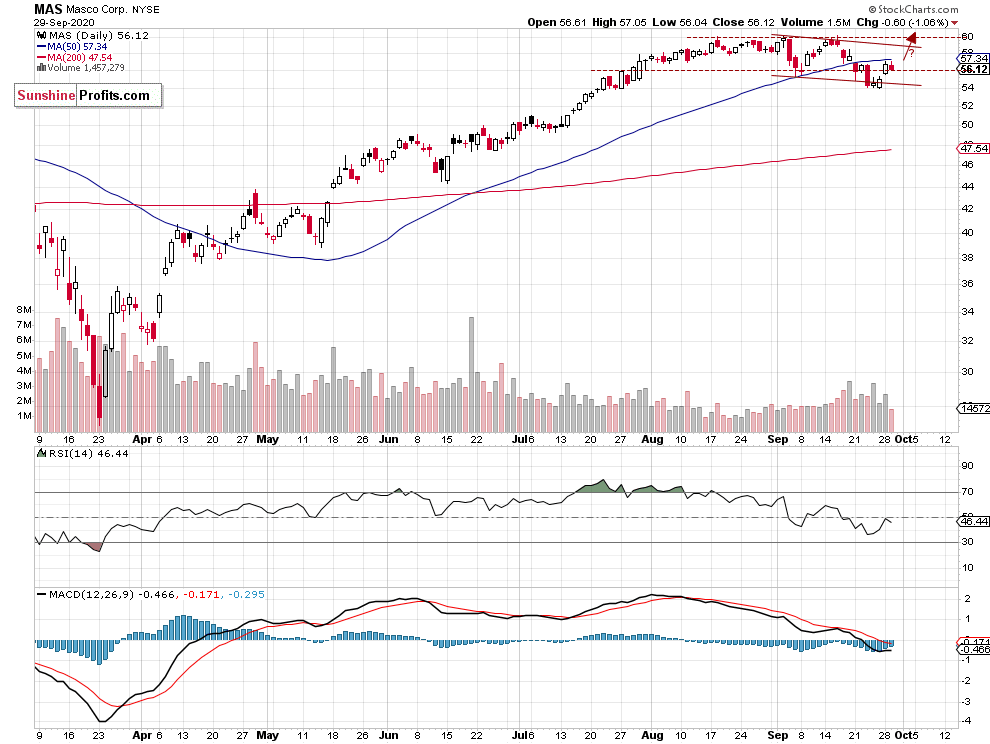
- Possible bull flag pattern and uptrend continuation play
- The resistance level of $60
- The support level is at $54
Top 3 Sell Candidates
CVX Chevron Corp. - Energy
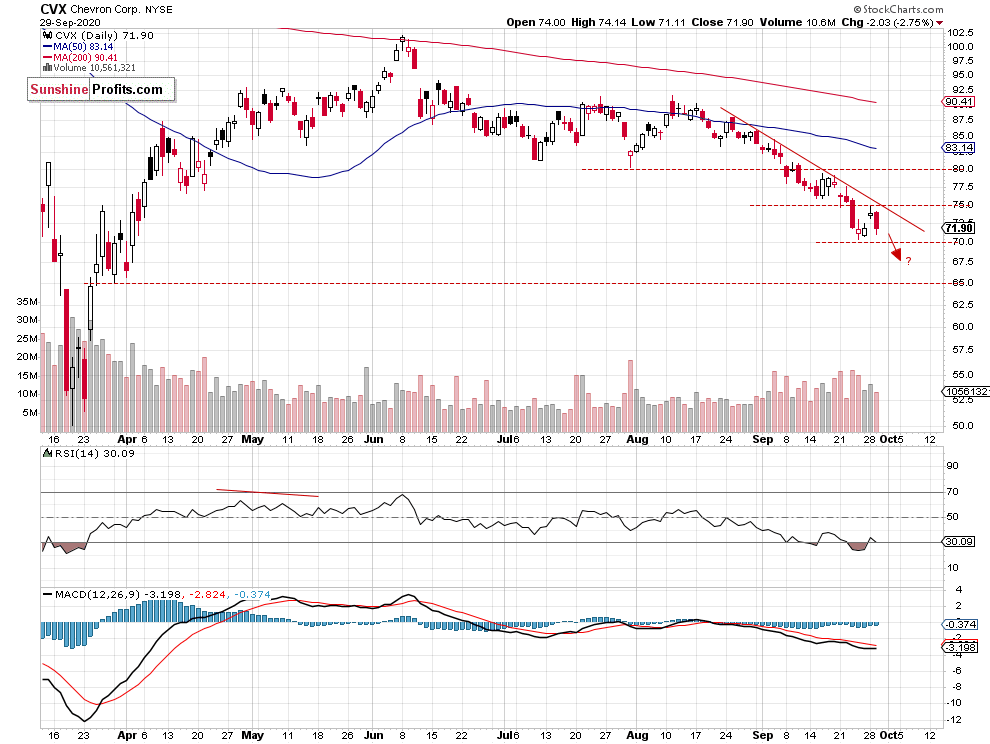
- Stock remains below downward trend line
- The support level is at $65-70
- The resistance level is at $75
VZ Verizon Communications - Communication Services
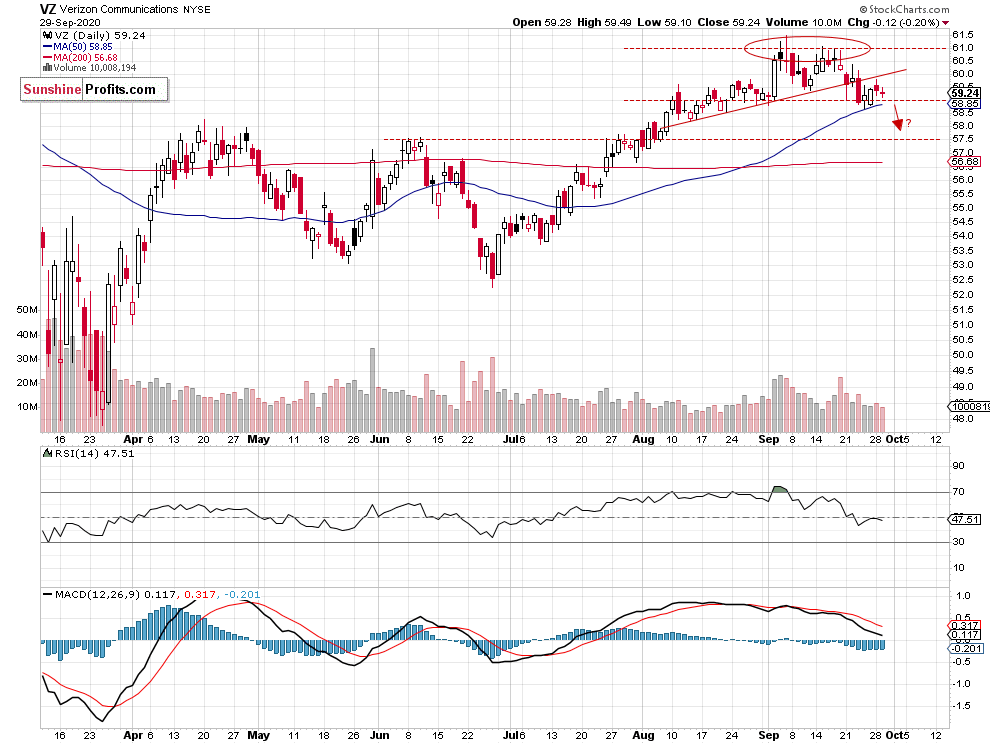
- Possible medium-term topping pattern
- The resistance level is at $61
- The support level is at $57.5-59.0 (short-term downside profit target level)
MS Morgan Stanley - Financials
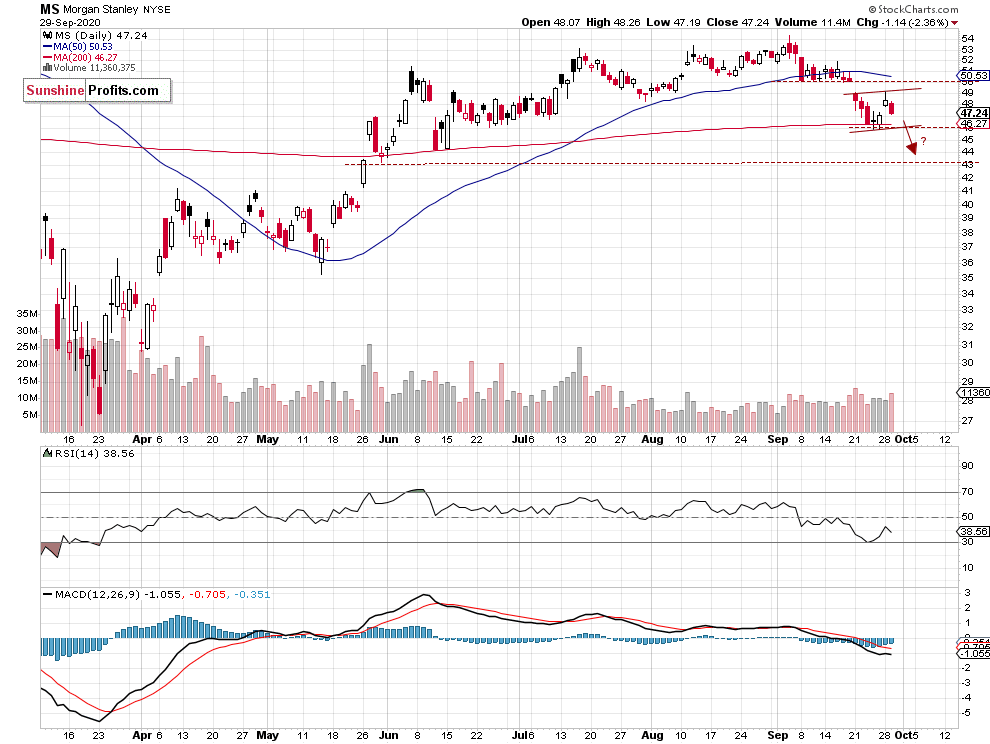
- Possible short-term bear flag pattern - downtrend continuation play
- The resistance level is at $50
- The support level is at $43-45 (short-term downside profit target level)
Contrarian approach
Top 2 Buy Candidates
EOG EOG Resources, Inc. - Energy
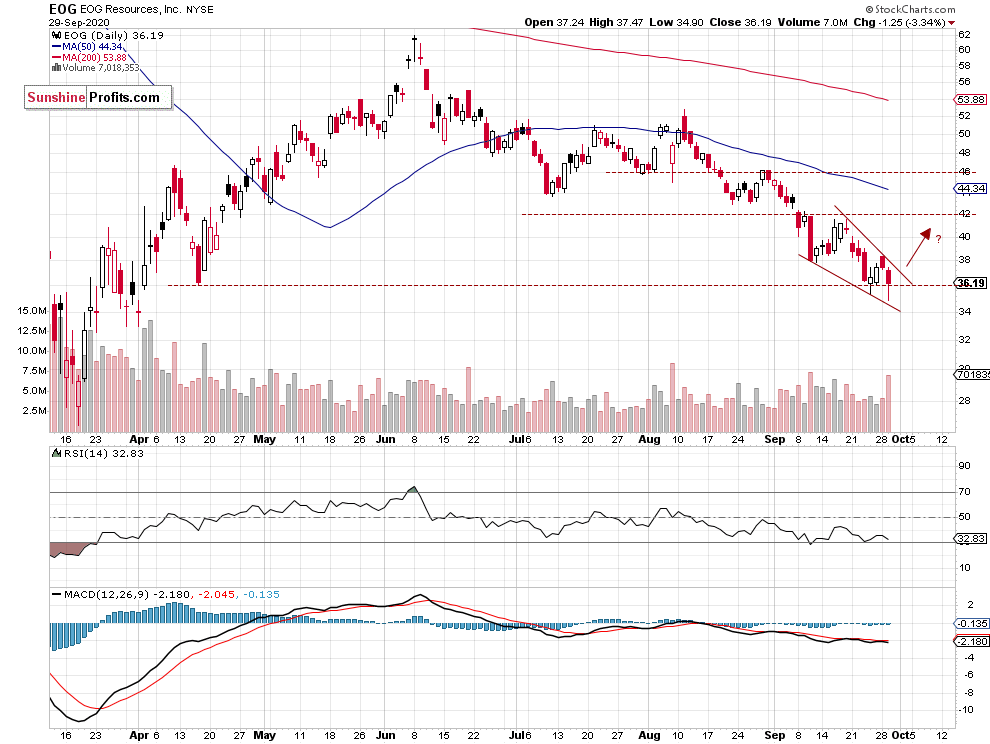
- Possible falling wedge bottoming pattern
- Upward correction play
- The resistance level of $42, support level at $34-36
FB Facebook, Inc. - Communication Services
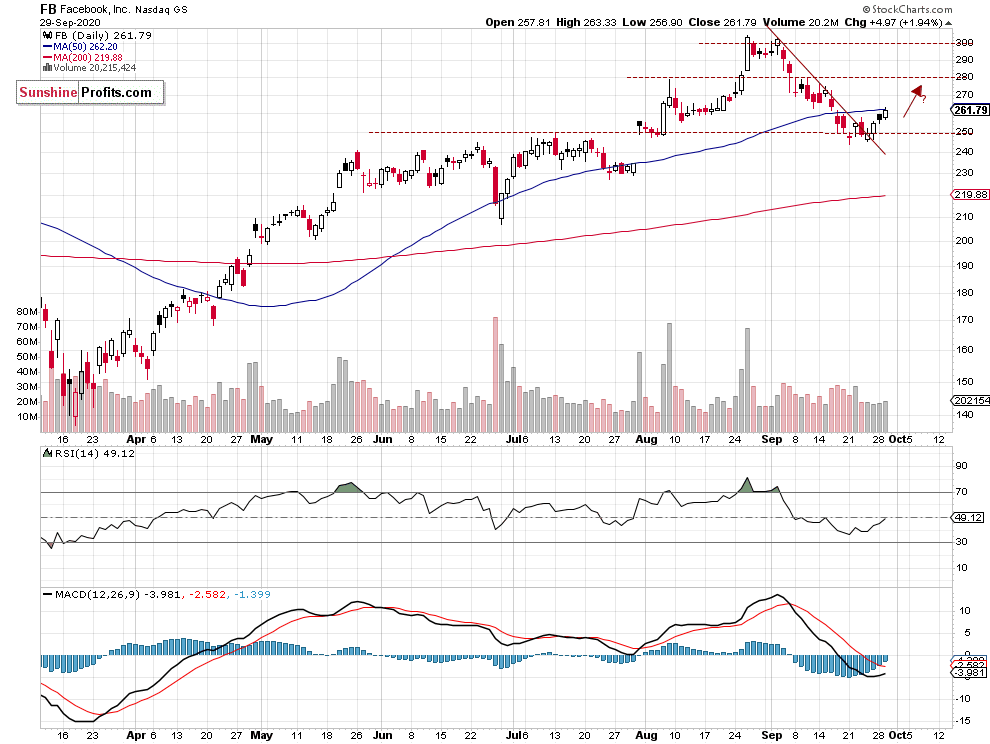
- Possible uptrend resuming following breaking above month-long downward trend line
- Stock remains above the support level of $250
- Short-term upside profit target and the resistance level of $280
Top 2 Sell Candidates
PPL PPL Corp. - Utilities
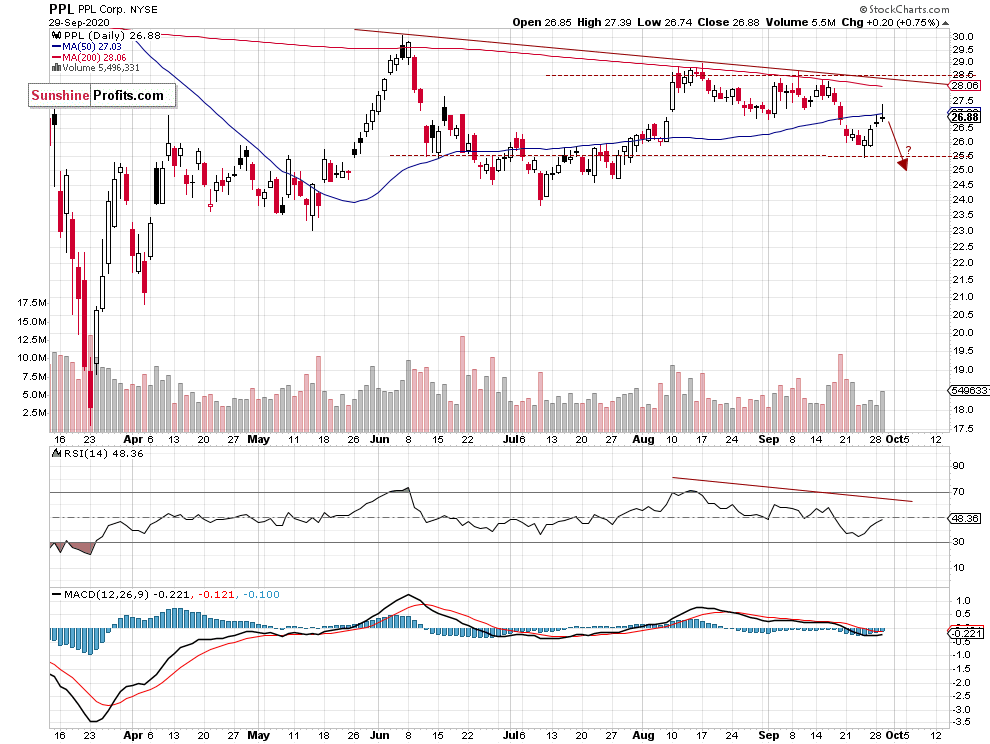
- Possible short-term downtrend continuation
- Stock remains below medium-term downward trend line
- The support level is at $25.50 - short-term downside profit target level
NEM Newmont Corporation - Materials
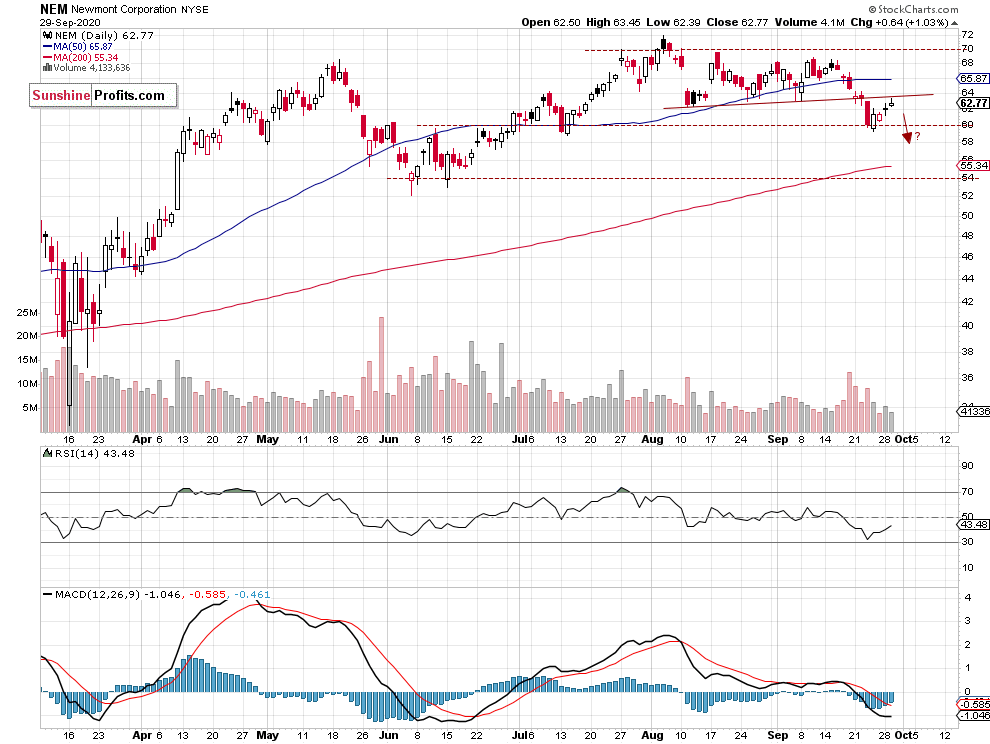
- Stock broke below month-long upward trend line
- Downtrend resuming after a short-term upward correction play
- The support level of $55-60 - short-term downside profit target level
Conclusion
In our opinion, the following stock trades are justified from the risk/reward point of view between September 30 and October 6:
Long: SO, SEE, MAS, EOG, FB
Short: CVX, VZ, MS, PPL, NEM
Thank you.
Paul Rejczak
Stock Trading Strategist
Sunshine Profits - Effective Investments through Diligence and Care

