

The broad stock market has been advancing between July 1 and July 7. The S&P 500 index got closer to its early June medium-term local highs again. More than three months ago on March 23, the market sold off to new medium-term low of 2,191.86. It was a stunning 35.4% below February 19 record high of 3,393.52. The corona virus and economic slowdown fears have erased more than a third of the broad stock market value. Then we saw huge come-back rally, as the index got back above 3,200 mark.
The S&P 500 index has gained 1.27% between July 1 and July 7. In the same period of time our five long and five short stock picks have lost 1.43%. Stock picks were relatively weaker than the broad stock market. Our long stock picks have lost 1.29% and short stock picks have resulted in a loss of 1.57%. However, the overall results remain relatively better than the S&P 500 index over last months.
If stocks were in a prolonged downtrend, being able to profit anyway, would be extremely valuable. Of course, it's not the point of our Stock Pick Updates to forecast where the general stock market is likely to move, but rather to provide you with stocks that are likely to generate profits regardless of what the S&P does.
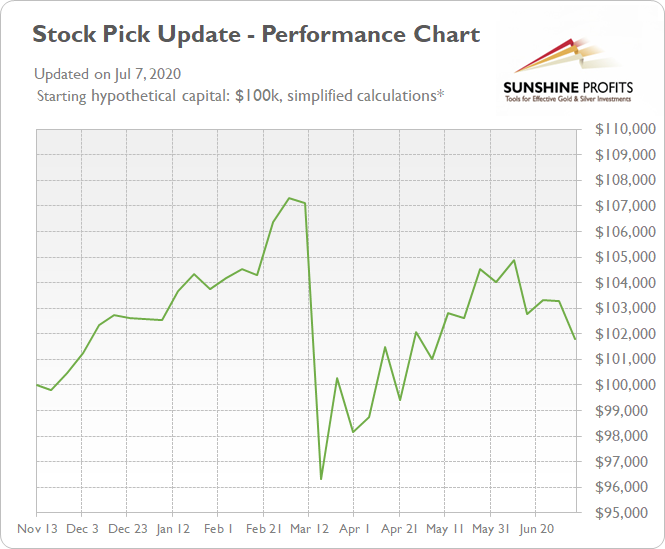
This means that our overall stock-picking performance can be summarized on the chart below. The assumptions are: starting with $100k, no leverage used. The data before Dec 24, 2019 comes from our internal tests and data after that can be verified by individual Stock Pick Updates posted on our website.
Below we include statistics and the details of our three recent updates:
- July 7, 2020
Long Picks (July 1 open - July 7 close % change): INTC (-2.67%), F (+0.33%), PPG (+2.17%), DTE (-0.35%), AIG (-5.93%)
Short Picks (July 1 open - July 7 close % change): XEL (+2.00%), BLK (+0.91%), EOG (-5.72%), MSFT (+2.52%), EBAY (+8.14%)
Average long result: -1.29%, average short result: -1.57%
Total profit (average): -1.43% - June 30, 2020
Long Picks (June 24 open - June 30 close % change): WY (+0.36%), CTSH (+3.76%), HIG (-0.57%), BSX (-2.39%), COP (-2.28%)
Short Picks (June 24 open - June 30 close % change): EW (-1.51%), WMB (0.00%), ETR (-0.27%), CCI (+2.04%), ADBE (-1.07%)
Average long result: -0.23%, average short result: +0.16%
Total profit (average): -0.04% - June 23, 2020
Long Picks (June 17 open - June 23 close % change): BA (-3.41%), DLR (-0.81%), WLTW (+1.27%), BMY (+2.05%), HSY (-2.03%)
Short Picks (June 17 open - June 23 close % change): DHR (-0.23%), CLX (+1.76%), AEP (-1.58%), MMM (-1.47%), PLD (-6.67%)
Average long result: -0.58%, average short result: +1.64%
Total profit (average): +0.53%
Let's check which stocks could magnify S&P's gains in case it rallies, and which stocks would be likely to decline the most if S&P plunges. Here are our stock picks for the Wednesday, July 15 - Tuesday, July 21 period.
We will assume the following: the stocks will be bought or sold short on the opening of today's trading session (July 15) and sold or bought back on the closing of the next Tuesday's trading session (July 21).
We will provide stock trading ideas based on our in-depth technical and fundamental analysis, but since the main point of this publication is to provide the top 5 long and top 5 short candidates (our opinion, not an investment advice) for this week, we will focus solely on the technicals. The latter are simply more useful in case of short-term trades.
First, we will take a look at the recent performance by sector. It may show us which sector is likely to perform best in the near future and which sector is likely to lag. Then, we will select our buy and sell stock picks.
There are eleven stock market sectors: Energy, Materials, Industrials, Consumer Discretionary, Consumer Staples, Health Care, Financials, Technology, Communications Services, Utilities and Real Estate. They are further divided into industries, but we will just stick with these main sectors of the stock market.
We will analyze them and their relative performance by looking at the Select Sector SPDR ETF's.
Let's start with our first charts (charts courtesy of www.stockcharts.com).
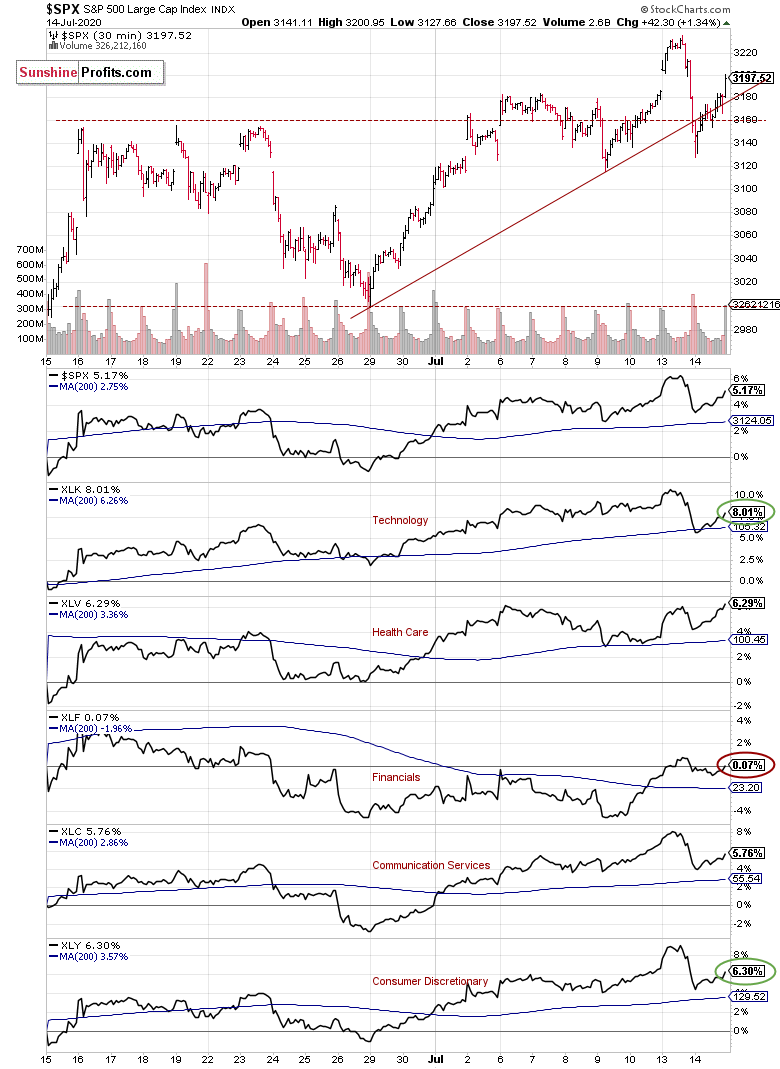
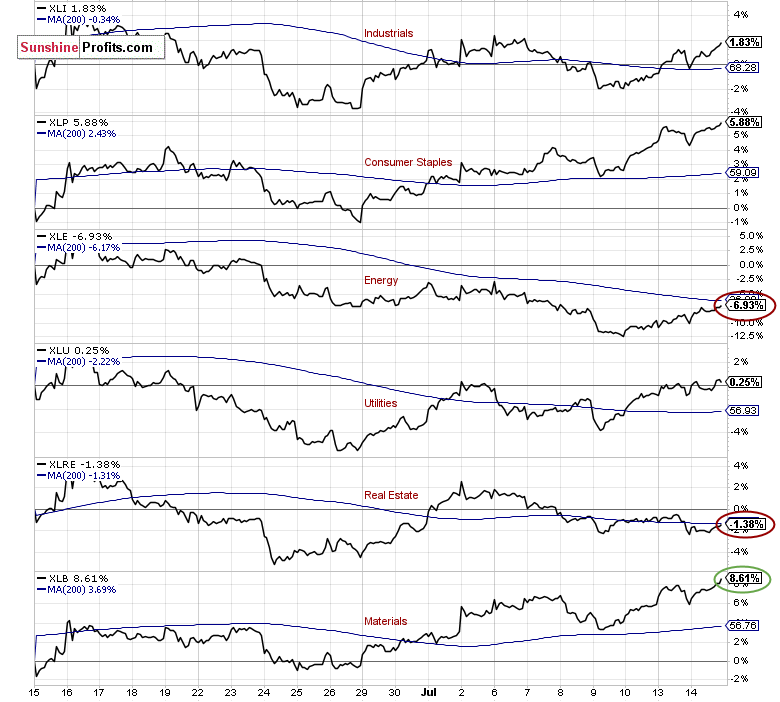
There's S&P 500's 30-minute chart along with market sector indicators for the past month. The S&P 500 index has gained 5.17% from the closing price on June 12. The strongest sector was Materials XLB, as it gained 8.61%. The Technology XLK gained 8.01% and Consumer Discretionary XLY gained 6.30%.
On the other hand, the weakest sector was Energy XLE, as it lost 6.93% in a month. The Real Estate XLRE lost 1.38% and Financials XLF gained just 0.07%.
Based on the above, we decided to choose our stock picks for the next week. We will choose our top 3 long and top 3 short candidates using trend-following approach, and top 2 long and top 2 short candidates using contrarian approach:
Trend-following approach:
- buys: 1 x Materials, 1 x Technology, 1 x Consumer Discretionary
- sells: 1 x Energy, 1 x Real Estate, 1 x Financials
Contrarian approach (betting against the recent trend):
- buys: 1 x Energy, 1 x Real Estate
- sells: 1 x Materials, 1 x Technology
Trend-following approach
Top 3 Buy Candidates
DOW Dow Holdings Inc. - Materials
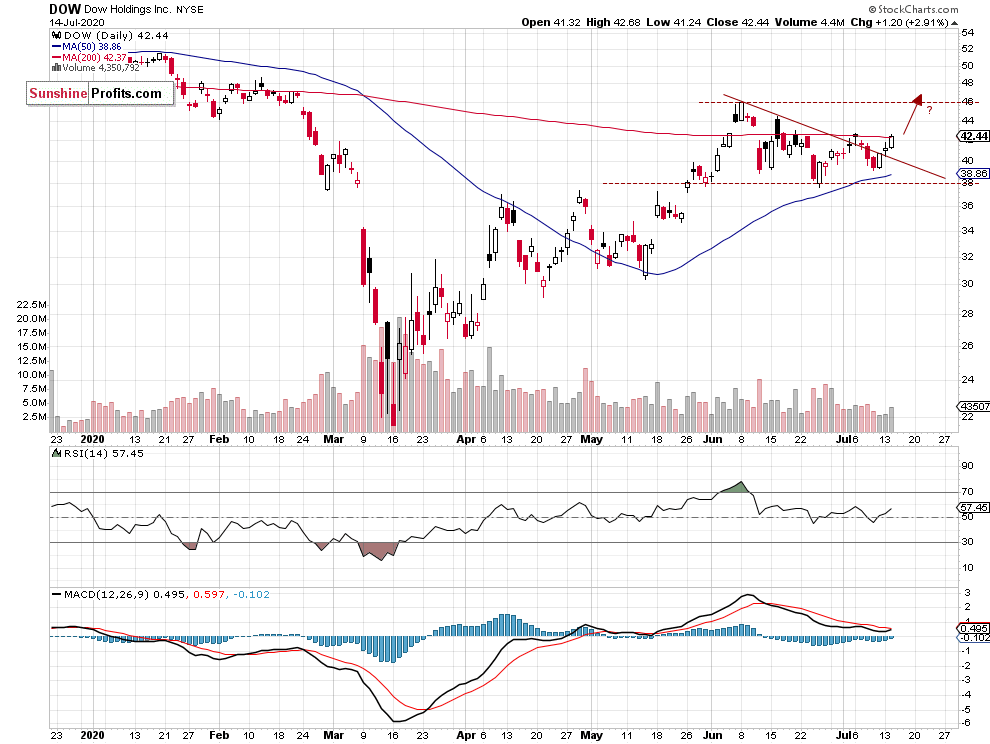
- Stock broke above over month-long downward trend line
- Potential medium-term uptrend continuation
- The resistance level of $46 (short-term upside profit target level)
INTC Intel Corp. - Technology
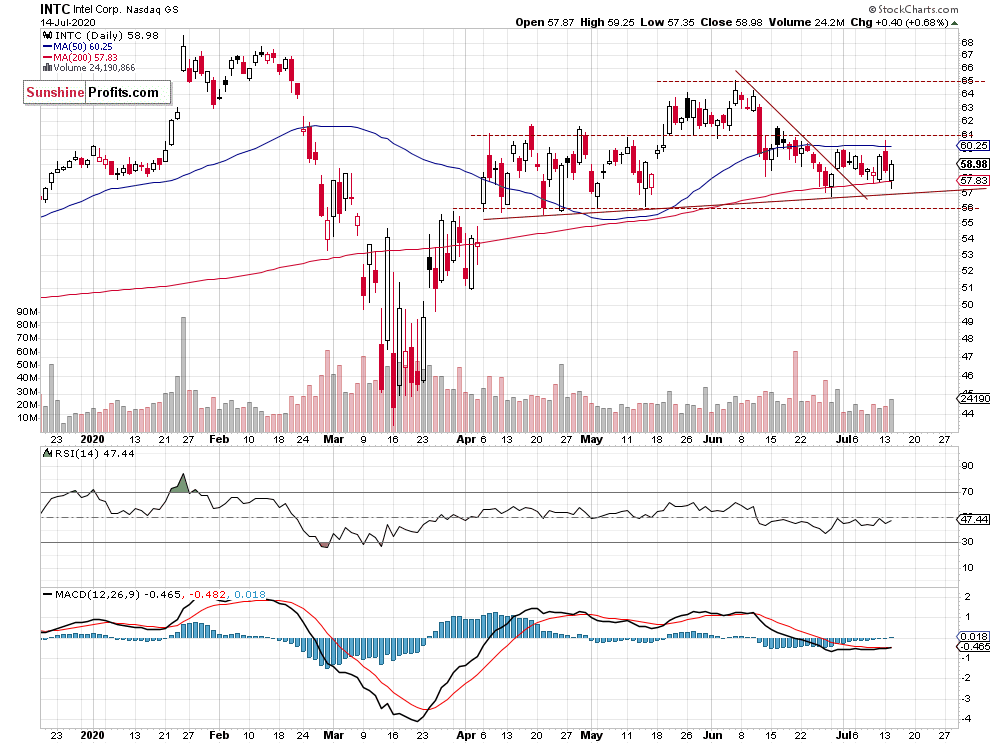
- Stock remains above medium-term upward trend line
- The resistance level and upside profit target level at $61-65
- The support level is at $56
MCD McDonalds Corp. - Consumer Discretionary
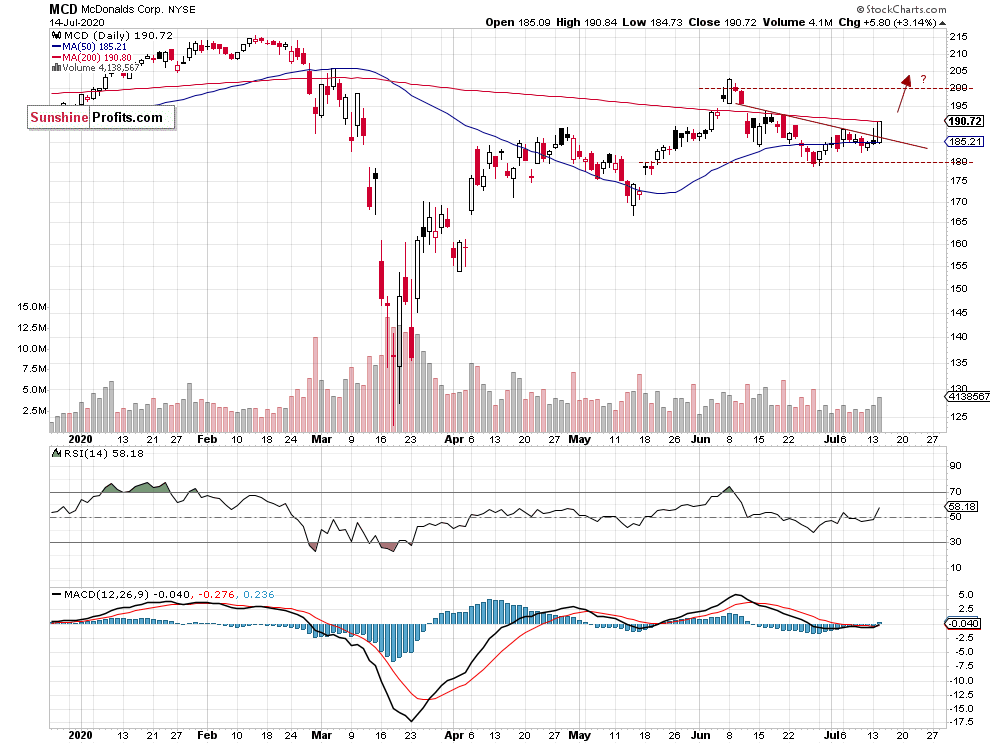
- Stock broke above downward trend line
- The resistance level of $200 (short-term upside profit target)
- The support level remains at $180
Top 3 Sell Candidates
COG Cabot Oil & Gas Corp. - Energy
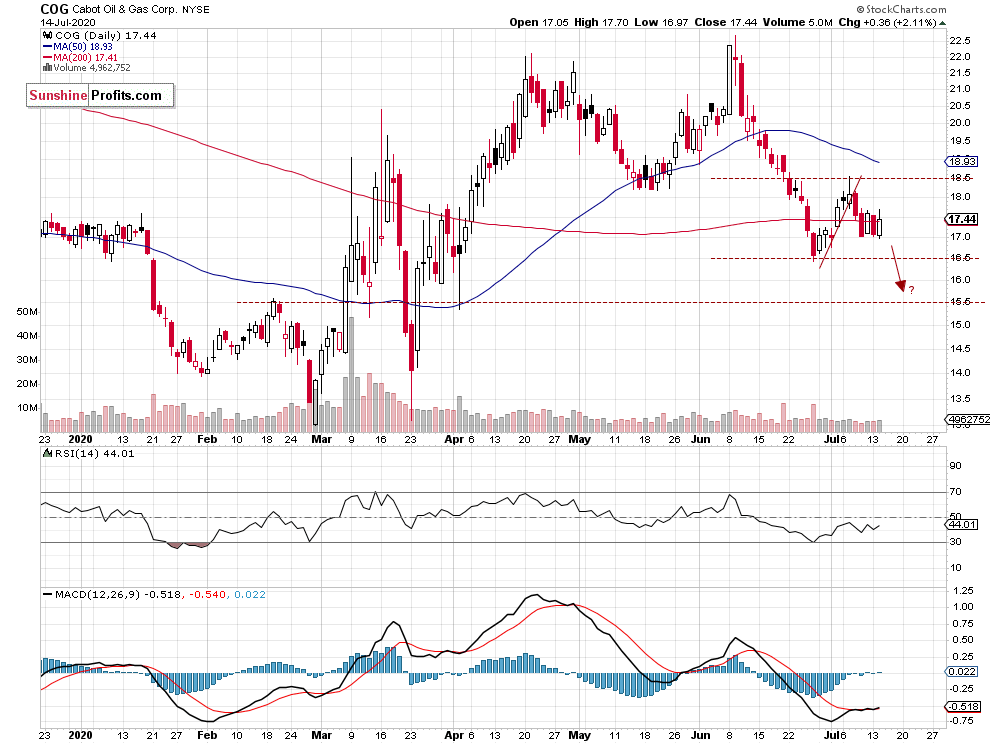
- Stock trades within a consolidation following its June sell-off
- The market may resume the downtrend
- The resistance level is at $18.50 and support level is at $15.50 (downside profit target level)
VNO Vornado Realty Trust - Real Estate
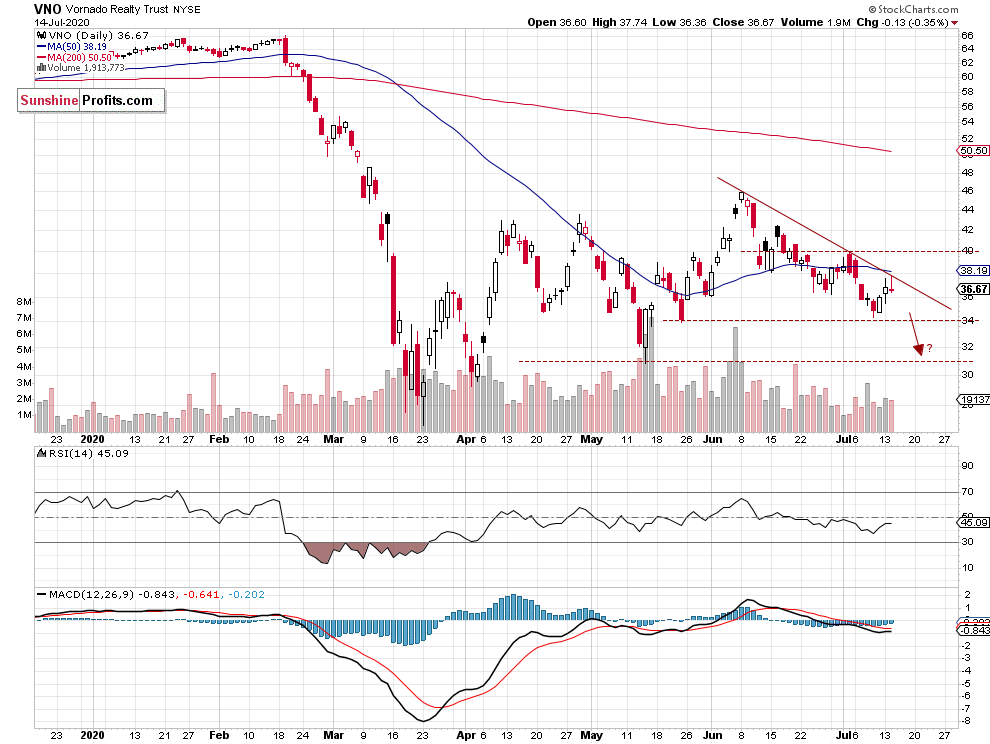
- Stock trades below its over month-long downward trend line
- The resistance level of $40
- The support level of $31-34 - short-term downside profit target level
AON Aon Corp. - Financials
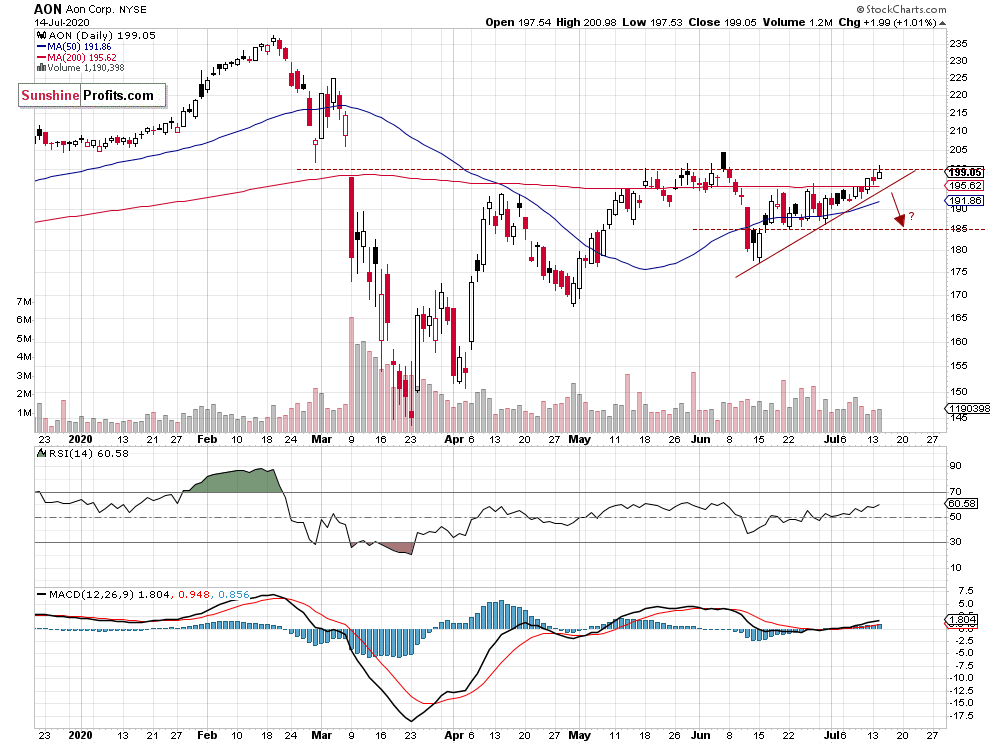
- Potential short-term topping pattern following over month-long advance
- Stock is closer to previous local high
- The support level is at $185 (initial downside profit target level)
Contrarian approach
Top 2 Buy Candidates
XOM Exxon Mobil Corp. - Energy
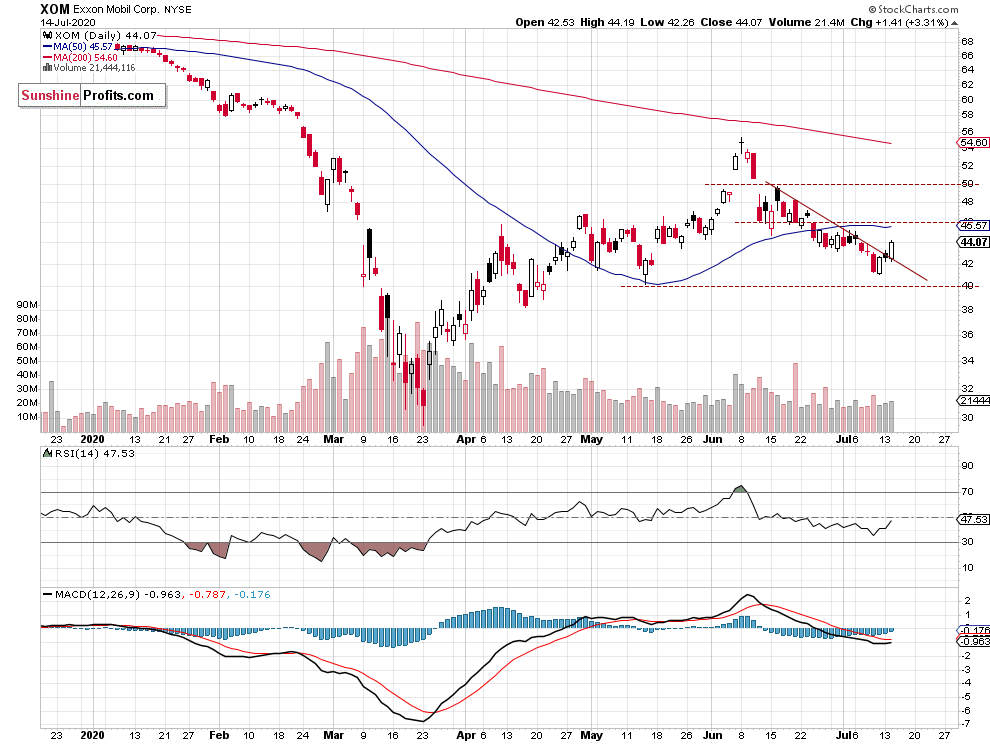
- Stock may resume its medium-term uptrend after breaking above the downward trend line
- The resistance level of $46-50 - upside profit target level
HST Host Hotels & Resorts Inc. - Real Estate
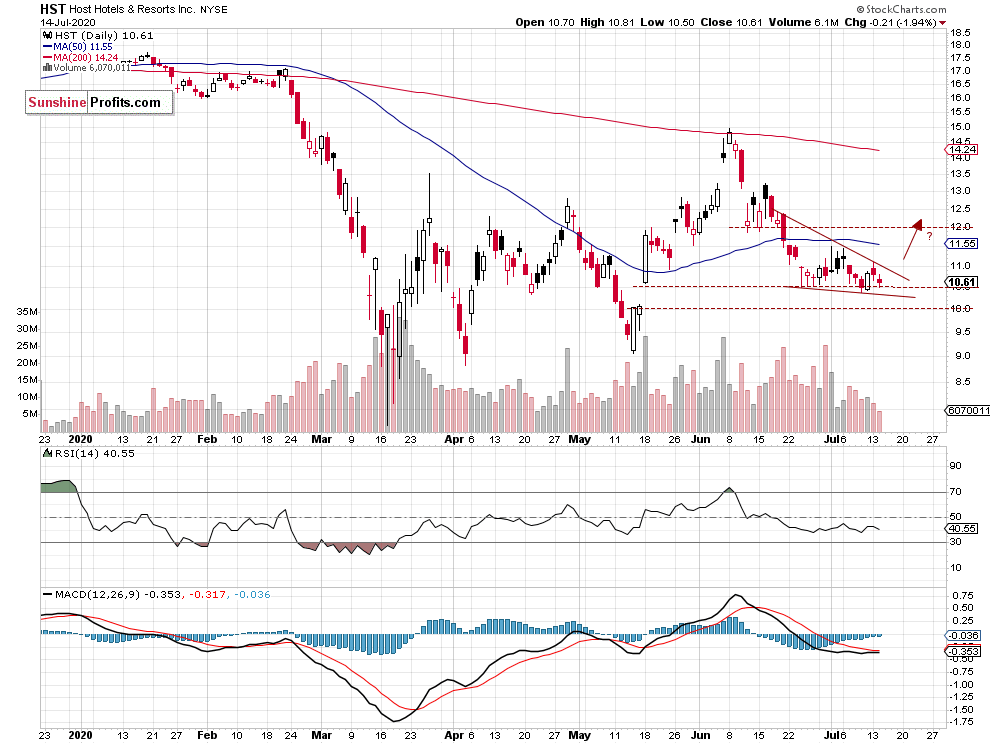
- Potential bottoming pattern - falling wedge
- Stock remains above the support level of $10.00-10.50
- Upside profit target and the resistance level of $12.00
Top 2 Sell Candidates
LIN Linde plc - Materials
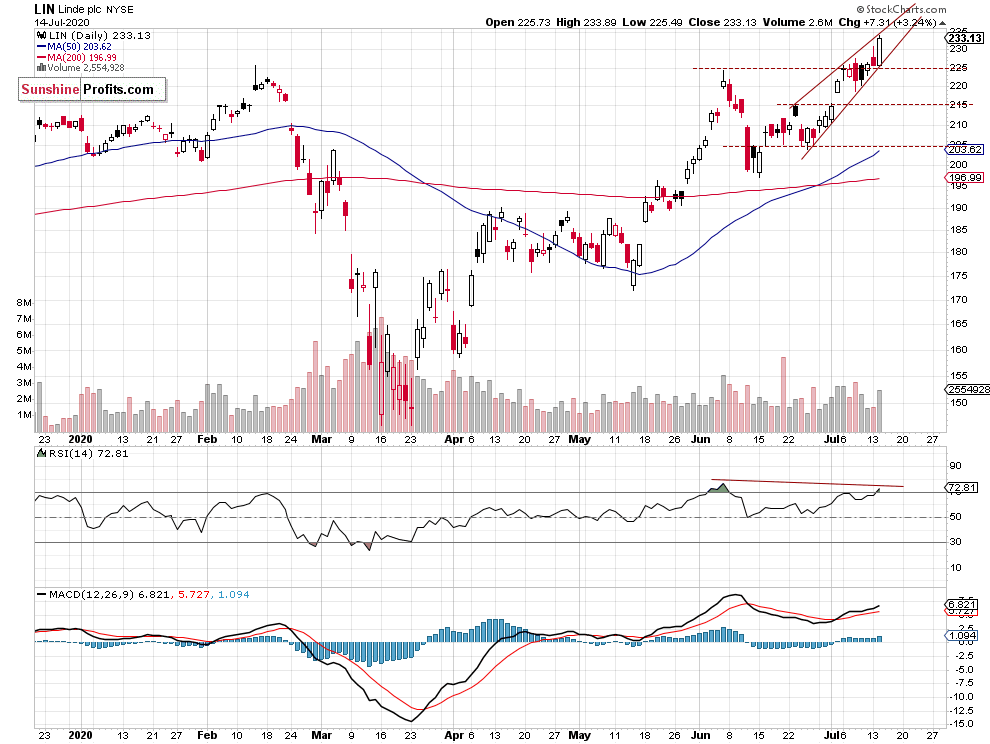
- Stock trades within a potential medium-term topping pattern (rising wedge)
- Negative technical divergence between the price and RSI indicator
- The support level is at $205-215 - initial downside profit target level
AAPL Apple, Inc. - Technology
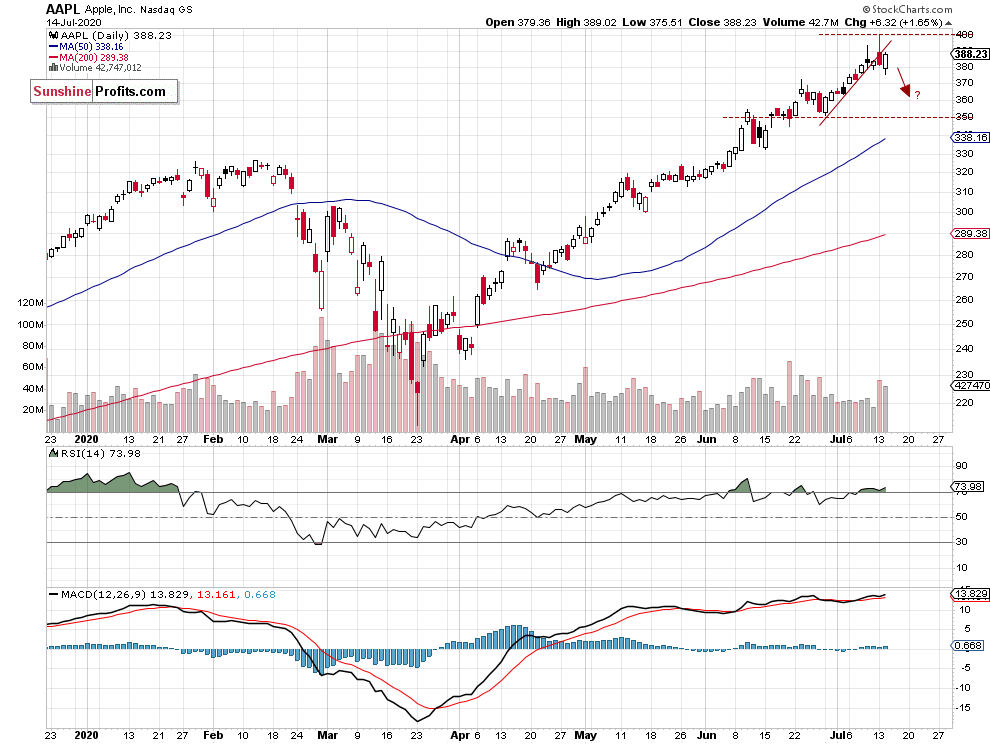
- Potential medium-term topping pattern following recent rally
- Downward correction play
- The support level of $350 - short-term downside profit target level
Conclusion
In our opinion, the following stock trades are justified from the risk/reward point of view between July 15 and July 21:
Long: DOW, INTC, MCD, XOM, HST
Short: COG, VNO, AON, LIN, AAPL
Thank you.
Paul Rejczak
Stock Trading Strategist
Sunshine Profits - Effective Investments through Diligence and Care

