

Let's check which stock could magnify S&P's gains in case it rallies, and which stocks would be likely to decline the most if S&P plunges. Here are our stock picks for the Wednesday, February 12 - Tuesday, February 18 period.
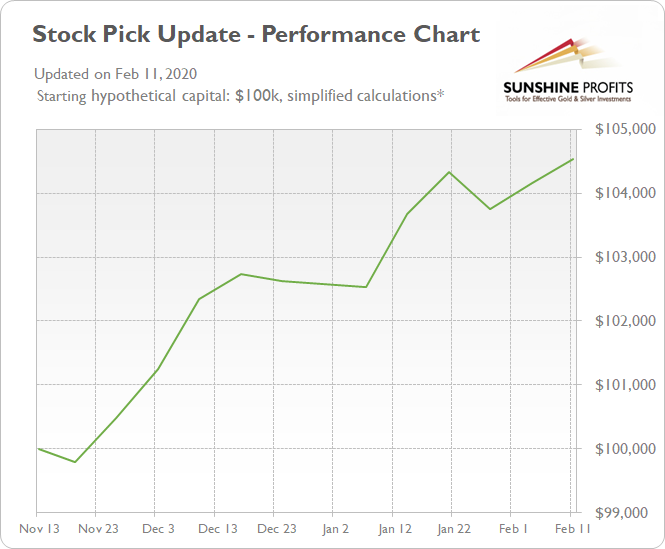
The Stock Pick Update for the Wednesday, February 5 - Tuesday, February 11, 2020 period resulted in a gain of 0.36%. The S&P 500 index has gained 0.99% in the same period. So our stock picks were relatively slightly weaker than the broad stock market. However, both our long stock picks and short stock picks were profitable. Just imagine what long-term advantage we would have when stocks enter a more prolonged downward correction!
Below we include statistics and the details of the previous updates. Only the updates for week-long periods since December 24 are verified by the alert's release on our website, but before we decided to make it available to you, we tested our approach and our stock picks performed very well:
- Feb 11, 2020
Long Picks (Feb 5 open - Feb 11 close % change): PSX (-0.11%), MS (+1.68%), DD (-1.09%), PEG (-1.98%), NTAP (+3.59%)
Short Picks (Feb 5 open - Feb 11 close % change): ETR (+1.93%), NOW (-2.72%), PEAK (+0.69%), HAL (-2.07%), STT (+0.91%)
Average long result: +0.42%, average short result: +0.29%
Total profit (average): +0.36% - Feb 4, 2020
Long Picks (Jan 29 open - Feb 4 close % change): SLB (-0.67%), VMC (+2.26%), WFC (-0.34%), CNP (+0.72%), CTSH (+0.94%)
Short Picks (Jan 29 open - Feb 4 close % change): ATO +0.78%), AAPL (-1.73%), PEAK (-0.11%), KMI (+0.28%, ex div. -$0.25), NEM (-0.16%)
Average long result: +0.58%, average short result: +0.19%
Total profit (average): +0.39% - Jan 28, 2020
Long Picks (Jan 22 open - Jan 28 close % change): HFC (-2.67%), DD (-6.12%), BEN (-2.34%), XLNX (-3.60%), DIS (-4.21%)
Short Picks (Jan 22 open - Jan 28 close % change): AAPL (-0.28%), FB (-2.03%), HST (-4.09%), COP (-4.11%), WRK (-3.00%)
Average long result: -3.79%, average short result: +2.70%
Total profit (average): -0.54% - Jan 21, 2020
Long Picks: DD, CINF, CHD, CSCO, CTL
Short Picks: AMD, FB, IRM, SHW, COF
Average long result: +3.87%, average short result: -2.61%
Total profit (average): +0.63% - Jan 14, 2020
Long Picks: VTR, COST, ECL, COG, CSCO
Short Picks: PXD, AMD, VFC, AVB, PEP
Average long result: +1.42%, average short result: +0.79%
Total profit (average): +1.10% - Jan 7, 2020
Long Picks: GD, CHRW, CTL, CLX, CSCO
Short Picks: PM, ANSS, HST, JCI, EA
Average long result: -1.15%, average short result: +0.97%
Total profit (average): -0.09% - Dec 24, 2019
Long Picks: VTR, CHRW, CF, IDXX, CINF
Short Picks: LLY, MS, AES, DRE, AME
Average long result: +1.12%, average short result: -1.31%
Total profit (average): -0.10% - Dec 17, 2019
Average long result: +2.45%, average short result: -1.69%
Total profit (average): +0.38% - Dec 10, 2019
Average long result: +0.87%, average short result: +1.30%
Total profit (average): +1.08% - Dec 03, 2019
Average long result: -0.03%, average short result: +1.55%
Total profit (average): +0.76% - Nov 26, 2019
Average long result: +1.89%, average short result: -0.50%
Total profit (average): +0.69% - Nov 19, 2019
Average long result: 1.08%, average short result: -1.50%
Total profit (average): -0.21%
The broad stock market has reached historically high levels recently. The breathtaking correction in December of 2018 was followed by the record-breaking comeback rally. The late October - early November breakout led to another leg higher, as the S&P 500 index broke above 3,300 mark. But will the rally continue? If the market goes higher, which stocks are going to beat the index? And if it reverses down from here, which stocks are about to outperform on the short side?
We will provide stock trading ideas based on our in-depth technical and fundamental analysis, but since the main point of this publication is to provide the top 5 long and top 5 short candidates (our opinion, not an investment advice) for this week, we will focus solely on the technicals. The latter are simply more useful in case of short-term trades.
We will assume the following: the stocks will be bought or sold short on the opening of today's trading session (January 2) and sold or bought back on the closing of the next Tuesday's trading session (January 7).
First, we will take a look at the recent performance by sector. It may show us which sector is likely to perform best in the near future and which sector is likely to lag. Then, we will select our buy and sell stock picks.
There are eleven stock market sectors: Energy, Materials, Industrials, Consumer Discretionary, Consumer Staples, Health Care, Financials, Technology, Communications Services, Utilities and Real Estate. They are further divided into industries, but we will just stick with these main sectors of the stock market.
We will analyze them and their relative performance by looking at the Select Sector SPDR ETF's.
Let's start with our first charts (charts courtesy of www.stockcharts.com).
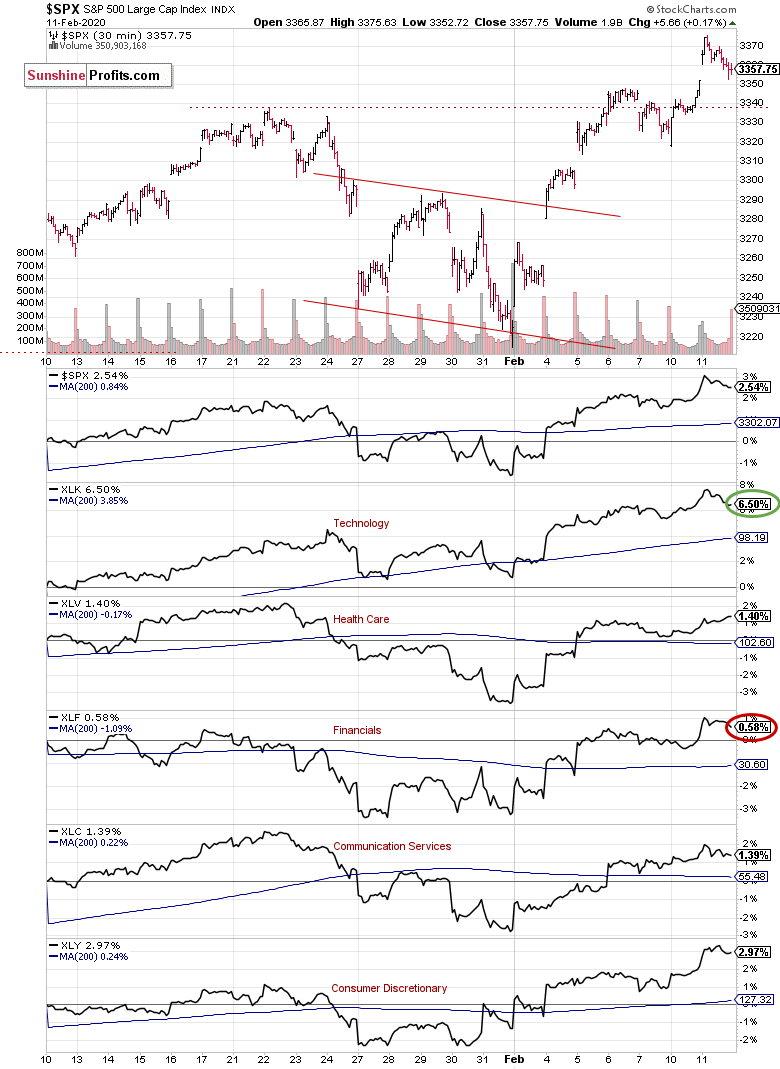
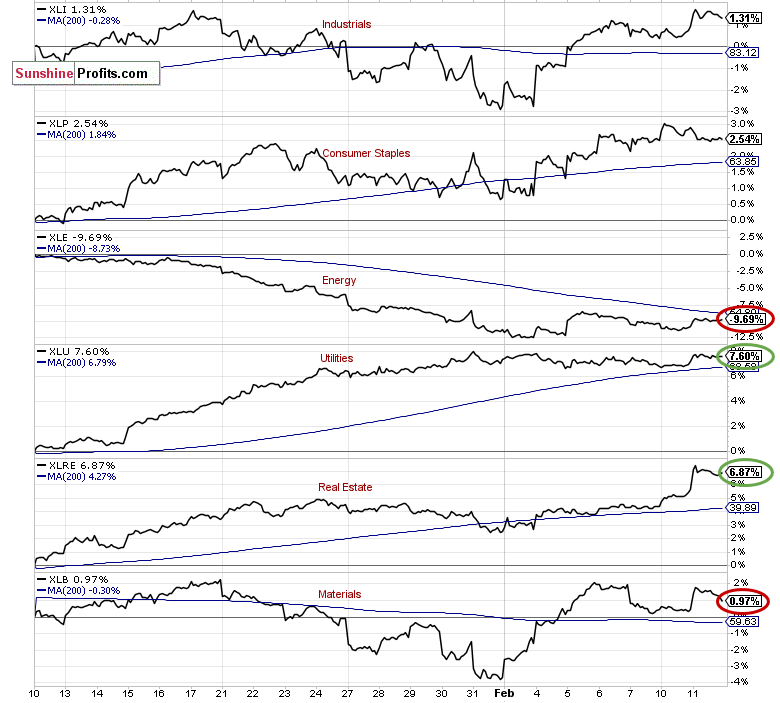
There's S&P 500's 30-minute chart along with market sector indicators for the past month. The S&P 500 index has gained 2.54% since January 10. The strongest sector was the Utilities XLU, as it gained 7.60%. The Real Estate XLRE gained 6.87% and the Technology XLK gained 6.50%.
On the other hand, the weakest sector was the Energy XLE, as it lost 9.69%. The Materials XLB gained 0.97% and the Financials XLF gained just 0.58%.
Based on the above, we decided to choose our stock picks for the next week. We will choose our top 3 long and top 3 short candidates using a contrarian approach, and top 2 long and top 2 short candidates using trend-following approach:
Contrarian approach (betting against the recent trend):
- buys: 1 x Energy, 1 x Materials, 1 x Financials
- sells: 1 x Utilities, 1 x Real Estate, 1 x Technology
Trend-following approach:
- buys: 1 x Utilities, 1 x Real Estate
- sells: 1 x Energy, 1 x Materials
Contrarian approach
Top 3 Buy Candidates
PSX Phillips 66 - Energy
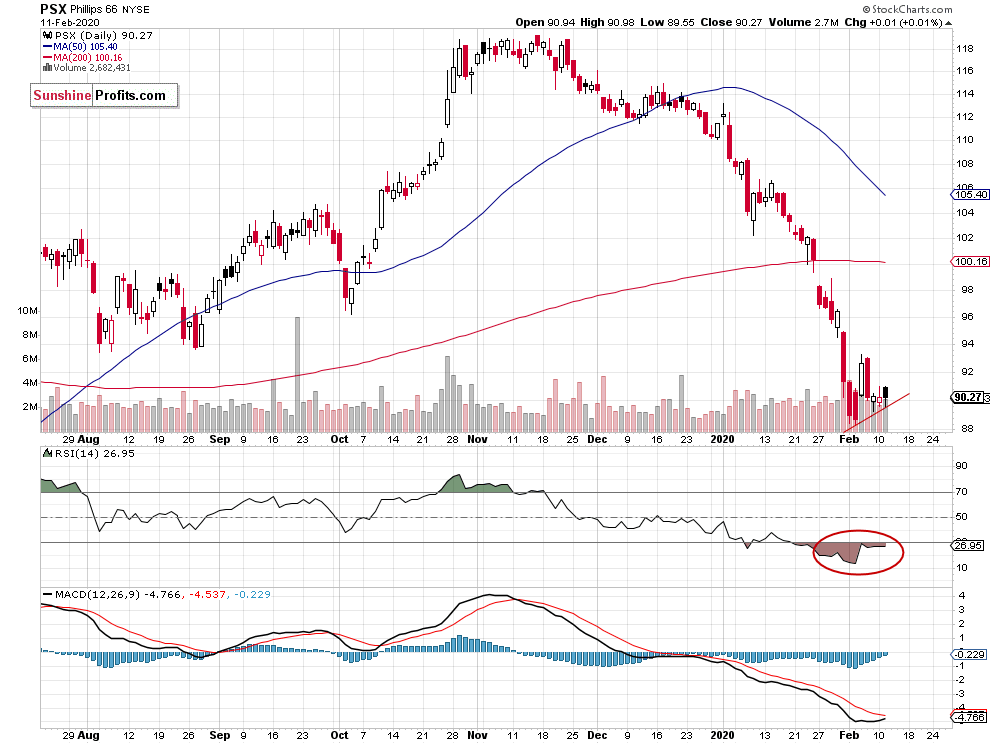
- Technical oversold conditions
- Upward correction play
- Potential resistance level of $94-96
DD DuPont de Nemours, Inc. - Materials
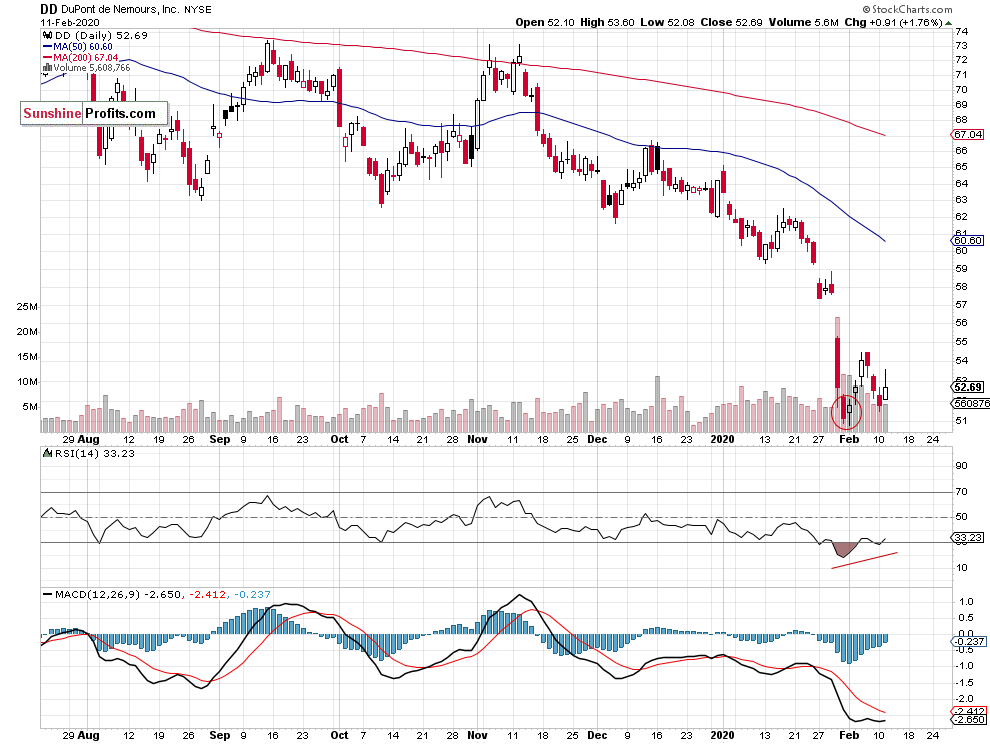
- Technically oversold - short-term correction play
- Positive bullish Harami pattern
- Potential resistance level of $55-57 (upside profit target level)
PNC PNC Financial Services Gr - Financials
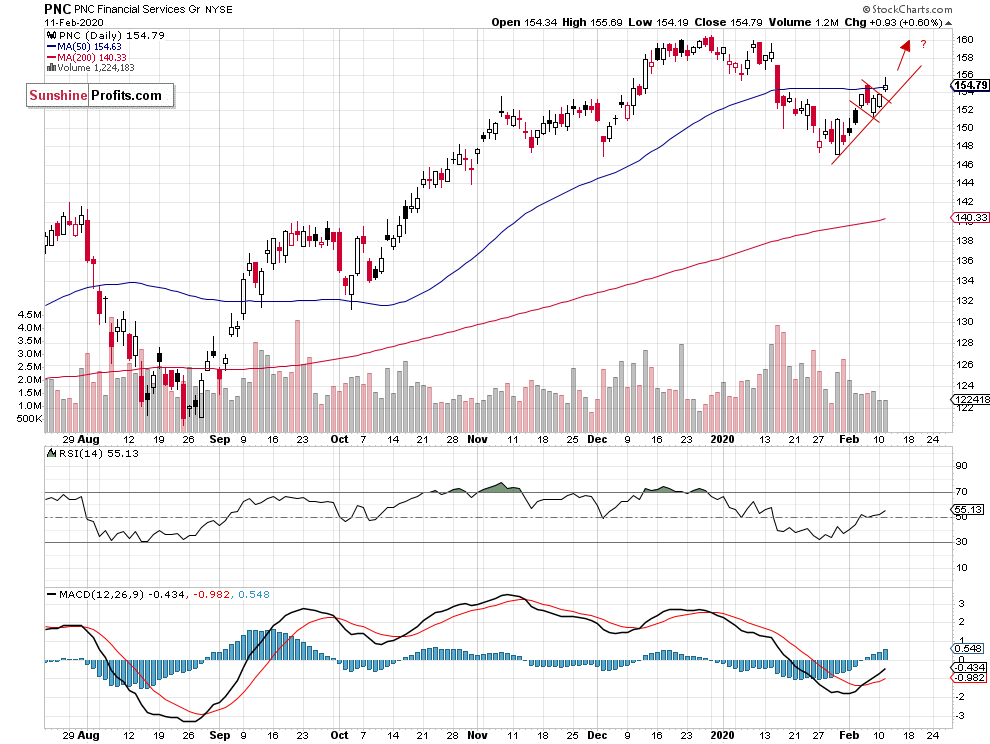
- Short-term uptrend
- Breakout above bull flag pattern
- Potential resistance level of $160
Top 3 Sell Candidates
NEE NextEra Energy Inc. - Utilities
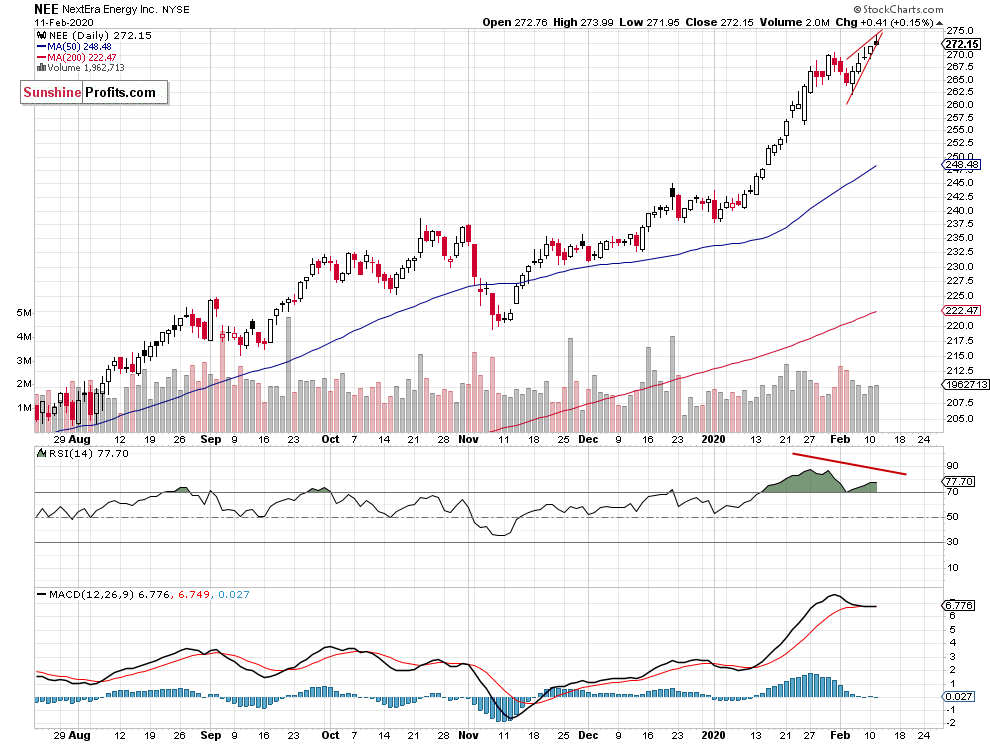
- Potential topping pattern - rising wedge
- Negative technical divergences
- Downward correction play
PLD ProLogis, Inc. - Real Estate
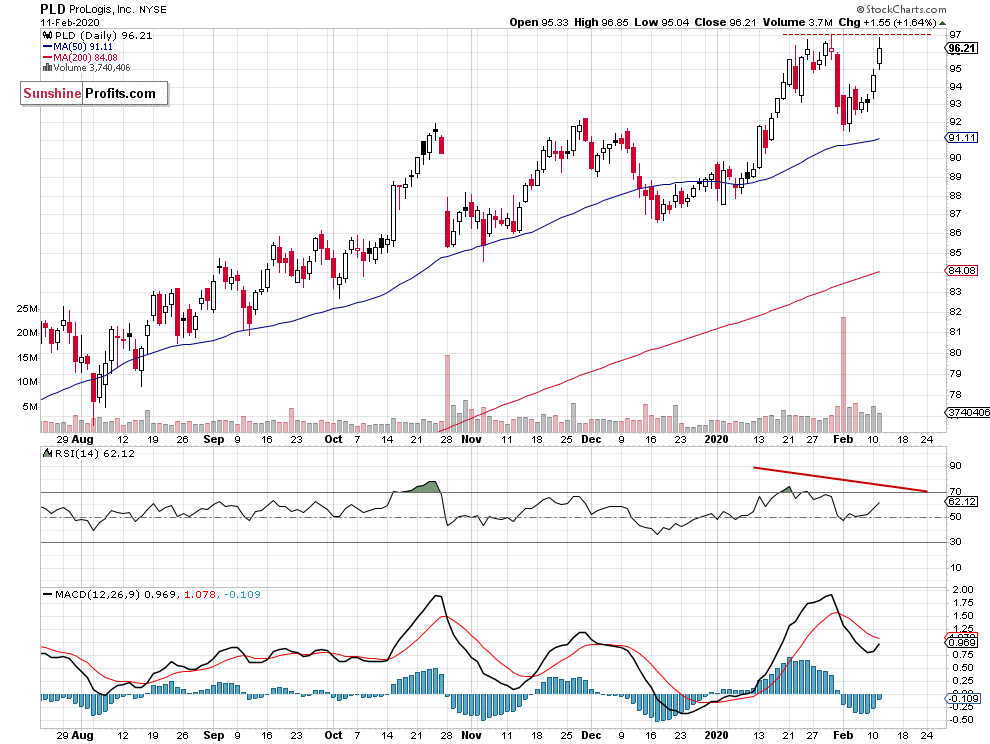
- Potential double top pattern
- Technical overbought conditions
- Negative technical divergences
- The resistance level of $97
AMD American Micro Devices, Inc. - Technology
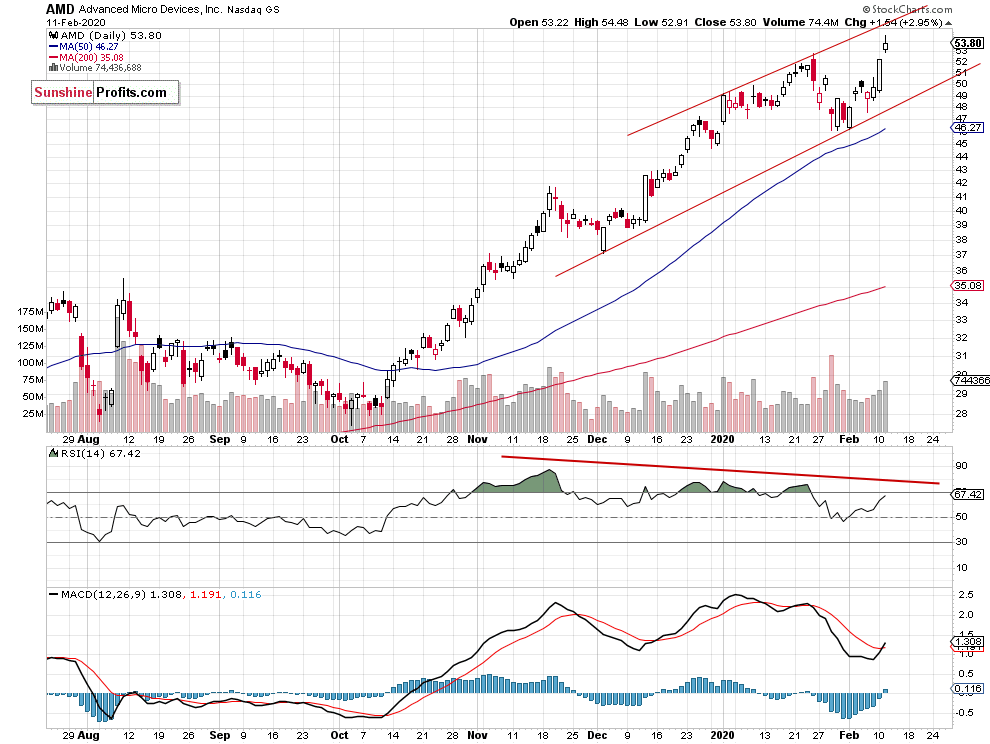
- Negative technical divergences
- Medium-term trading channel - resistance level of $54-55
Trend-following approach
Top 2 Buy Candidates
NRG NRG Energy Inc. - Utilities
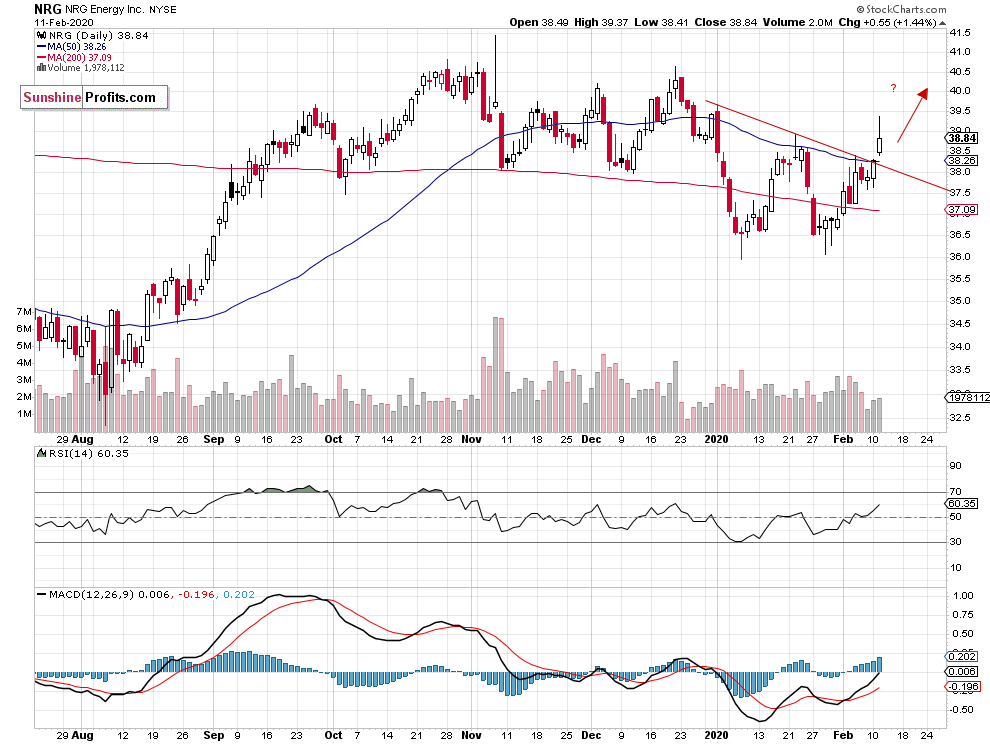
- Breakout above January trend line
- Potential support level of $38
- Resistance level and profit target level of $40-42
EXR Extra Storage Space Inc. - Real Estate
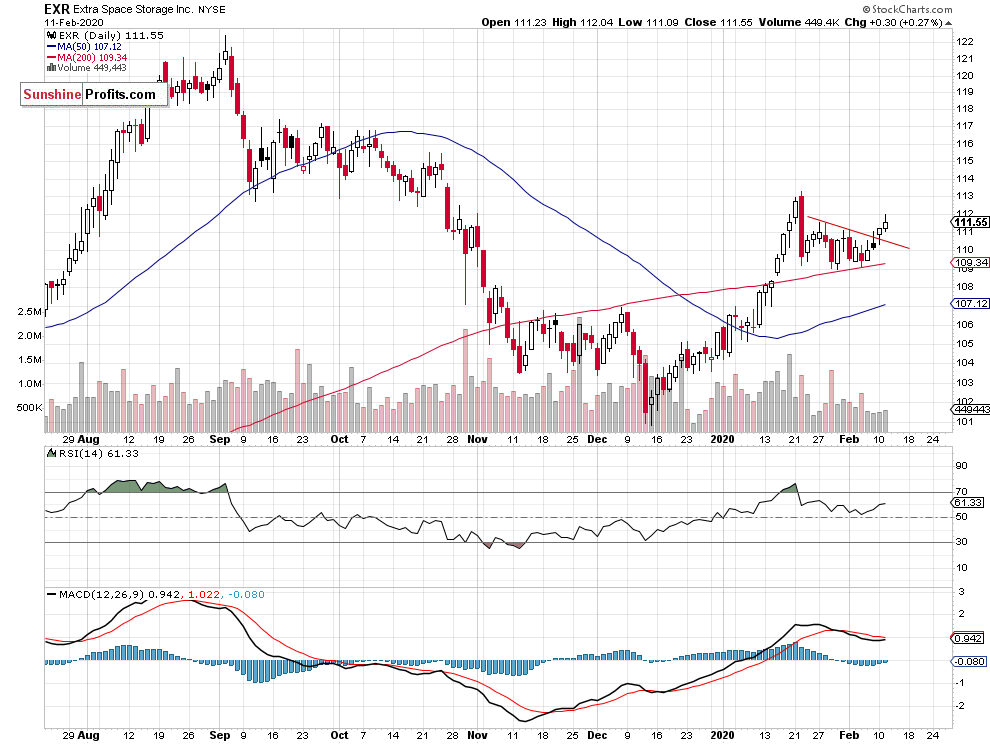
- Breakout above the short-term downward trend line
- Upward trend resuming play, potential upside price target of $115-117
Top 2 Sell Candidates
PXD Pioneer Natural Resources Co. - Energy
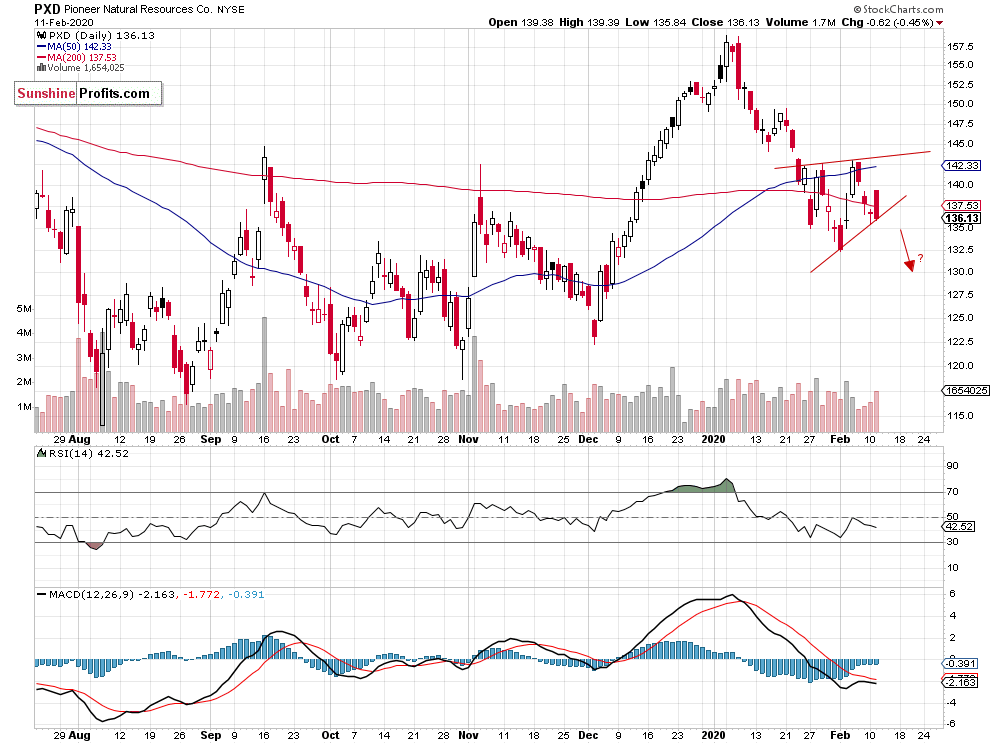
- Bear flag pattern following January's decline
- Potential downside price target of $125-130
- The resistance level remains at $140-145
DOW Dow Holdings Inc. - Materials
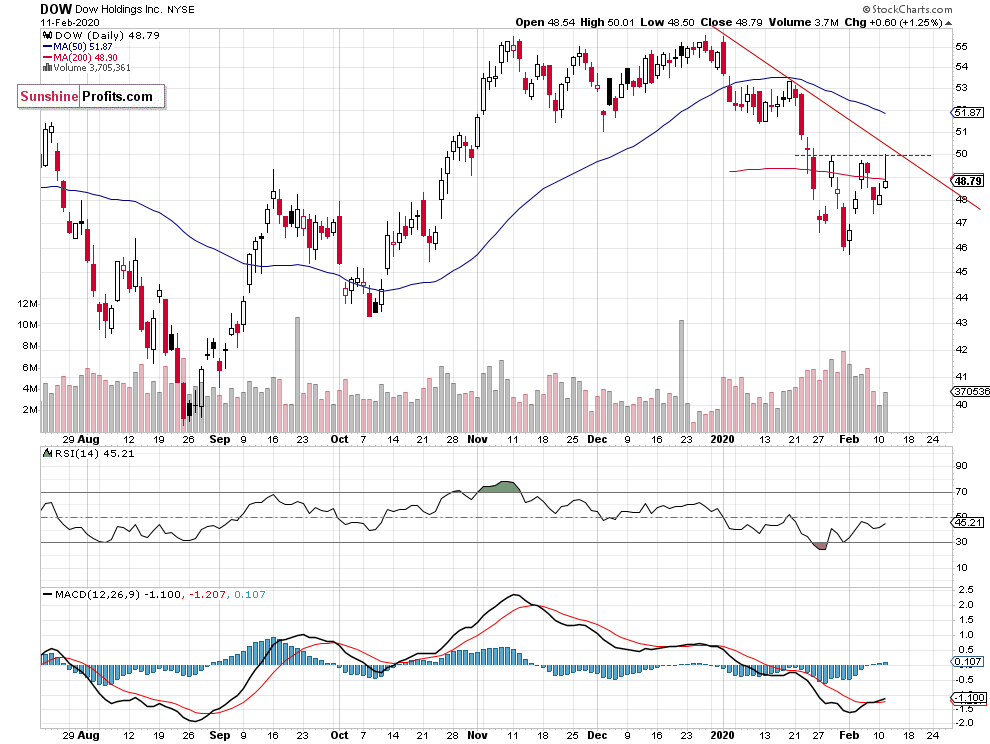
- Bear flag pattern or consolidation following January breakdown below $50
- Potential downside price target of $43-45
Conclusion
In our opinion, the following stock trades are justified from the risk/reward point of view between February 12 and February 18:
Long: PSX, DD, PNC, NRG, EXR
Short: NEE, PLD, AMD, PXD, DOW
Thank you.
Paul Rejczak
Stock Trading Strategist
Sunshine Profits - Effective Investments through Diligence and Care
* * * * *
Disclaimer
All essays, research and information found above represent analyses and opinions of Paul Rejczak and Sunshine Profits' associates only. As such, it may prove wrong and be a subject to change without notice. Opinions and analyses were based on data available to authors of respective essays at the time of writing. Although the information provided above is based on careful research and sources that are believed to be accurate, Paul Rejczak and his associates do not guarantee the accuracy or thoroughness of the data or information reported. The opinions published above are neither an offer nor a recommendation to purchase or sell any securities. Mr. Rejczak is not a Registered Securities Advisor. By reading Paul Rejczak's reports you fully agree that he will not be held responsible or liable for any decisions you make regarding any information provided in these reports. Investing, trading and speculation in any financial markets may involve high risk of loss. Paul Rejczak, Sunshine Profits' employees and affiliates as well as members of their families may have a short or long position in any securities, including those mentioned in any of the reports or essays, and may make additional purchases and/or sales of those securities without notice.

